|
|
Post by Admin on Sept 16, 2021 20:43:08 GMT
 Fig. 3 Multi-way admixture in Eastern Europe Mixing percentages (pie graphs) and dates (white text) inferred using the strongest admixture “direction” for 6 eastern European groups: Belarus (BE), Bulgaria (BU), Hungary (HU), Lithuania (LI), Poland (PO), Romania (RO), analyzed when disallowing copying from nearby groups, and Greece (GR), analyzed using the full set of 94 donors. Mixing percentages indicate percentages for three geographic regions: “N. Europe” (Northwest Europe and East Europe from clades of Table S11; blue), “Southern” (South Europe and West Asia; red) and “N.E.Asia” (Northeast Asia and Yakut; purple, also given above each pie), plus “other” (grey). All groups except Greece show evidence (p<0.05) of multi-way admixture involving sources along the approximate directions show by the arrows. Coancestry curves (black lines) for Bulgaria, fitted with an exponential decay curve (green lines), exemplify this multi-way signal. Each pairing of the three donor groups, each a proxy for the admixture source from a different region (Norway: N/E Europe, Oroqen: NE Asia, Greece: S. Europe and W. Asia), exhibits negative correlation (a dip) in ancestry weights at short genetic distances, implying at least three identifiably distinct ancestral sources mixing (approximately) simultaneously (9). Finally, Central Asia shows a particularly complex inferred history following a reanalysis of 10 groups excluding each other as donors, with nine of ten groups showing diverse recent events (Fig. 4A). The exception are the Kalash, a genetically isolated (39) population from the Hindu Kush mountains of Pakistan (40). Distinct, ancient and partially shared admixture signals (always dated older than 90BCE) are seen in six groups (Fig. 4B), including the Kalash (Figure 2C), whose strongest signal suggests a major admixture event (990-210BCE) from a source related to present-day Western Eurasians, though we cannot identify the geographic origin precisely. This period overlaps that of Alexander the Great (356-323BCE) whose army, local tradition holds, the Kalash are descended from (40), but these ancient events predate recorded history in the region, precluding confident interpretation. |
|
|
|
Post by Admin on Sept 16, 2021 22:31:16 GMT
 Fig. 4 Ancient and modern admixture in Central Asia (A) Dates (white text) and minority contributing sources for recent inferred events in 9 populations (circles), analyzed disallowing copying from nearby groups, showing contributions from Northeast Asia (purple) in the Hazara (HA), Uygur (UY) and Uzbekistani (UZ); East Asia (maroon) in Burusho (BU); West Asia (brown) in Pathan (PA); Africa (red) in Balochi (BA), Brahui (BR), Makrani (MA) and Sindhi (SI). Kalash (KA, grey) have no inferred recent event. (B) Inferred mixing percentages (pie graphs) and dates (white text gives upper CI bound) for additional, possibly shared, ancient events in 7 groups. Pie graphs show inferred donor make-up of each group after removing the recent event contribution from (A), if any, with colors referring to donors from “East Asia” (Southeast Asia from clades of Table S11; maroon), “Europe” (Northwest, East and South Europe; hot pink), Central “South Asia” (orange), “West Asia” (brown) and “other” (white). Arrows indicate “directions” of ancient admixture, with donor regions splitting into two pairs representing different sources. Coancestry curves (black lines) for Sindhi are superimposed for two different donor pairs representing proxies for admixing groups with ancestry indicated by the filled circles, indicating highly different exponential decay rates fit as a mixture of 7 and 94 generations (green lines). Our results demonstrate that it is possible to elucidate the effect of ancient and modern migration events, and to provide fine-scale details of the sources involved, complexity of events, and timing of mixing of groups, using genetic information alone. Where independent information exists from alternative historical or archaeological sources, our approach provides results consistent with known facts, and determines the amount of genetic material exchanged. In other cases, novel mixture events we infer are plausible, and often involve geographically nearby sources, supporting their validity. Admixture events within the past several thousand years affect most human populations, and this needs to be taken into account in inferences aiming to look at the more distant history of our species. Future improvements in whole-genome sequencing, greater sample sizes, and incorporation of ancient DNA – together with additional methodological extensions, are likely to allow better understanding of ancient events where little or no historical record exists, to identify many additional events, to infer sex biases, and to provide more precise event characterization than currently possible. We believe our approach will extend naturally to these settings, as well as to other species. Supplementary Material www.ncbi.nlm.nih.gov/pmc/articles/PMC4209567/bin/NIHMS60579-supplement-Supplementary_Material.pdf |
|
|
|
Post by Admin on Sept 17, 2021 22:19:11 GMT
Afghanistan from a Y-chromosome perspective Harlette Lacau, Tenzin Gayden, Maria Regueiro, Shilpa Chennakrishnaiah, Areej Bukhari, Peter A Underhill, Ralph L Garcia-Bertrand & Rene J Herrera European Journal of Human Genetics volume 20, 1063–1070 (2012) Abstract Central Asia has served as a corridor for human migrations providing trading routes since ancient times. It has functioned as a conduit connecting Europe and the Middle East with South Asia and far Eastern civilizations. Therefore, the study of populations in this region is essential for a comprehensive understanding of early human dispersal on the Eurasian continent. Although Y- chromosome distributions in Central Asia have been widely surveyed, present-day Afghanistan remains poorly characterized genetically. The present study addresses this lacuna by analyzing 190 Pathan males from Afghanistan using high-resolution Y-chromosome binary markers. In addition, haplotype diversity for its most common lineages (haplogroups R1a1a*-M198 and L3-M357) was estimated using a set of 15 Y-specific STR loci. The observed haplogroup distribution suggests some degree of genetic isolation of the northern population, likely due to the Hindu Kush mountain range separating it from the southern Afghans who have had greater contact with neighboring Pathans from Pakistan and migrations from the Indian subcontinent. Our study demonstrates genetic similarities between Pathans from Afghanistan and Pakistan, both of which are characterized by the predominance of haplogroup R1a1a*-M198 (>50%) and the sharing of the same modal haplotype. Furthermore, the high frequencies of R1a1a-M198 and the presence of G2c-M377 chromosomes in Pathans might represent phylogenetic signals from Khazars, a common link between Pathans and Ashkenazi groups, whereas the absence of E1b1b1a2-V13 lineage does not support their professed Greek ancestry. Introduction The Islamic Republic of Afghanistan is a landlocked nation in southwest Central Asia. Its central highlands include the Hindu Kush Mountains that extend from the northeast of the country to the southwest, separating Afghanistan into northern and southern provinces (Figure 1). Afghanistan has served as crossroads for human migrations and pilgrimages, including an important stop along the Silk Road. Mesolithic artifacts, Neolithic pottery (about 7.2 kya), bones of domesticated animal and tools (eg, sickle blades used to collect wild grasses) have been uncovered during excavations in the Ghar-i-Mar (Snake Cave) site, in north Afghanistan, indicating early cultivation of wheat and barley (9–11 kya) and domestication of animals (7–9 kya).1 More recent archeological discoveries include Buddhist relics transported northward from India along the Silk Road, as well as inscriptions engraved on rocks in ancient Hebrew dating from the eleventh to the thirteenth centuries.2 Although it is still unknown when urban civilizations began in what is now Afghanistan, historians speculate that it possibly occurred between 4 and 4.5 kya.3 Historical records indicate that Aryans from Iran were the first to occupy Afghanistan (eighth century B.C.E.) followed by Persians (sixth century B.C.E), Greeks (fourth century B.C.E.), Mauryans from India (ushered Buddhism into the region), Greco-Bactrians, Arabs (introduced Islam) and Mongols among others.3 Figure 1 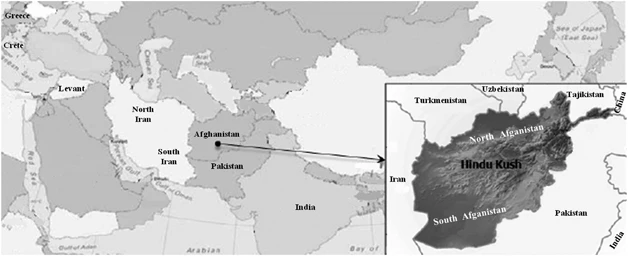 Geographic location of the populations analyzed for CA, ML and AMOVA. For population description see references in Table 1. The official languages of Afghanistan, Dari and Pashto, are of Indo-European origin and are spoken by the Tajiks and Pathans or Pashtuns, respectively. Pathans live primarily south of the Hindu Kush Mountains and comprise the most prevalent ethnic group in Afghanistan (42%) while representing approximately 15% of the population of neighboring Pakistan. Although different origins for Pathans, including Greek and Jewish ancestry, have been suggested,3, 4 these affiliations have not been demonstrated and only a few studies characterizing the genetic structure of this group in Pakistan,5, 6, 7, 8, 9 Afghanistan10 and India11 have been published. Given the limited amount of genetic data available, the present study was undertaken to ascertain, for the first time, the genetic diversity of Pathans in Afghanistan utilizing high-resolution Y-chromosome binary markers. The data generated were subsequently compared with previously published geographically and ethnically targeted worldwide populations to explore paternal signals of modern humans’ dispersals across Central Asia. In addition, we assessed genetic affinities between Pathans from Afghanistan and Pathans from neighboring Pakistan, as well as their hypothesized phylogenetic relation to Greek and Jewish populations. |
|
|
|
Post by Admin on Sept 18, 2021 1:02:04 GMT
Materials and methods Sample collection and DNA isolation Blood samples were obtained with informed consent from 190 unrelated males representing the general population of Pathans from Afghanistan. The collection was subsequently divided along the Hindu Kush Mountain Range into north Afghanistan (n=44) and south Afghanistan (n=146) to assess the role of the massif as a barrier and/or corridor to gene flow between the two regions (Figure 1). Donors provided information about their paternal ancestry for at least two previous generations. The samples were collected in accordance with the ethical guidelines of the institutions involved in this study. Genomic DNA was extracted and stored as previously described.12, 13 Y-SNP and Y-STR genotyping A total of 116 bi-allelic markers (Figure 2) were hierarchically genotyped as previously described.14, 15 The nomenclature followed for the Y-SNP haplogroup assignment is in accordance with the Y Chromosome Consortium15 and subsequent updates.16, 17 The 17-loci Y-STR haplotype data from our previous report18 were utilized in the current investigation to perform pertinent Y-STR-based analyses. Figure 2 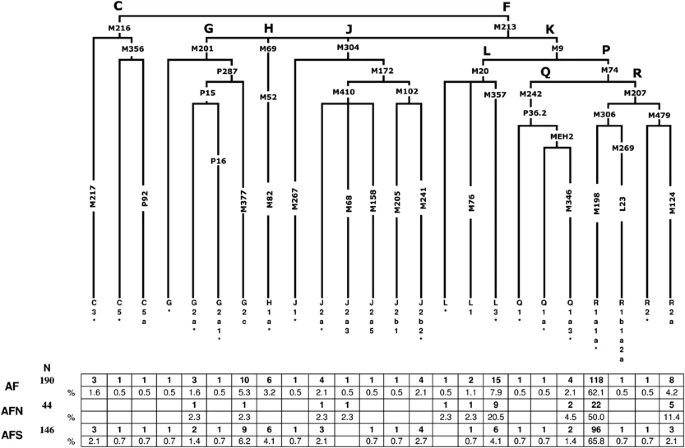 Hierarchical phylogenetic relationships of Y-chromosome haplogroups and their percentages in Afghanistan. The following 77 markers were typed but were not polymorphic in the populations: C3a-M93, C3b-P39, C3c-M77, C3d-M407, C3e-P53.1, C3f-P62, DE-YAP, F1-P92, F2-M427, F2-M428, F3-P96, F3-M282, F4-P254, G1-M285, G2a1a-P18, G2a2-M286, H1a1-M197, H1a2-M97, H1a3-M39, H2-Apt, I-M258, J1a-M62, J1b-M365, J1c-M390, J1d-P56, J1e-PAGE8, J2a1-M47, J2a2-M67, J2a2a-M92, J2a2b-M163, J2a4-M137, J2a6-M289, J2a7-M318, J2a8-M319, J2a9-M339, J2a10-M340, J2a11-M419, J2a12-P81, J2a13-P279, J2b2a-M99, J2b2b-M280, J2b2c-M321, J2b2d-P84, K1-M147, K2-P60, K3-P79, K4-P261, L2-M317, M-P256, NO-M214, O-M175, Q1a1-M120, Q1a2-M25, Q1a3a-M3, Q1a4-P48, Q1a5-P89, Q1a6-M323, Q1b-M378, R1a1a1-M56, R1a1a2-M157, R1a1a3-M204, R1a1a4-P98, R1a1a5-PK5, R1a1a6-M434, R1a1a7-M458, R1b1b1a-M412, R1b1b1a1a-M405/U106, R1b1b1a1b1-U152, R1b1b1a1b2a-M222, R1b1b1a1b2b-M37, R1b1b1a1b2c1-P66, R1b1b1a1b3-M65, R1b1b1a1b4-M153, R1b1b1a1b5-M167, R1b1b-M335, S-M230 and T-M184. Statistical and phylogenetic analyses To assess the phylogenetic relationships between the two Afghan collections and 16 geographically targeted reference populations (Table 1),19, 20, 21, 22 a correspondence analysis (CA)23 plot, Maximum-Likelihood (ML)24 dendrogram and Analysis of Molecular Variance (AMOVA)25 were generated. In order to make informative comparisons, the above-mentioned analyses were performed at the highest resolution available across reference populations (Table 1). Pair-wise genetic distances (Rst)26, 27 for populations included in Supplementary Table 1 were calculated using the 7-loci R1a1a-M198 haplotypes with the ‘Microsat’ software (http://hpgl.stanford.edu/projects/microsat/). The Rst distances calculated were subsequently utilized to construct a multi-dimensional scaling (MDS) projection with the statistical software package SPSS ver. 14.0 (SPSS, Chicago, IL, USA, 2001). In addition, spatial frequency maps based on individuals in the L-M20, L3-M357, R1a1a-M198 and R1a1a*-M198 haplogroups were generated using the Surfer software version 9 (Golden software Inc., Cold Spring Harbor, NY, USA; www.goldensoftware.com/). Haplotypes of individuals belonging to the above haplogroups were employed to generate median-joining (MJ) networks using NETWORK 4.5.1.6 (http://www.fluxus-engineering.com).28 All reference populations included in the network analyses are provided in Supplementary Table 1 (L-M20, L3-M357, R1a1a-M198 and R1a1a*-M198) and for the contour maps in Supplementary Tables 2 (R1a1a-M198 and R1a1a*-M198) and 3 (L-M20 and L3-M357). Supplementary Table 4 presents haplogroup and haplotype data for north and south Afghanistan. The Y-STR markers were weighted inversely to their repeat variance20 and the Maximum Parsimony option was selected to obtain the least complex topology. Expansion times based on Y-STR variation within L-M20, L3-M357, R1a1a-M198 and R1a1a*-M198 lineages present in the reference populations (Supplementary Table 5) were recalculated using the method described elsewhere.8, 29, 30 In addition, haplotype variance for the above-mentioned haplogroups were calculated using the Vp formula provided in Kayser et al.31 |
|
|
|
Post by Admin on Sept 18, 2021 2:41:07 GMT
Distribution of Y-chromosome haplogroups From a total of 116 binary markers typed, we identified 25 paternal lineages in 190 Afghan males, 11 of which were observed in north Afghanistan and 22 in the southern collection, (Figure 2) indicating a relatively higher degree of genetic diversity in the region south of the Hindu Kush range with respect to the north. However, this finding should be tempered considering the difference in sample size between the two collections. Overall, only haplogroups R1a1a*-M198 (62.1%), L3*-M357 (7.4%) and G2c-M377 (5.3%) display frequencies >5% and collectively comprise nearly three-fourths of the Afghanistan paternal gene pool. The majority of the Afghan individuals examined in the current investigation belong to haplogroup R-M207 (67.4%), with sub-haplogroup R1a1a*-M198 predominating in both the north (50%) and south (65.8%) collections (Figure 2). This is also reflected in the contour maps of R1a1a-M198 (Supplementary Figure 1a) and R1a1a*-M198 (Supplementary Figure 1b). It is interesting to note that the paralagous branch, R2a-M124, is observed at a considerably higher proportion in north Afghanistan (11.4%) as compared with the south (2.1%) and that haplogroups R2*-M479 (0.7%) and R1b1a2a-L23 (0.7%) are detected, albeit at low frequencies, exclusively in the southern region of the country. Haplogroup L-M20 (9.5%), the second most abundant in this study, exhibits substantial disparity in its distribution on either side of the Hindu Kush range, with 25% of the northern Afghans belonging to this lineage, compared with only 4.8% of males from the south. Specifically, paragroup L3*-M357 accounts for the majority of the L-M20 chromosomes in both the north (20.5%) and south (4.1%) collections as evident in the contour maps provided in Supplementary Figures 2a (L-M20) and 2b (L3-M357) in Afghanistan and surrounding regions. Haplogroup G-M201, which occurs at an average frequency of 7.9% in the Afghan gene pool, is reported at high frequencies in the Caucasus (eg, 74% in Ossetians from Digora)32 and it is thought to be associated with the Neolithic expansion throughout the region.33 Although G2c-M377 is the second most frequent haplogroup in south Afghanistan (6.2%), it is found at substantially lower levels in the northern population (2.3%). With the exception of sub-lineage G2a*-P15, observed in the north (2.3%) and south (1.4%), the remaining G derivatives (G2a1*-P16 (0.7%) and G*-M201 (0.7%)) are found exclusively in the southern provinces. Likewise, haplogroups C-M216 (3.4%) and H1a*-M82 (4.1%) are restricted to individuals from the south. Other informative haplogroups that are shared between the north and south include J-M304 and Q-M242. In the north, the aforementioned haplogroups are defined by the J2a*-M410 (2.3%), J2a3-M68 (2.3%) and Q1a3*-M346 (4.5%) mutations. Southern Afghans, in contrast, are characterized by five sub-clades within haplogroup J-M304 (ie, J1*-M267, J2a*-M410, J2a5-M158, J2b1-M205 and J2b2-M241) collectively at frequency of <3%, as well as by sub-haplogroups Q1a3*-M346 (1.4%), Q1*-P36.2 (0.7%) and Q1a*-MEH2 (0.7%). Population relationships In the CA plot (Figure 3a), the collections from north and south Afghanistan are part of a loose aggregate in the right half, near the center of the graph, with several neighboring populations from Pakistan. The Greeks, Ashkenazi Jews and north and south Iranians partition separately from the Pakistani and Afghani collections on the upper-left quadrant. Interestingly, Hazara from Pakistan is an outlier, possibly reflecting its unique ancestry. The genetic affinities of the 18 populations from Table 1 are illustrated in the ML tree (Supplementary Figure 3), where geographic structuring is apparent, with a few exceptions. For example, unlike the partitioning observed in the CA plot, the ML dendrogram illustrates a separation between north and south Iran, with the former branching together with Hazara from Pakistan, an outlier in the CA plot. AMOVA (Table 2) was performed to investigate potential geographic correlations with the genetic profiles of the north and south Afghanistan populations, as well as reference collections. As anticipated, the highest fraction of variability was found within populations. Variance components indicate a greater degree of geographical correlation among groups of populations as compared with among populations within groups. Figure 3 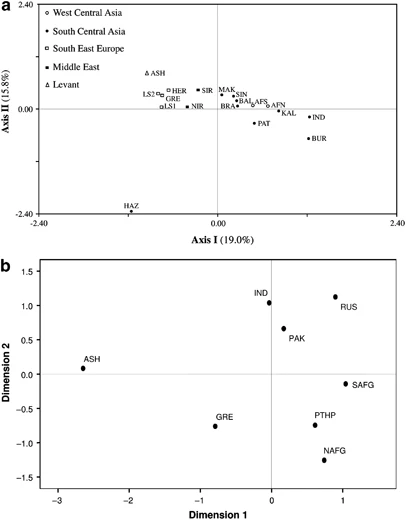 (a) CA constructed utilizing the NTSYSpc 2.02i software (Applied Biostatistics Inc., Setauket, NY, USA) and based on Y-chromosome haplogroups. Population abbreviations are given in Table 1. (b) MDS plot based on Rst distances of R1a1a-M198 haplotype frequencies of Pathans, Ashkenazi Jews, Greeks, Indians and Pakistani samples. For the MDS analysis Stress=0.06142. Population codes are: NAFG=Pathans from north Afghanistan, SAFG=Pathans from south Afghanistan, PTHP=Pathans from Pakistan, RUS=Russians (South Central Russia, South Western Russia, North Western Russia and Uralic Russia), GRE=Greeks, ASH=Ashkenazi Jews, IND=India and PAK=Pakistan general population. Populations used in the analysis are listed in Supplementary Table 1. The MDS plot based on R1a1a-M198 (Figure 3b) haplotypes was executed to examine the genetic affinities among Pathans from Afghanistan and Pakistan in addition to several other pertinent reference populations (Supplementary Table 1). In Figure 3b, Pathans from Afghanistan and Pakistan plot close to each other in the lower-right quadrant, whereas populations from India, Pakistan and Russia loosely cluster in the upper-right section of the graph. In contrast, the Ashkenazi Jewish collection lies in the upper-left quadrant partitioning distant from all other populations included in the analysis. |
|

