|
|
Post by Admin on Sept 18, 2021 5:00:10 GMT
Network projections and time estimates Figure 4a illustrates MJ network based on the eight-loci Y-STR profile of R1a1a*-M198 individuals from different regions throughout Eurasia. The most abundant haplotype (DYS19*16, DYS389I*13, DYS389II*17, DYS390*24, DYS391*11, DYS392*11, DYS393*13 and DYS439*10) is observed in 5 (11.3%) individuals from north Afghanistan and 35 (24%) Afghans from the southern collection. In contrast, the second most common haplotype (DYS19*16, DYS389I*13, DYS389II*17, DYS390*25, DYS391*11, DYS392*11, DYS393*13 and DYS439*10), is prevalent in north Afghanistan (6.8%) compared with the south collection (4.8%) and it is also found among Russia, Ukraine, Slovakia and Turkey. Interestingly, the third most frequent haplotype (DYS19*16, DYS389I*13, DYS389II*17, DYS390*25, DYS391*10, DYS392*11 and DYS393*13) in the R1a1a-M198 projection (Supplementary Figure 4a) is mainly shared among Ashkenazi Jews from western and eastern Europe (4.1%) and south Afghans (3.4%), but absent in individuals from north Afghanistan. Figure 4 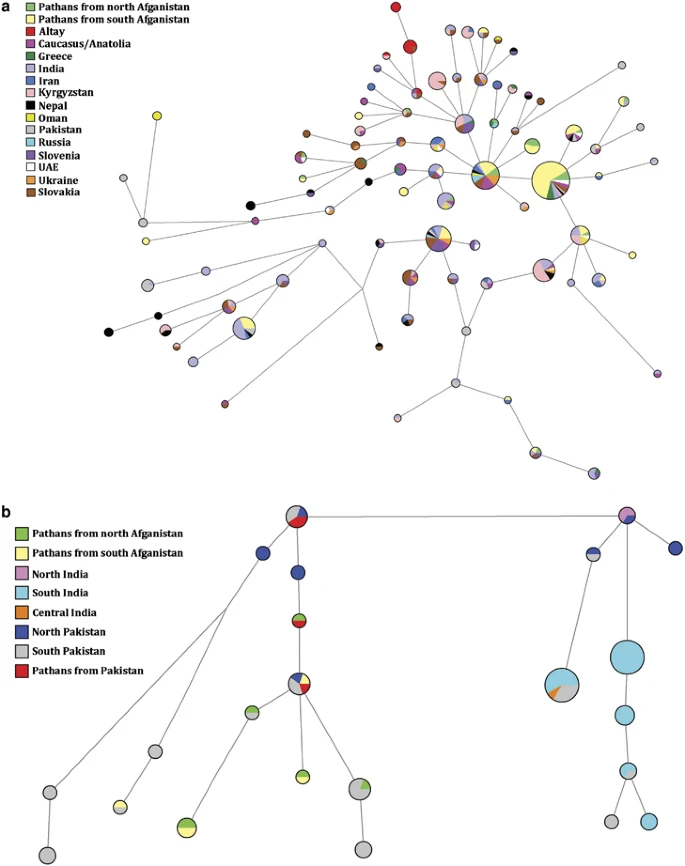 (a) Network projection of populations analyzed for R1a1a*-M198 at the resolution of eight-loci: DYS389I, DYS389II, DYS390, DYS391, DYS392, DYS393, DYS19 and DYS439. (b) Network projection of populations analyzed for L-M20 at the resolution of eight-loci: DYS389I, DYS389II, DYS390, DYS391, DYS392, DYS393, DYS19 and DYS439. Populations used for the analysis are listed in Supplementary Table 1. In Figure 4b, the most abundant haplotype (DYS19*14, DYS389I*12, DYS389II*16, DYS390*22, DYS391*10, DYS392*14, DYS393*11 and DYS439*13) among the L-M20 individuals examined comprises 7 (2.3%) samples from southern India and 12 (13.2%) from south Pakistan. Only one individual (2.3%) from North Afghanistan shares this haplotype. The other prevalent L-M20 haplotype (DYS19*14, DYS389I*12, DYS389II*16, DYS390*22, DYS391*10, DYS392*14, DYS393*11 and DYS439*12) is shared exclusively among 12 (4.0%) individuals from southern India and 3 (3.3%) from southern Pakistan. A network analysis based on L3-M357 was not informative because of the limited number of individuals and populations available for comparison (Supplementary Figure 4b). Supplementary Table 5 presents coalescence time estimations based on Y-STR diversity as well as haplotype variances associated with haplogroups L-M20, L3-M357, R1a1a-M198 and R1a1a*-M198 in Afghanistan and other reference populations. In addition, for the studied populations of north and south Afghanistan, we performed time estimate and haplotype variance calculations for L3*-M357. In the case of R1a1a-M198, the evolutionary time estimates based on seven Y-STR loci is 7.8±2.2 kya for the Afghanistan populations. The oldest dates for this haplogroup are observed in Pakistan (19.1±2.9 kya) and India (17.9±3.7 kya). Time estimates for Haplogroup L-M20 in north (14.6±7.3 kya) and south (17.8±8.4 kya) Afghanistan are more recent than in Pakistan (26.3± 5.3 kya). When L3-M357 and Ra1a1*-M198 are considered, the same pattern of relative ages are seen across the above-mentioned populations, with the older dates detected in Pakistan and in the Indian subcontinent. |
|
|
|
Post by Admin on Sept 18, 2021 5:51:30 GMT
Discussion
Although both Afghan populations are characterized predominantly by R1a1a*-M198 lineages, the two differ in the distribution of their remaining haplogroups. South Afghanistan is represented by 22 polymorphic binary markers, 14 of which are absent from the northern region (Figure 2), suggesting reduced genetic diversity in the latter population. A plausible explanation for the reduced diversity might be the presence of the Hindu Kush Mountain range, which may have served as a directional barrier to gene flow.
South Central Asian influence in Afghanistan
Haplogroup R1a1a*-M198, unlike other haplogroups, which are more geographically confined, is present at informative frequencies in a wide range of populations extending from Northern and Eastern Europe to Eastern Siberia, Central and Southern Asia.16 Eastern Europe (Ukraine)34 and South Central Asia16, 35 are proposed as the most likely places of origin because in both regions R1a1a-M198 is observed at frequencies >50%. According to Underhill et al,16 the highest Y-STR haplotype diversity for the R1a1a*(xM458) lineage is observed in South Central Asia with a coalescent time of 14 kya, suggesting that this region is the likely source of the dispersal for the M198 mutation. Alternatively, Klyosov36 claims that haplogroup R1a1a-M198 originated in South Siberia about 20 kya. Unfortunately, discrepancies between the methods used to compute TMRCA in these previous studies16, 35, 36 hinder fair comparisons with those generated in the present report. The high R1a1a haplotype diversity observed in the network projection (Supplementary Figure 4a), as well as the substantially older time estimates and high haplotype variance (Supplementary Table 5) obtained for South Central Asia (Pakistan and India) as compared with South Central Russia (Shors and Tuvinians) and Afghanistan, argues for the South Central Asian origin of this marker. Because TMRCA calculations depend on sample size, mutation rate and the number of loci examined, the data generated should be interpreted with caution and alternative approaches and/or interpretation should not be ignored.
The R1a1a-M198 network (Supplementary Figure 4a) indicates that the Afghans exhibit the highest haplotype sharing (total of 69 individuals) with populations from South Central Asia and particularly with Pathans from Pakistan. When the analysis was performed at R1a1a*-M198 (Figure 4a), we see a similar haplotype sharing with South Central Asia. Unfortunately, Pathans from Pakistan were not included in the analysis because they were not typed at the R1a1a*-M198 resolution. Genetic affinities among the above-mentioned populations that share high frequency of R1a1a*(xM458) are also observed in the CA plot (Figure 3a), which illustrates both Afghan populations clustering with most of the neighboring groups from Pakistan, whereas India plots more distantly. This finding is consistent with the AMOVA results, which indicates the impact of geography on population differentiation. However, the second most common seven-loci R1a1a-M198 haplotype (DYS389I*13, DYS389II*17, DYS390*25, DYS391*11, DYS392*11, DYS393*13 and DYS19*16) possessed by 66 individuals in the projection (Supplementary Figure 4a) differs from the modal haplotype by one repeat at locus DYS390 and corresponds to the most abundant haplotype of Russia/Ukraine and the Balkans reported by Klyosov.36 This basal haplotype is also the second most common haplotype in the R1a1a*-M198 network (Figure 4a) with similar groups of populations. The sharing of similar seven-loci haplotypes (mostly differing by a single repeat) along with relatively close age estimates (Supplementary Table 5) among populations with significant R1a1a-M198 frequencies may be indicative of common ancestry.
Haplogroup L-M20, on the other hand, was hypothesized to have originated in India or the Middle East37 approximately 30 kya. This marker, which is found at 25% in north Afghanistan and 4.8% in the south, has also been previously reported at high frequencies (48%) in the Kallar community of South India33 as well as in the Druze (35%) population from Israel.38 Time estimates generated based on seven Y-STR loci within L-M20 lineages for north (14.6±7.3 kya) and south (17.8±8.4 kya) Afghanistan populations are intermediate to those of Pakistan (26.3±5.3 kya) and India (7.5±1.7 kya) (Supplementary Table 5). Furthermore, Pakistan displays higher haplotype variance (0.548) than India (0.118), suggesting that L-M20 most likely originated in what is today Pakistan rather than in India. In addition, evolutionary time estimates (Supplementary Table 5) generated for L3-M357 lineages when combining north and south Afghanistan populations (11.4±5.0 kya) are comparable to those computed for Pakistan (10.8±3.8 kya) and higher than India (5.2±2.4 kya) at the seven-loci resolution. This finding supports the notion that the L3-M357 sub-clade is of Afghani or Pakistani origin and subsequently spread southernly to India.
Similarity between Pathans from Afghanistan and Pakistan
Our study demonstrates close genetic ties between Pathans from Afghanistan and Pakistan. The affinity between Pathans from these two regions is expected considering that the Durand Line, which established Afghanistan southeastern limits since 1893, was imposed without concern to tribal and ethnic affiliations. The CA (Figure 3a) and ML analysis (Supplementary Figure 3) support this genetic similarity since both north and south Afghanistan cluster proximal to Pakistan. The inclusion of additional haplotype data from 41 Pathans residing in the city of Peshawar in northwestern Pakistan5 (available in the YHRD database) indicates that their most abundant seven-loci haplotype (29.3%) is identical to our modal haplotype, confirming the genetic similarities between Pathans from Afghanistan and Pakistan. This phylogenetic relationship is similarly evident in the MDS graph (Figure 3b), where all three Pathan populations group close to each other. Also, in the network projection of R1a1a-M198 (Supplementary Figure 4a), these populations share various haplotypes. Moreover, the presence of haplogroups L3-M357 and Q1a3-M346 in both Pathans from Afghanistan and Pakistan8, 9 further supports genetic relationships among Pathans from these two regions.
On the origins of Pathans
Although Greeks and Jews have been proposed as ancestors to Pathans,3, 4 their genetic origin remains ambiguous. The Lasithi Plateau isolate, in the highlands of eastern Crete, partitions relatively close to the Afghanistan populations in the CA graph (Figure 3a), which could be attributed to the elevated proportion of R1a1a chromosomes20 shared among them. However, the absence of the predominantly Greek E1b1b1a2 -V13 lineage39 in Pathans does not argue for genetic contributions from Greece. Ashkenazi Levites and our north and south Afghanistan populations, on the other hand, exhibit significantly higher frequency of the R1a1a-M198 haplogroup (51.7%, 50.0% and 65.8%, respectively), whereas lower frequencies are detected in Ashkenazi Cohanims (1.3%) and Ashkenazi Israelites (4.0%).40 Overall, Ashkenazi Jews exhibit a frequency of 15.3% for haplogroup R1a1a-M198.37 Nebel et al41 proposed, on the basis of moderate to high frequency of R1a1a in Central Asia and southern Russia/Ukraine, that these R1a1a chromosomes in Ashkenazi groups might represent vestiges of Khazars. It is thought that this Turkic tribe from Central Asia had converted to Judaism at the end of the Eighth century C.E. and, after the fall of their kingdom, they spread and were assimilated by the emerging Ashkenazi community in Eastern Europe. We envision a plausible scenario in which the converted Khazars could have been absorbed by the early Pathans and that R1a1a-M198 drifted to high frequency in Afghanistan, with the Khazars being the common nexus between Ashkenazi Jews and Pathans. In addition, the Jewish traditions (particularly circumcision, a talith prayer shawl, shabbat, praying in the direction of Jerusalem during the Day of Atonement or Yom Kippur and the Magen David symbol in their houses, among several others)2 observed among Pathans from Afghanistan and the presence of haplogroup G2c-M377, a lineage commonly observed among the Ashkenazi Jewish population (∼7%),42 are congruent with the above-stated hypothesis.
Conclusion
The diversity of Y-chromosome haplogroups in the Afghanistan populations examined in this study reflects the history of the area signaling multiple migrations over thousands of years. Our results indicate that Afghanistan exhibits patrilineal elements from the Neolithic revolution dispersal across Central Asia. The observed haplogroup distribution suggests some degree of genetic isolation of the northern population, likely because of the Hindu Kush Mountain range acting as a barrier and separating them from the southern Afghans who have greater contact with neighboring Pakistan and migrants from the Indian subcontinent and Central Asia. Our study demonstrates genetic similarity among Pathans from Afghanistan and Pathans from Pakistan, supported by a significant number of individuals belonging to haplogroup R1a1a-M198 and sharing the same modal haplotype. Genetic signatures of South Central Asian populations are evident in their patrilineages and may represent gene flow associated with the Silk Road migrations. In addition, the high frequencies of R1a1a-M198 chromosomes and the sharing of seven Y-STR loci haplotypes among Pathans, Ashkenazi Jews and west Russians may represent vestiges from the Khazars of Central Asia that converted to Judaism at the end of the Eighth century C.E., connecting Pathans with certain Ashkenazi Jews by the way of a common Khazar ancestry.
|
|

