|
|
Post by Admin on Feb 6, 2021 20:21:44 GMT
Genes that determine the shape of a person's facial profile have been discovered by a UCL-led research team. The researchers identified 32 gene regions that influenced facial features such as nose, lip, jaw, and brow shape, nine of which were entirely new discoveries while the others validated genes with prior limited evidence. The analysis of data from more than 6,000 volunteers across Latin America was published today in Science Advances. The international research team, led from UCL, Aix-Marseille University and The Open University, found that one of the genes appears to have been inherited from the Denisovans, an extinct group of ancient humans who lived tens of thousands of years ago. The team found that the gene, TBX15, which contributes to lip shape, was linked with genetic data found in the Denisovan people, providing a clue to the gene's origin. The Denisovans lived in central Asia, and other studies suggest they interbred with modern humans, as some of their DNA lives on in Pacific Islanders and Indigenous people of the Americas. Co-corresponding author Dr. Kaustubh Adhikari (UCL Genetics, Evolution & Environment and The Open University) said: "The face shape genes we found may have been the product of evolution as ancient humans evolved to adapt to their environments. Possibly, the version of the gene determining lip shape that was present in the Denisovans could have helped in body fat distribution to make them better suited to the cold climates of Central Asia, and was passed on to modern humans when the two groups met and interbred." Co-first author Dr. Pierre Faux (Aix-Marseille University) said: "To our knowledge this is the first time that a version of a gene inherited from ancient humans is associated with a facial feature in modern humans. In this case, it was only possible because we moved beyond Eurocentric research; modern-day Europeans do not carry any DNA from the Denisovans, but Native Americans do." Co-first author Betty Bonfante (Aix-Marseille University) added: "It is one of only a few studies looking for genes affecting the face in a non-European population, and the first one to focus on the profile only." Researchers have only been able to analyze complex genetic data from thousands of people at once over the last two decades, since the mapping of the human genome enabled the use of genome-wide association studies to find correlations between traits and genes. This study compared genetic information from the study participants with characteristics of their face shape, quantified with 59 measurements (distances, angles and ratios between set points) from photos of the participants' faces in profile. Co-corresponding author Professor Andres Ruiz-Linares (Fudan University, UCL Genetics, Evolution & Environment, and Aix-Marseille University) said: "Research like this can provide basic biomedical insights and help us understand how humans evolved." 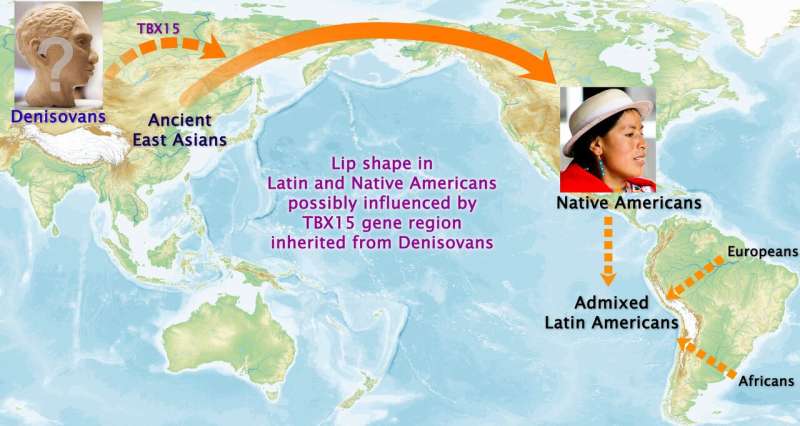 The findings of this research could help understand the developmental processes that determine facial features, which will help researchers studying genetic disorders that lead to facial abnormalities. The results also contribute to the understanding of the evolution of facial appearance in human and other species. One of the newly discovered genes found in this study is VPS13B, which influenced nose pointiness; the researchers also found that this gene affects nose structure in mice, indicating a broadly shared genetic basis among distantly related mammal species. Explore further Genes for nose shape found More information: "A GWAS in Latin Americans identifies novel face shape loci, implicating VPS13B and a Denisovan introgressed region in facial variation" Science Advances (2021). DOI: 10.1126/sciadv.abc6160 |
|
|
|
Post by Admin on Feb 7, 2021 3:24:49 GMT
A GWAS in Latin Americans identifies novel face shape loci, implicating VPS13B and a Denisovan introgressed region in facial variation
Science Advances 05 Feb 2021:
Vol. 7, no. 6, eabc6160
DOI: 10.1126/sciadv.abc6160
Abstract
To characterize the genetic basis of facial features in Latin Americans, we performed a genome-wide association study (GWAS) of more than 6000 individuals using 59 landmark-based measurements from two-dimensional profile photographs and ~9,000,000 genotyped or imputed single-nucleotide polymorphisms. We detected significant association of 32 traits with at least 1 (and up to 6) of 32 different genomic regions, more than doubling the number of robustly associated face morphology loci reported until now (from 11 to 23). These GWAS hits are strongly enriched in regulatory sequences active specifically during craniofacial development. The associated region in 1p12 includes a tract of archaic adaptive introgression, with a Denisovan haplotype common in Native Americans affecting particularly lip thickness. Among the nine previously unidentified face morphology loci we identified is the VPS13B gene region, and we show that variants in this region also affect midfacial morphology in mice.
Email
INTRODUCTION
Because of its evolutionary, biomedical, and forensic significance, there is an increasing interest in the characterization of the genetic basis of human facial variation. Thus far, nine genome-wide association (GWA) studies (GWASs) have reported ~50 genetic loci associated with facial features in humans (1–12), although only about a dozen of these loci show significant association signals across independent studies, representing the most robust findings so far. Other than stochastic variation, the limited overlap of findings from independent GWASs could relate to various methodological and biological factors, including a different genetic architecture of facial variation across human populations.
We recently initiated a research program focused on the genetic basis of physical appearance in a sample of ~7000 individuals recruited in Latin America the Consortium for the Analysis of the Diversity and Evolution of Latin America (CANDELA cohort) (13). Our study sample is mostly of mixed European-Native American ancestry and shows extensive phenotypic variation and high genetic diversity (13, 14). This sample has high power for the genetic analysis of physical appearance in a considerably understudied population (4, 15–17). In a previous analysis of 14 facial features (characterized mainly using a discrete, categorical scoring approach), we reported genome-wide significant associations with single-nucleotide polymorphisms (SNPs) at six genomic loci (4). These loci harbor candidate genes known to be involved in mammalian craniofacial development/evolution, and four have now been replicated in other study samples, using a range of phenotyping approaches (10, 18).
From an evolutionary perspective, facial projection shows extensive variation across extinct and extant mammals, with aspects of brow-ridge, midface, and mandible projection being defining features of primate and hominid taxa (19). Such changes in facial projection have often been proposed to result from the action of selection, including various environmental adaptations, and possibly (particularly in hominids) social factors (20). In modern humans, the facial profile varies greatly between individuals and populations and has been shown to be highly informative in various perception domains, including gender and age attribution, individual recognition, and attractiveness (21).
Here, we present results stemming from GWA analyses of the facial profile in the CANDELA cohort. We evaluated 59 quantitative traits (i.e., landmark-based measurements) and found significant associations at 32 genomic regions (9 previously unidentified, 4 of which replicate in a European meta-analysis). We provide robust evidence of association for 23 loci that have been implicated by previous GWASs, more than doubling the number of well-validated face morphology loci. We find that associated SNPs are strongly enriched in enhancers active during the late organogenesis phase of human development, including many that are specifically active during craniofacial development. In the region of association in 1p12 (overlapping WARS2/TBX15), we find a Denisovan haplotype affecting face morphology, particularly lip thickness. Among the four previously unidentified face morphology loci that replicate in Europeans is VPS13B (associated with nose shape), and we demonstrate that variants of the homologous region in the mouse (Vps13b) also influence nasal morphology.
|
|
|
|
Post by Admin on Feb 7, 2021 22:17:08 GMT
RESULTS Study sample and phenotyping We examined individuals from the CANDELA study cohort, collected in five Latin American countries (13). Two operators placed 19 landmarks and 22 semi-landmarks (fig. S1), primarily along the midfacial contour, on right profile two-dimensional (2D) photographs of 6169 subjects (3408 women and 2761 men). After Procrustes superposition, we defined 59 measurements (distances, ratios, and angles) based on the landmarks/semi-landmarks. These measurements quantify aspects of the morphology of the upper, middle, and lower face, with similar measurements having been examined in a range of morphological studies of the human face, including genetic, medical, anthropological, and forensic applications (Fig. 1 and table S1). We found these quantitative traits to be reliably assessed (see Methods and table S2), approximately normally distributed and with extensive variation in the CANDELA sample. The individuals studied were genotyped on Illumina’s OmniExpress BeadChip. After quality control filters, we retained 671,038 SNPs for further analyses.  Fig. 1 Face profile features showing genome-wide significant association. Top: Drawings indicate the features for which the 32 traits listed below were measured in the CANDELA individuals (as defined in table S1). Bottom: Aggregate of the GWAS signals detected (across all traits). The chromosomal region (and nearest candidate gene) showing strongest association to a trait is indicated above each GWAS peak (bold type marks the previously unidentified face morphology regions identified here). Curved lines in the middle of the figure connect the previously unidentified face morphology region to their associated traits. Other than the high correlation (r > 0.8) seen for similar traits from the same anatomical structure (e.g., nose roundedness and lip thickness), most traits were found to have a low to moderate correlation (table S3). On the basis of genome-wide SNP data, average admixture proportions in the CANDELA individuals examined were estimated as 51% European, 45% Native American, and 4% sub-Saharan African. Most traits showed a low to moderate (but generally significant) correlation with age, body mass index (BMI), sex, and continental genetic ancestry (table S4). The strongest effects for age, BMI, and sex were seen, respectively, for measures of lip thickness (r ~ 0.33), traits affected by neck thickness (r ~ 0.49), and brow-ridge protrusion (r ~ 0.51). The strongest effect of Native American/European ancestry estimates [themselves strongly negatively correlated (13)] was for a measure of nasion position (r ~ 0.38). In addition, several measures of nose/chin protrusion and lip thickness had correlations ~0.20 with Native American/European ancestry. Subcontinental genetic ancestry (North Europe v. Iberia; Central Andes v. Southern South America) also correlated significantly with certain traits, particularly of the midface (table S4), consistent with previous observations (14). On the basis of a kinship matrix derived from the SNP data, we estimated narrow-sense trait heritability (h2) using LDAK5 (22). We found moderate (but mostly highly significant) heritability values for all traits, ranging from 0.20 to 0.61 (table S3), consistent with independent estimates (2, 18). The highest heritability (>0.60) was observed for measures of brow-ridge, nose, and lip protrusion. Genetic correlations among traits were approximately proportional to phenotypic correlations (except for traits with low h2), suggesting a similar role for genetic and environmental effects across traits (table S3). |
|
|
|
Post by Admin on Feb 8, 2021 6:22:37 GMT
GWA analyses We performed imputation using 1000 Genomes Phase 3 data (23), which allowed us to include up to 8,703,729 autosomal SNPs in the GWA analyses. For association testing, we used multiple linear regression, as implemented in PLINK (24), with an additive genetic model adjusting for age, sex, BMI, landmarking operator, and the first six principal components (PCs) computed from the SNP data. A total of 32 genomic regions (including 2684 SNPs) showed genome-wide significant association (P value < 5 × 10⁻⁸) with at least one trait (and up to six) (Figs. 1 and 2, Table 1, and table S5). These regions often also showed association with additional traits at a genome-wide suggestive significance threshold (P value < 10−5; Fig. 2). Conversely, of the 59 traits examined, 32 showed genome-wide significant association with at least one genomic region (and up to five regions), as well as genome-wide suggestive association with regions significantly associated with other traits (Fig. 2). Index SNPs (i.e., the one with the smallest P value in a region) at loci showing strongest association with a trait explain 0.4 to 0.9% of trait variance (median = 0.52%), in line with previous estimates of genetic effects in GWASs of facial variation (1, 15, 18).  Fig. 2 Thirty-two chromosomal regions associated with face profile traits. The 32 traits showing genome-wide significant association are listed at the top (Fig. 1 and table S1). For ease of visualization, association P values are represented by colored boxes as follows: red, genome-wide significant (<5 × 10⁻⁸); orange, genome-wide suggestive (<10−5) (P values are provided in table S5). Chromosomal regions in bold were previously unidentified (Fig. 1 and Table 1). Prior evidence: GWASa, associated with a similar face trait; GWASb, associated with a different facial trait; GWASc, associated with a facial development disorder [e.g., nonsyndromic cleft lip/palate (NSCL/P)]; HDD, human developmental defect reported (e.g., Mendelian disorder); MDD, model developmental defect (related phenotype involving a homologous region reported in animal models). Candidate genes where the index SNP is intragenic are underlined. Association P values in bold are genome-wide significant (P ≤ 5 × 10⁻⁸). Rep., European meta-analysis; AFR, sub-Saharan African; EUR, European (from 1000 genomes); NAM, Native American (14); CAN, CANDELA. “# SNPs” refers to the total number of genome-wide significant SNPs in that chromosomal region (P value ≤ 5 × 10⁻⁸). |
|
|
|
Post by Admin on Feb 8, 2021 22:11:48 GMT
To account for the number of traits and SNPs tested, we also calculated adjusted genome-wide significance thresholds following a global false discovery rate (FDR) procedure (25), at two overall significance levels (α = 1% and α = 5%). The commonly used threshold of 5 × 10⁻⁸ was slightly more stringent than the calculated FDR thresholds (see Methods); therefore, the associations identified as significant above remain significant after FDR adjustment for multiple testing.
Integration of face profile GWAS hits with the literature
For 24 of the 32 regions showing significant trait associations, there is substantial literature supporting an involvement in craniofacial morphology (summarized in Fig. 2 and table S5). This evidence is of five broad types, with certain loci being implicated by more than one line of evidence: (i) Some hits represent direct replications of previous GWAS findings. That is, the same (or a similar) facial trait has been associated with the same genomic region in previous studies. The most prominent example is nasion position (measured in various ways), which has been repeatedly associated with SNPs in the PAX3 region on 2q35 (1, 2, 10, 15, 18). Here, we replicate this finding in that we observe an association of this region with measures sensitive to nasion position (table S1). (ii) Some of the genome regions showing association have been detected in previous face morphology GWAS but for traits other than those associated here, suggesting an effect of these regions on various aspects of facial morphology. A prime example is the WARS2/TBX15 gene region in 1p12. We initially reported association of SNPs in this region with rolling of the helix (in the outer ear) (15); this region was subsequently associated with midface morphology and frontal bossing (10, 18), and in the current study, we find it associated with two measures of lip thickness (traits 35 and 36; Fig. 2 and table S1). (iii) Certain genomic regions identified here have been implicated by previous GWASs of craniofacial anomalies, particularly nonsyndromic cleft lip/palate (NSCL/P). For instance, SNPs in 8q24.21, downstream of MYC, have been strongly associated with NSCL/P (26), and here we find this region associated with philtrum length, consistent with genes in the region being involved in the development of this part of the midface. (iv) For some of the associated chromosomal regions highlighted here, there is evidence in the literature of their involvement in complex craniofacial abnormalities, including Mendelian disorders. For instance, the 8q22.2 region associated here with columella size (trait 27) has been involved in Cohen syndrome (OMIM #216550). Last, (v) some of the regions associated here have been previously implicated in craniofacial development in animal models. For instance, the Tabby mouse mutant (15) presents a range of craniofacial abnormalities caused by a duplication involving the Tbx15 gene in the 1p12 homologous region, and here we found this locus to be associated with lower lip thickness and lip thickness ratio. In Supplementary Notes, we provide comments on the 23 genomic regions detected here for which GWAS evidence of involvement in with nonpathological craniofacial variation has been reported previously.
Regulatory annotation enrichment analysis
Index SNPs at the GWAS hits identified here occur primarily in noncoding regions (table S5). We therefore evaluated the potential enrichment of SNPs in these regions within enhancers identified by chromatin 25-state annotations in 150 human tissues and cell types across embryonic, fetal, and adult time points (including multiple stages of human craniofacial development) (27). The index SNPs we identified are not necessarily causal and are often in strong linkage disequilibirium (LD) with other SNPs within a region (e.g., Figs. 3 and 4). We therefore identified proxy variants in LD with the index variant (r2 > 0.8) up to 1 Mb away. We then used the program GREGOR (28) to evaluate the enrichment of these SNPs (relative to an equal number of randomly selected SNPs) in regulatory annotations for each of the tissues and cell types mentioned above. We found a ~2-fold and ~4-fold enrichment of SNPs at face GWAS hits in all craniofacial enhancers and in craniofacial-specific enhancers, respectively (Bonferroni-corrected P values < 10−50) (fig. S2). Craniofacial-specific enhancers have not been detected in any other human tissues or stages of development and represent a small fraction of all genome annotations (i.e., ~8% of all craniofacial enhancers) (27). The observed enrichment of SNPs in the craniofacial-specific enhancers suggests that these regions play a regulatory role specific to facial development rather than being broadly involved in skeletal biology or embryonic development. Contrasting samples from early and late embryonic stages, we observe that samples from the later stages have the highest (~2-fold; Bonferroni-corrected P value < 10−20) enrichment (fig. S2). This supports previous analyses suggesting that gene expression regulation in late embryonic and early fetal development has the greatest impact on nonpathological adult face morphology (18, 27). Below, we comment on specific regulatory elements present in selected genome regions associated with face morphology.
|
|

