|
|
Post by Admin on Jul 26, 2023 4:29:54 GMT
Genetic history of East-Central Europe in the first millennium CE Abstract Background The appearance of Slavs in East-Central Europe has been the subject of an over 200-year debate driven by two conflicting hypotheses. The first assumes that Slavs came to the territory of contemporary Poland no earlier than the sixth century CE; the second postulates that they already inhabited this region in the Iron Age (IA). Testing either hypothesis is not trivial given that cremation of the dead was the prevailing custom in Central Europe from the late Bronze Age until the Middle Ages (MA). Results To address this problem, we determined the genetic makeup of representatives of the IA Wielbark- and MA Slav-associated cultures from the territory of present-day Poland. The study involved 474 individuals buried in 27 cemeteries. For 197 of them, genome-wide data were obtained. We found close genetic affinities between the IA Wielbark culture-associated individuals and contemporary to them and older northern European populations. Further, we observed that the IA individuals had genetic components which were indispensable to model the MA population. Conclusions The collected data suggest that the Wielbark culture-associated IA population was formed by immigrants from the north who entered the region of contemporary Poland most likely at the beginning of the first millennium CE and mixed with autochthons. The presented results are in line with the hypothesis that assumes the genetic continuation between IA and MA periods in East-Central Europe.  Introduction The decline of the Western Roman Empire under the pressure of barbarian tribes led to the emergence of new political and ethnic structures [1,2,3]. While the historical events and processes underlying the transformation from Antiquity to Christianity in the territories of the Roman Empire are relatively well recognized, the processes that occurred in parallel outside the Empire, especially in the regions that did not belong to the newly formed Christian community [4, 5], are poorly understood, including the appearance of Slavs in Central Europe [6,7,8,9,10,11,12,13,14,15,16,17]. Two conflicting hypotheses have been formulated [18, 19] to explain the appearance of Slavs. The allochthonous hypothesis states that Slavs migrated to this region of Europe no earlier than the sixth century CE [20, 21], whereas the autochthonous hypothesis posits that Slavs inhabited the region between the Oder and Vistula Rivers long before the Migration Period, traditionally dated to between 375 CE (invasion of Europe by the Huns) and 568 (conquest of Italy by the Longobards) [22,23,24]. Data collected thus far indicate that at the end of the Late Neolithic period, 3700–1800 BCE, the genetic structures of the populations occupying Central Europe were stabilized and remained to a large extent unchanged until the end of the Bronze Age, 1800–700 BCE [25, 26]. Three main genetic components constituted the genomes of people living in this region at that time. The first component was linked to the Mesolithic western hunter-gatherers (WHGs), who came to Europe approximately 14 thousand years ago [27]. The second was associated with the Neolithic Anatolian farmers (NAFs), who migrated to Europe 7–8 thousand years ago [28]. The third was related to the Yamnaya steppe herders (YAMs) [26], who spread in East-Central Europe 4–5 thousand years ago. How the genetic makeup of Central Europe was shaped during the Iron Age (IA), 700 BCE–650 CE, remains an open question, given the lack of representative biological material for archaeogenomic studies, due to the prevalence of cremation among populations living in this region from the Bronze Age until the Middle Ages (MA) [29, 30]. In the studies presented here, we took advantage of the fact that for a limited period of time, inhumation became the dominant funeral practice in the region of contemporary Poland within the population associated with the Wielbark culture [31,32,33]. This population existed in the basin of the Vistula River between the first and fifth centuries and then disappeared. Some theories link the emergence of the Wielbark culture with the migration of people commonly referred to as Goths [32]. Archaeological findings indicate that until the fifth century CE, they lived alongside people associated with the preceding Przeworsk culture, who still practised cremation [34, 35]. The final stage of coexistence of the Wielbark and Przeworsk cultures in the present territory of Poland overlapped with the Migration Period [4]. After its end, material cultures in this region became more homogenous, and archaeologists commonly link them with the Slavs [8, 36] who practised cremation of the dead [29] until the first Polish ruling dynasty was baptized (in 966 CE). Our recent analyses of mitochondrial genomes of IA groups associated with the Wielbark culture [37, 38] showed that from the matrilineal perspective, male individuals were genetically most similar to the IA southern Scandinavians, and their genetic history was different from that observed for females, who were associated most closely with the Middle Neolithic groups from Central Europe. This strongly suggests that peoples associated with the Wielbark culture were newcomers who mixed with the local population living in the territory of present-day Poland at the beginning of the CE. Thus, by identifying the genetic admixture present in the genomes of individuals from the Wielbark culture and comparing this admixture with the genomes of people living in the same region in MA, one can verify both the allochthonous and autochthonous hypotheses. Considering this information, we performed a whole-genome analysis of representatives of the IA Wielbark- and MA Slav-associated cultures. genomebiology.biomedcentral.com/articles/10.1186/s13059-023-03013-9 |
|
|
|
Post by Admin on Jul 26, 2023 21:12:42 GMT
Results Studied group description To reconstruct the biological history of the population living in East-Central Europe before and after the Migration Period, we analysed DNA samples taken from 474 individuals buried in 27 cemeteries in contemporary Poland [34, 39,40,41,42,43,44,45,46,47,48,49,50,51,52,53,54,55,56,57,58,59,60,61,62] and radiocarbon dated [63, 64] to the IA (second century BCE to fourth century CE, 5 Wielbark culture cemeteries) and the MA (tenth to thirteenth century CE, 22 Slav-associated cemeteries) (Fig. 1a, b and Additional file 1: Figs. S1-S13). DNA was isolated and whole-genome sequencing was performed as previously described [28, 38]. For all samples, DNA showed patterns of post-mortem damage (PMD) characteristic of ancient DNA (Additional file 2: Table S1). In most samples, we found low levels of both X-chromosome- and mtDNA-based contamination with other human DNA (avg. of 1.3% and 2.2%, respectively). High X-chromosome-based and mtDNA-based contamination was detected in 2 and 15 samples, respectively (Additional file 2: Table S1), which were excluded from further analysis. The study set thus included 457 samples divided into two groups, the IA group (134 samples) and the MA group (323 samples). Genome-wide data suitable for further analyses (at least 10.000 SNPs for an individual for the PCA, ADMIXTURE and qpADM analyses) were obtained for 197 individuals, 68 and 129 from the IA and MA groups, respectively. The sex of 334 individuals was determined [65], for 97 from the IA (45% male) and for 237 from the MA (58% male) groups. Mitochondrial DNA haplogroups (mt-hgs) were assigned for 343 individuals (105 and 238 for the IA and MA groups, respectively), and Y-chromosome haplogroups (Y-hgs) were determined for 155 individuals (45 and 110 for the IA and MA groups, respectively) (Additional file 2: Table S3-4). Fig. 1 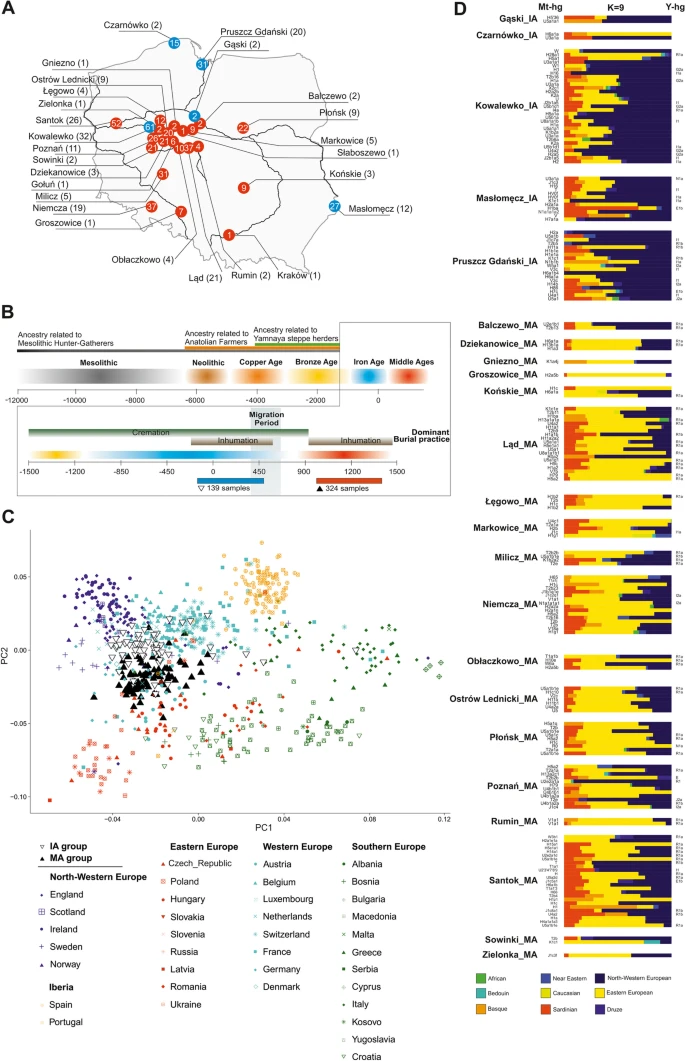 Spatiotemporal distribution of samples and their genetic affinities to present-day populations. a A map of present-day Poland showing the locations of skeletal remains sampled for this study. Colours denote the time periods of ancient individuals: red—Middle Ages (MA), blue—Iron Age (IA). Numbers inside coloured circles denote number of samples recovered from given site. Numbers in parentheses denote samples included in the analyses. b Representation of the context of the studied ancient individuals. c Ancient individuals projected onto the first two eigenvectors of a PCA based on contemporary European genetic diversity. d Ancestry proportions for ancient IA and MA individuals estimated using ADMIXTURE in unsupervised mode (K = 9) IA and MA group affinities To compare the genetic structures of the studied ancient populations and contemporary populations living in Europe, genome-wide data obtained for the individuals from the IA and MA groups were compared with the corresponding datasets describing the genetic variation of present-day West Eurasians (HO dataset) (Additional file 3: Fig. S14) and Europeans (POPRES dataset) (Fig. 1c). Principal component analysis (PCA, Fig. 1c) showed that both the IA and MA individuals overlapped with the present-day European populations. IA individuals were shifted towards peoples inhabiting Northwestern Europe, whereas MA individuals overlapped more with those living in Central and Eastern Europe. To learn more about the genetic structure of the IA and MA populations, we performed unsupervised ADMIXTURE analyses separately for each studied individual, using present-day west Eurasians and Africans as the reference dataset (HO dataset) (Fig. 1d). For every studied person, we assessed his or her relation to 9 putative ancestral populations (K = 9). We found that the major genetic component present in the DNA of IA individuals was the one maximized in the present-day Northwestern European genomes, whereas the DNA of MA individuals had, on average, the highest contribution of the genetic component maximized in the genomes of contemporary East-Central Europeans (Additional file 7: Fig. S18, Additional file 8: Fig. S19). The PCA and ADMIXTURE results were further supported by the Fst coefficients, which showed smaller genetic distances between present-day Northwestern Europeans and IA individuals than between the former and MA individuals (Additional file 4: Fig. S15). Our analysis also revealed that numerous individuals from the IA group had genetic structure similar to individuals from the MA group, characterized by a high proportion (> 20%) of the genetic component observed in the highest frequencies in present-day East-Central European populations. In six cases, this fraction was substantial (> 40%) (Fig. 1d). We did not observe a similar Eastern European genetic component in ancient Northwestern populations (from the IA or MA periods) and detected this component at very low levels in present-day Northern European populations (Additional files 5–8: Figs. S16-S19). A genetic make-up similar to that of the IA group members was found in a few samples from a sixth century Longobard migration era-associated population living in Szolad, Hungary (Hungary_Szolad_Migration_Period) [1] and in an individual associated with the fourth century CE Chernyakhov culture from Ukraine [66] (Additional file 5: Fig. S16, Additional file 9: Fig. S20A). To increase the resolution of the PCA, the genomic data obtained from the IA and MA individuals were compared with analogous data generated for the following 5 present-day East-Central European and Scandinavian populations: Eastern European, Northwestern European, Baltic, Finnish, and Norse (ancestry-restricted dataset) (Fig. 2a). The results also showed clear separation of populations from the IA and MA. The majority of IA individuals occupied the same PCA space as the Northwestern European and Norse populations, whereas the bulk of the MA individuals were placed together with the present-day East-Central Europeans, with some individuals located either close to the Norse populations or in the section of the PCA plot where Germanic and Slavic populations abutted each other. Fig. 2 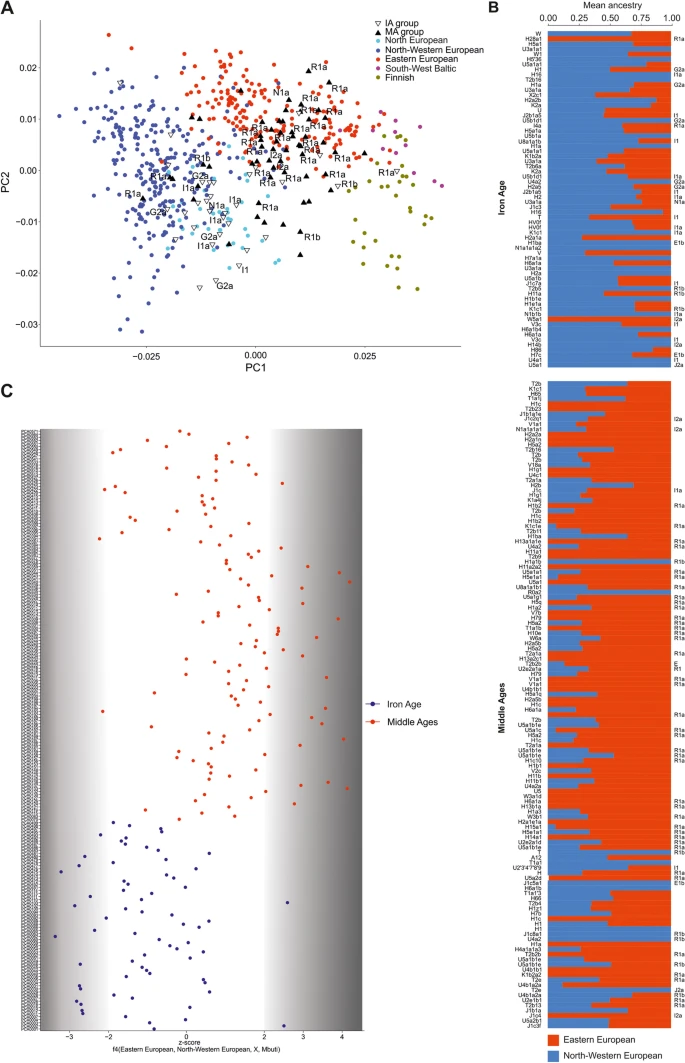 Population structure with respect to the present-day Central and Northern European genomes. a Ancient individuals projected onto the first two eigenvectors of the PCA restricted to the present-day Northwestern and East-Central Europeans. Northern European (Norway, Sweden), North-western European (England, Scotland, Orkney, Denmark), Eastern-European (Poland, Slovakia, Czech, Belarus, Ukraine), South-West Baltic (Lithuania, Latvia), Finnish (Finland). b f4 statistics reflecting the differential affinity of ancient individuals (X) to Northwestern and East-Central European reference populations, with the Mbuti as an outgroup. Colours denote the respective time periods of the ancient individuals: red—MA, blue—IA. c Northwestern (blue) and East-Central (red) European ancestry proportions estimated for ancient individuals using ADMIXTURE in supervised mode Given that the ancestry profiles of most of the studied individuals were similar to that observed for the present-day Northwestern or East-Central Europeans, we used these contemporary populations as references in a supervised ADMIXTURE analysis of each IA and MA individual (K = 2) (Fig. 2b). IA individuals had the highest proportion of Northwestern European ancestry, and MA individuals had the highest proportion of East-Central European ancestry. The PCA and ADMIXTURE results were further supported by the f4 statistics in the form of f4(East-Central Europeans, Northwestern Europeans, X, Mbuti), where X denotes the studied ancient individuals from the IA and MA groups (Fig. 2c) (Additional file 2: Table S6). This test showed that the individuals from the IA and MA groups shared statistically significantly more alleles with present-day Northwestern and East-Central Europeans, respectively. Although the exact phenotypes of the studied individuals are unknown, the estimated population-wide allele frequencies at loci associated with hair, skin, and eye colours [67] indicated that, on average, individuals in both groups were blond haired, light skinned, and blue eyed (Additional file 2: Table S2). We performed analogous PCA and supervised ADMIXTURE analyses to determine the relationships between the studied populations and other ancient Europeans (for details, see Additional file 9: Fig. S20). The results demonstrated that the genetic ancestries of the IA individuals and MA individuals were similar and typical for post-Bronze Age Europe—three main genetic components common to all Europeans (WHGs, NAFs, and YAMs) contributed equally to the genomes of individuals from both studied groups (Additional file 9: Fig. S20B). The above findings indicate that the observed genetic differences between IA and MA populations resulted from local demographic processes that most likely took place during the IA. |
|
|
|
Post by Admin on Jul 30, 2023 19:08:20 GMT
Genetic history of the IA group
The earlier analyses focusing on the IA and MA groups and their relations to present-day populations could not provide a clear answer which ancient populations contributed to the genetic makeup of the IA group. To explore this issue, we tried to identify within the IA group, the outliers that would represent the autochthonous IA population. Such individuals could be used to model the population that mixed with incomers associated with the Wielbark culture. Unfortunately, none of the methods we applied allowed us to identify the outliers.
To get deeper insight into the history of the IA group, we divided it into three subsets corresponding to the individual sites: IA_Pruszcz_Gdanski, IA_Kowalewko, IA_Maslomecz (Additional file 1: Supplementary Materials, Additional file 2: Table S1). We excluded from the analyses one site IA_Gaski. It was represented by two individuals described as associated with the Przeworsk culture. However, both were not buried in accordance with the customs of the Przeworsk culture and for both we obtained low-coverage sequencing data.
Based on the archaeological and historical findings, we expected the Wielbark culture-associated IA individuals to be the northern European IA immigrant population with the admixture of the autochthonous IA population.
To learn more on the origin of the immigrants, we calculated f4 statistics of the form f4(IA_X, MA, test population, Yoruba), where IA_X is IA_Pruszcz_Gdanski, IA_Kowalewko, or IA_Maslomecz, MA is the studied MA group, and test population is one of the 459 earlier identified ancient populations preceding or contemporary to the MA group (Additional file 1: Supplementary Materials, Additional file 2: Table S8). According to our expectations, IA_X, compared with MA, shared significantly more alleles with the ancient north (Denmark_IA, Norway_IA, Sweden_IA), north-western (England_Saxon, Ireland_Viking) Europe populations and with Hungary_Szolad_Migration_Period population (z-score > 3) (Additional file 2: Table S7).
We also used qpAdm to test if any ancient populations preceding or contemporary to the IA group could be a single ancestry source of the IA_X populations. In agreement with previous results, we found that for each IA_X population, valid one-way models (p-value > 0.05) can be generated with Denmark_IA, Sweden_LN or Scotland_Orkney_IAs as a source (Additional file 2: Table S8). Valid one-way models for at least two of the IA_X populations were also produced with Norway_IA, Sweden_BA or Scotland_Orkney_MBA. All three IA_X populations had also valid one-way models with Ukraine_Scythians as a source. This observation supports earlier reports that Ukraine_Scythians had close genetic affinities with the ancient northern populations (Sweden_IA, Sweden_LN, Denmark_LN) [68]. However, a model competition test (described in [69, 70]) showed that Denmark_IA is a better source of the ancestry for the IA_X populations than Ukraine_Scythians (Supplementary Information) which is consistent with archaeological data [32].
In addition, we applied qpAdm to test two-way quantitative models for the ancestral sources of each IA_X population. In accordance with the initial assumption, we considered models where the IA_X populations are mixtures of the north IA immigrants and the autochthonous IA population. As a source of the Norse ancestry, we used the earlier identified Denmark_IA or Norway_IA populations, and as a source of the local ancestry, we used one of the following populations: Poland_EBA_Unetice, Czech_EBA_Unetice, Lithuania_BA, Latvia_BA, or Estonia_IA (Additional file 2: Table S9). These populations are the closest approximations of the local IA genetic ancestry since no samples from the period from the BA until the IA are available for this region. We obtained multiple valid two-way models showing that IA_X populations are mixtures of Norse populations (~ 90–95%) and local proxies (5–10%). The models with Denmark_IA and Czech_EBA_Unetice were plausible for all three IA_X populations: IA_Pruszcz_Gdanski, IA_Kowalewko, and IA_Maslomecz (Additional file 2: Table S9). Several valid models were also produced for Denmark_IA + Poland_EBA_Unetice, Lithuania_BA, or Estonia_IA.
Both f4 and qpAdm models supported close genetic affinities between the IA_X populations and the contemporary to them and older northern European populations.
|
|
|
|
Post by Admin on Jul 31, 2023 18:54:21 GMT
Genetic continuation between the IA and MA
As we have already mentioned, the IA group was most likely composed of the northern European immigrant and the autochthonous IA population. The latter could contain the ancestors of the studied MA group (genetic continuation hypothesis) or could be genetically not related with the local medieval population (genetic discontinuation hypothesis). To verify these hypotheses of genetic continuity or discontinuity within the territory of contemporary Poland from the IA to medieval times, we examined whether and how the individual populations forming the MA group (MA_X populations; for details see Additional file 2: Table S11) are genetically shifted, compared with the studied IA group. To this end, we calculated the f4 statistics of the form f4(MA_X, IA, test population, Yoruba), where the test population was one of the earlier mentioned 459 ancient populations. The results showed that majority of the MA_X populations shared less alleles with ancient north-western populations (England_Saxons, Germany_Medieval, Norway_IA or Denmark_IA) than the IA group. At the same time, the MA_X populations shared more alleles with Latvia_BA, Estonia_BA and Lithuania_BA, compared with IA (Additional file 2: Table S13). This analysis revealed also that neither the MA nor the IA group was statistically significantly more shifted towards Poland EBA Unetice or Czech EBA Unetice, which are the best available proxies for the autochthonous IA population.
Further, we used qpAdm to test if the MA_X populations form valid (p > 0.05) one-way models with the IA_X populations. As shown in Additional file 2: Table S10, such models were formed by all MA_X populations with at least one IA_X population. All MA_X populations (12) formed valid one-way models with IA_Maslomecz, 10 with IA_Kowalewko and 9 with IA_Pruszcz_Gdanski. These analyses showed that the IA_X and MA_X populations were closely related and consequently supported a genetic continuation from the IA to MA.
Analogous one-way qpAdm modelling of the MA_X populations was also performed with 327 ancient populations preceding or contemporary to the MA group (Additional file 1: Supplementary Materials, Additional file 2: Table S10). It demonstrated that Denmark_IA, Norway_IA, England_Norfolk_Anglo Saxons, Ireland_Vikings, and Poland_Vikings also formed several valid models of the MA_X populations. These results indicated that the north European genetic components had strong presence in the studied MA group.
To further verify the hypothesis of genetic continuity, we used qpAdm to test two-way models of the MA_X population origin from the IA_X populations, Denmark_IA, or Norway_IA and the populations being proxies for the putative autochthons: Poland_EBA_Unetice, Czech_EBA_Unetice, or Lithuania_BA (Additional file 2: Table S12). These demonstrated that IA_Maslomecz + Poland_EBA_Unetice or Czech_EBA_Unetice resulted in valid models (p > 0.05) for all tested MA_X populations (8) with ~ 78–92% of the ancestry attributed to the IA_Maslomecz. IA_Kowalewko and IA_Pruszcz_Gdanski also produced valid two-way models but not for all MA_X populations (Additional file 2: Table S12). Most often IA_Kowalewko fitted with Poland_EBA_Unetice (3 out of 8) whereas IA_Pruszcz_Gdanski with Lithuania_BA (6 out of 8).
Two-way qpAdm models provided further evidence of a close genetic relationship between the IA and MA groups. This relatedness could be caused by the continuation of both the northern ancestry and the autochthon IA ancestry. However, none of the earlier analyses directly tested the autochthon IA continuation. If there was a genetic continuation of the autochthon IA population, then one should be able to model the IA_X populations as mixture of the MA X populations and Hungary_Szolad_Migration_Period who were shown to be incomers migrating from north through the region of contemporary Poland to south Europe. Indeed, we found that all IA_X populations could be modelled as mixtures of Hungary_Szolad_Migration_Period with the MA_X populations (Additional file 2: Table S14).
|
|
|
|
Post by Admin on Aug 4, 2023 17:50:50 GMT
Uniparental marker analysis To gain insight into the genetic structure of the studied populations from the perspective of male and female lineages, we determined uniparental haplogroups and compared their occurrence patterns in groups from both periods. The detected Y-hgs (155 in total) belonged to the following major branches of the Y-chromosome phylogenetic tree: E, F, G2a, I1, I2a, J2a, J2, N1a, R1a, and R1b (Fig. 3a, Additional file 2: Table S3). The Y-hg frequencies in the IA and MA groups were significantly different (Fisher’s exact test, p < 0.001). In the IA group, the Y-hg I1/I1a was the most frequent, whereas in the MA group, R1a predominated (Fig. 3c). The frequencies of both haplogroups underwent major changes between the two periods: the I1/I1a frequency decreased from 41.3% in the IA to 3.5% in the MA, whereas the R1a frequency increased from 8.6% in the IA to 57.5% in the MA. In the IA I1 individuals, the highest frequency was observed for the L118 mutation (41.3%), which is common in present-day Scandinavia and Finland. Among the four R1a individuals identified in the IA group, two were carriers of S198 and its downstream M458 mutations. In the MA group, 70.8% of R1a males bore the S198 mutation, and 44.6% bore the M458 mutation. The R1a-S198 lineage and its downstream clades, especially R1a-M458, are also common in present-day Eastern and Central European Slavic populations. In the MA group, we also observed high frequencies of R1a individuals carrying the S204 mutation (23.1%), which we did not detect in the IA group. The second most common Y-hg in the MA group was R1b with frequencies similar to that observed in the IA group. The R1b Y-hg was detected for individuals excavated from two elite-associated tenth century CE burials located in Poznan (at that time the city was one of the royal seats) and for one individual from Ląd, whose grave was dated to the thirteenth century and linked with the migration of peoples from Western Europe [71]. The Y-hg I1, most prevalent in the IA group, in the MA group was detected at the lower level (3.6%). Fig. 3 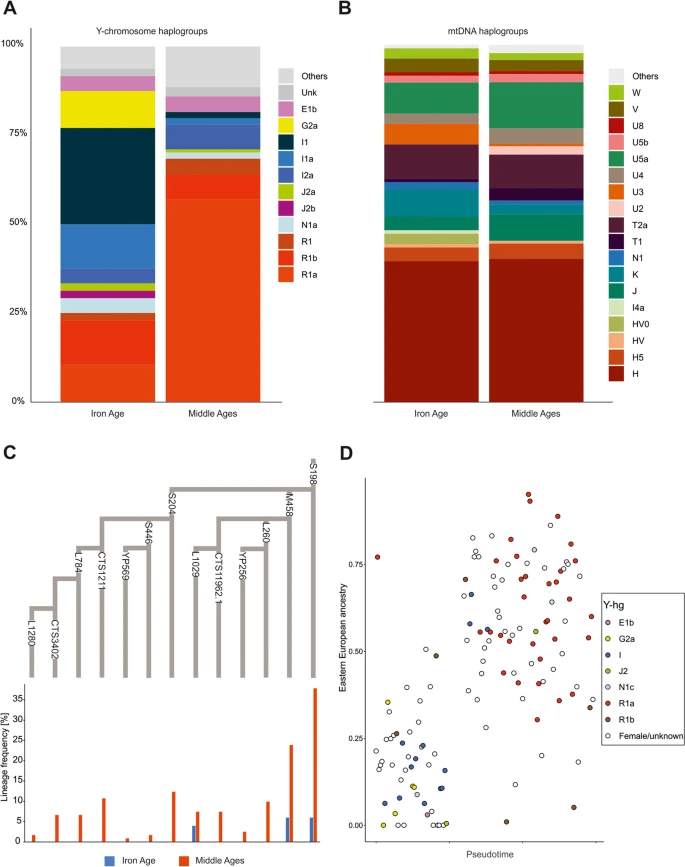 Genetic differentiation with respect to uniparental lineages. a Y-hg frequencies of the ancient individuals. b mtDNA frequencies of the ancient individuals. c A phylogenetic tree of the R1a-S198 lineage according to the ISOGG database v. 14.111, showing the frequencies of the respective SNP markers. Frequencies were based on the direct genotyping of the SNP markers, and the missing SNP markers were inferred using a phylogenetic context. d The proportion of East-Central European ancestry in ancient individuals. Colours indicate the Y-chromosome haplogroup for each male The genomes of IA individuals with the Y-hg R1a showed variable levels of the genetic component characteristic of contemporary East-Central Europeans (from 0 to 75%; Fig. 3d), whereas this component always exceeded 25% in the genomes of MA males with the Y-hg R1a. The genomes of IA individuals with the Y-hg I1 were similar to those observed in contemporary Northwestern Europeans, whereas the genomes of MA males with the Y-hg I1 were dominated by contemporary East-Central European components. In contrast to the results of the Y-hg frequency analysis, we did not observe corresponding changes in the composition of matrilineal markers (mt-hg) between the IA and MA groups. The frequency of the dominant matrilineal lineage, mt-hg H, remained nearly constant in populations from both the IA and MA periods (43.2% and 44.4%, respectively) (Fig. 3b, Additional file 2: Table S4). Nonetheless, minor changes in the mt-hg distribution were observed, with frequencies of the mt-hgs U3a and K2a being slightly decreased in the MA group compared to the IA group. In addition, HV0, X, and I4a found in IA individuals were absent in MA individuals. However, all these mt-hgs were rare in both studied groups. Some changes were also observed within the mt-hg H distribution. The H5a2 and H5e1a lineages were found only in the MA group, and in this group, the frequencies of several H1c lineages were increased in comparison to those in the IA group. The same phenomenon was noted for several other mt-hg lineages, e.g., J, T1, T2a, U2e, U4a2, and W3. The largest increase in mt-hg frequency in the MA group compared to the IA group was observed for the U5a1b1e lineage. Moreover, in the IA group, the frequency of the mt-hg H in males with the Y-hg I1/I1a lineage reached 21% and was lower than the overall mt-hg H prevalence in the remaining individuals (44%). In general, the observations concerning uniparental markers were consistent with the results of our whole-genome analysis and showed that the IA group was dominated by Y-hgs most frequently observed in ancient Northern European populations. Y-hgs dominating in present-day East-Central European populations were significantly less frequent but still appeared in this group. In contrast, the MA group was dominated by Y-hgs most frequent in present-day East-Central European populations. In addition, uniparental marker analyses indicated that the genetic changes induced in the region of contemporary Poland in the first centuries CE were based on male migration. |
|

