|
|
Post by Admin on Mar 16, 2023 17:55:20 GMT
Extended Data Fig. 1: MtDNA and Y-chromosome phylogenies. 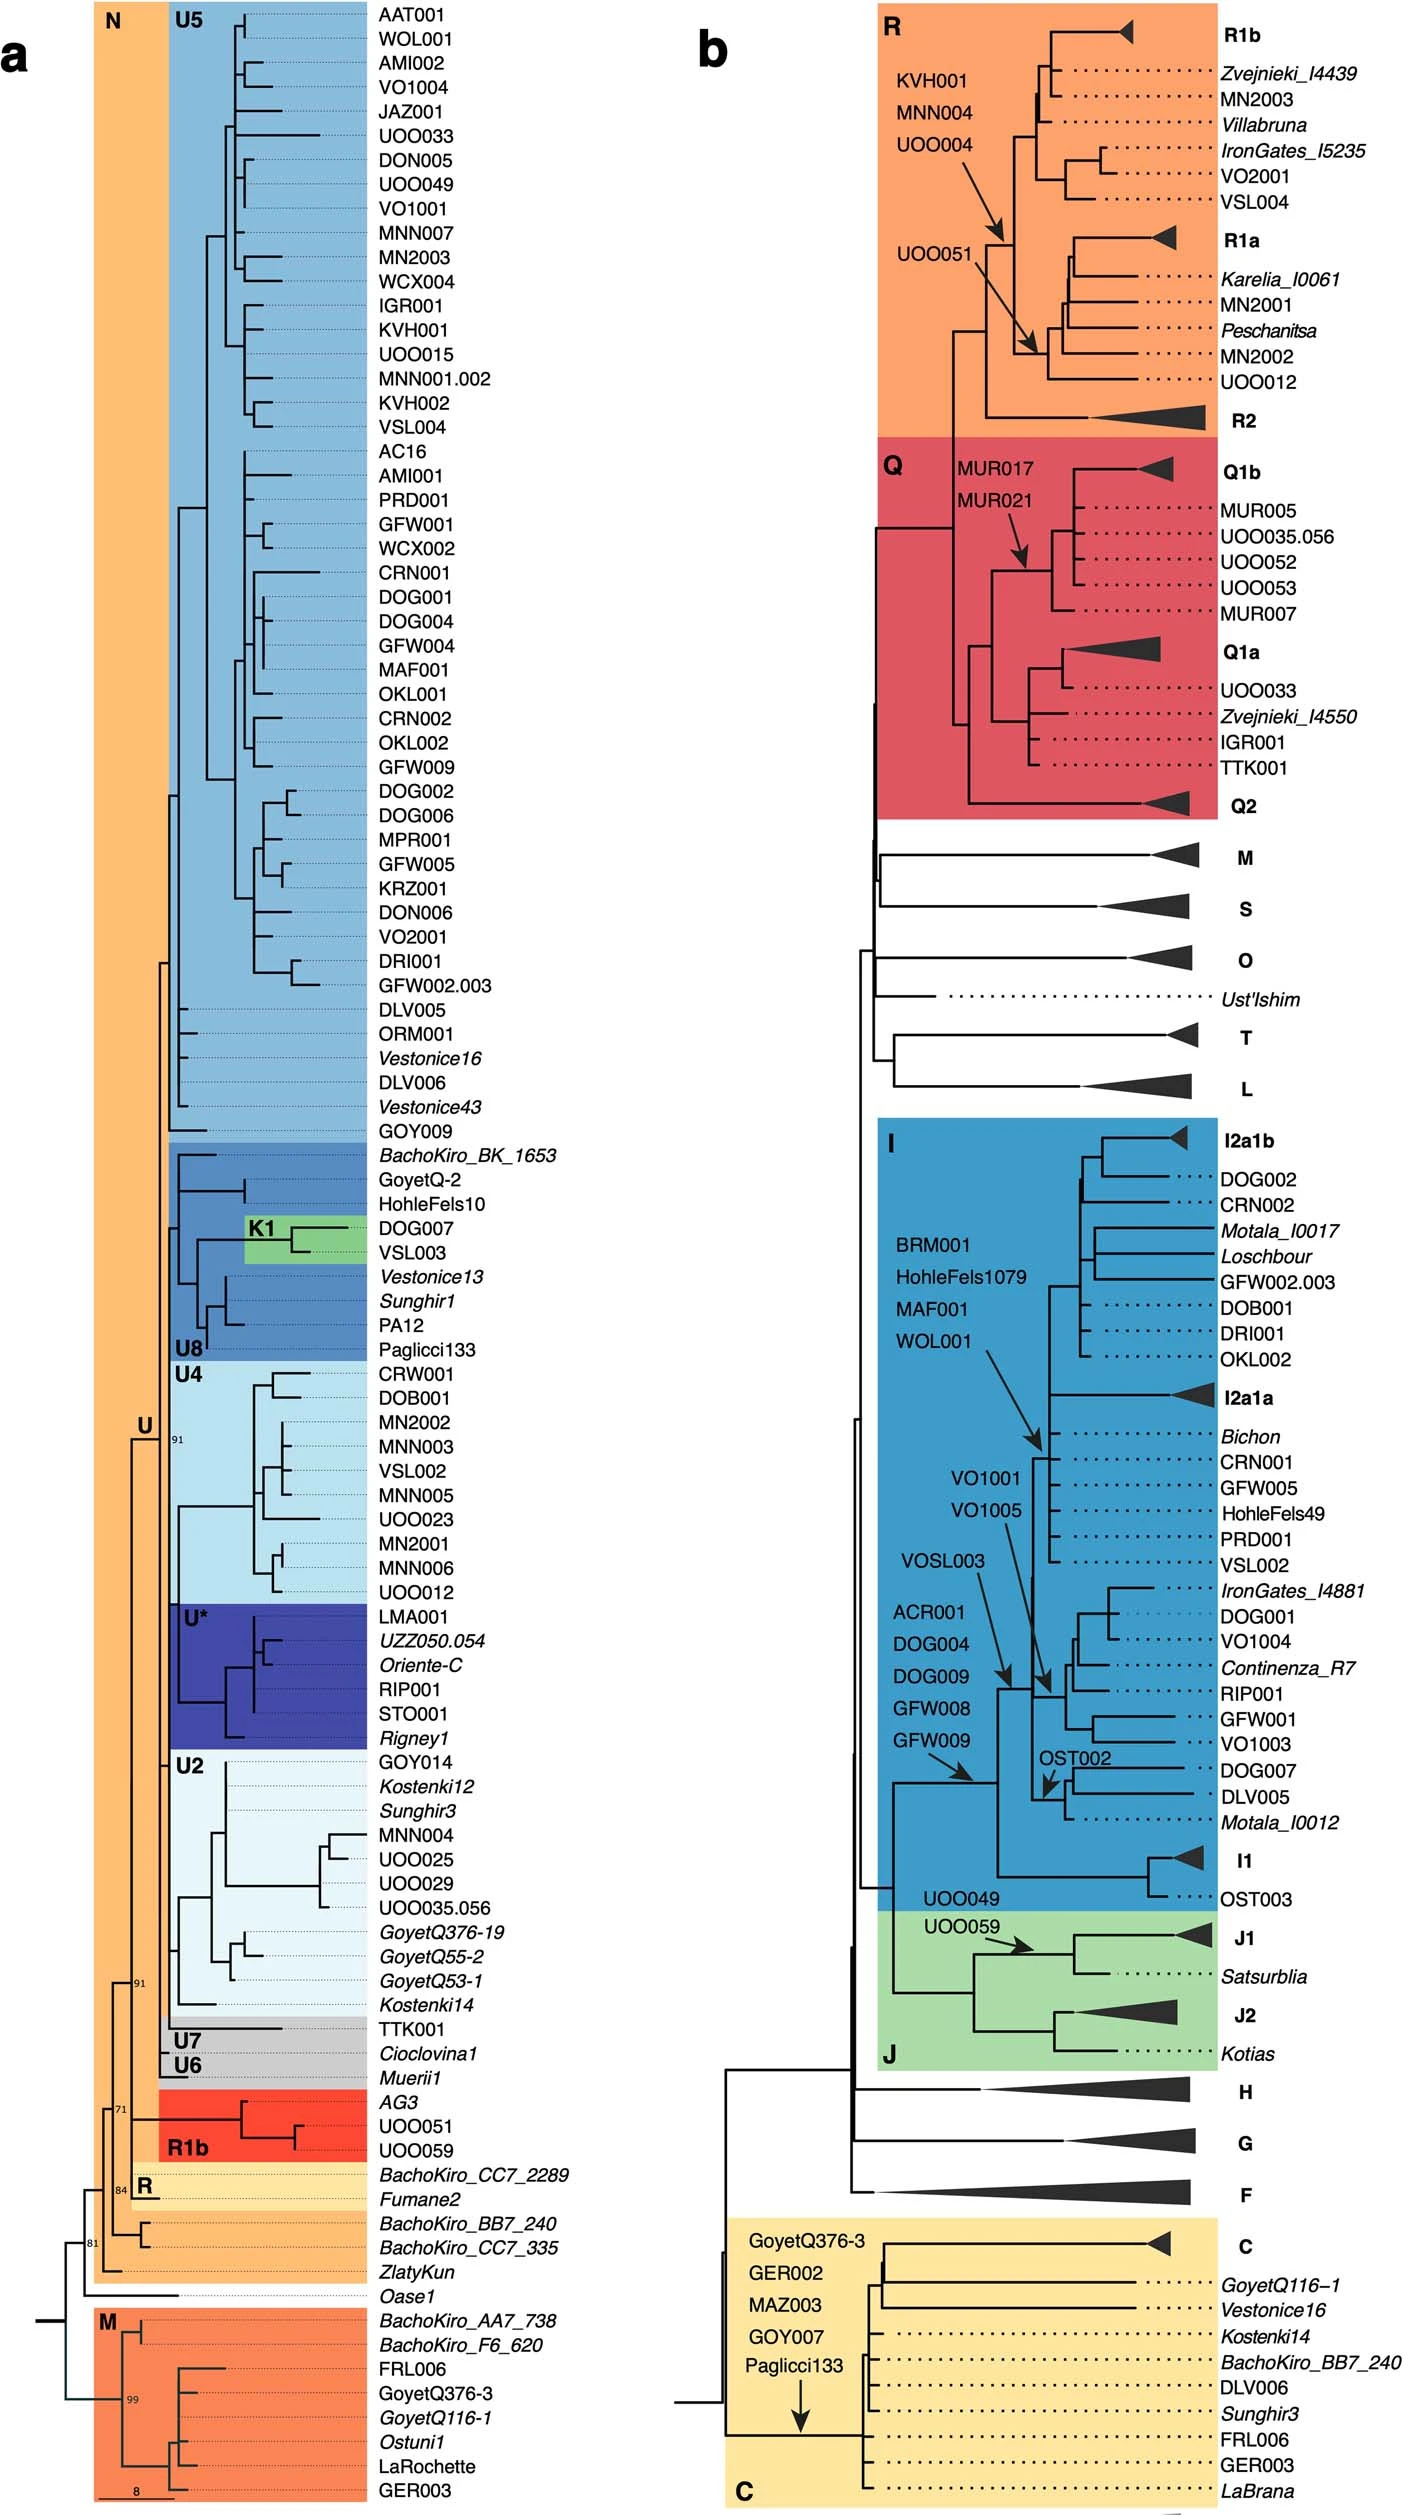 Bold letters refer to (a) mtDNA and (b) Ychr haplogroups, whose boxes are coloured according to the legend in Extended Data Fig. 2. The labels in italic denote previously published individuals without new data generated in this study. Extended Data Fig. 2: The distribution of mtDNA and Y-chromosome haplogroups among different hunter-gatherer groups. 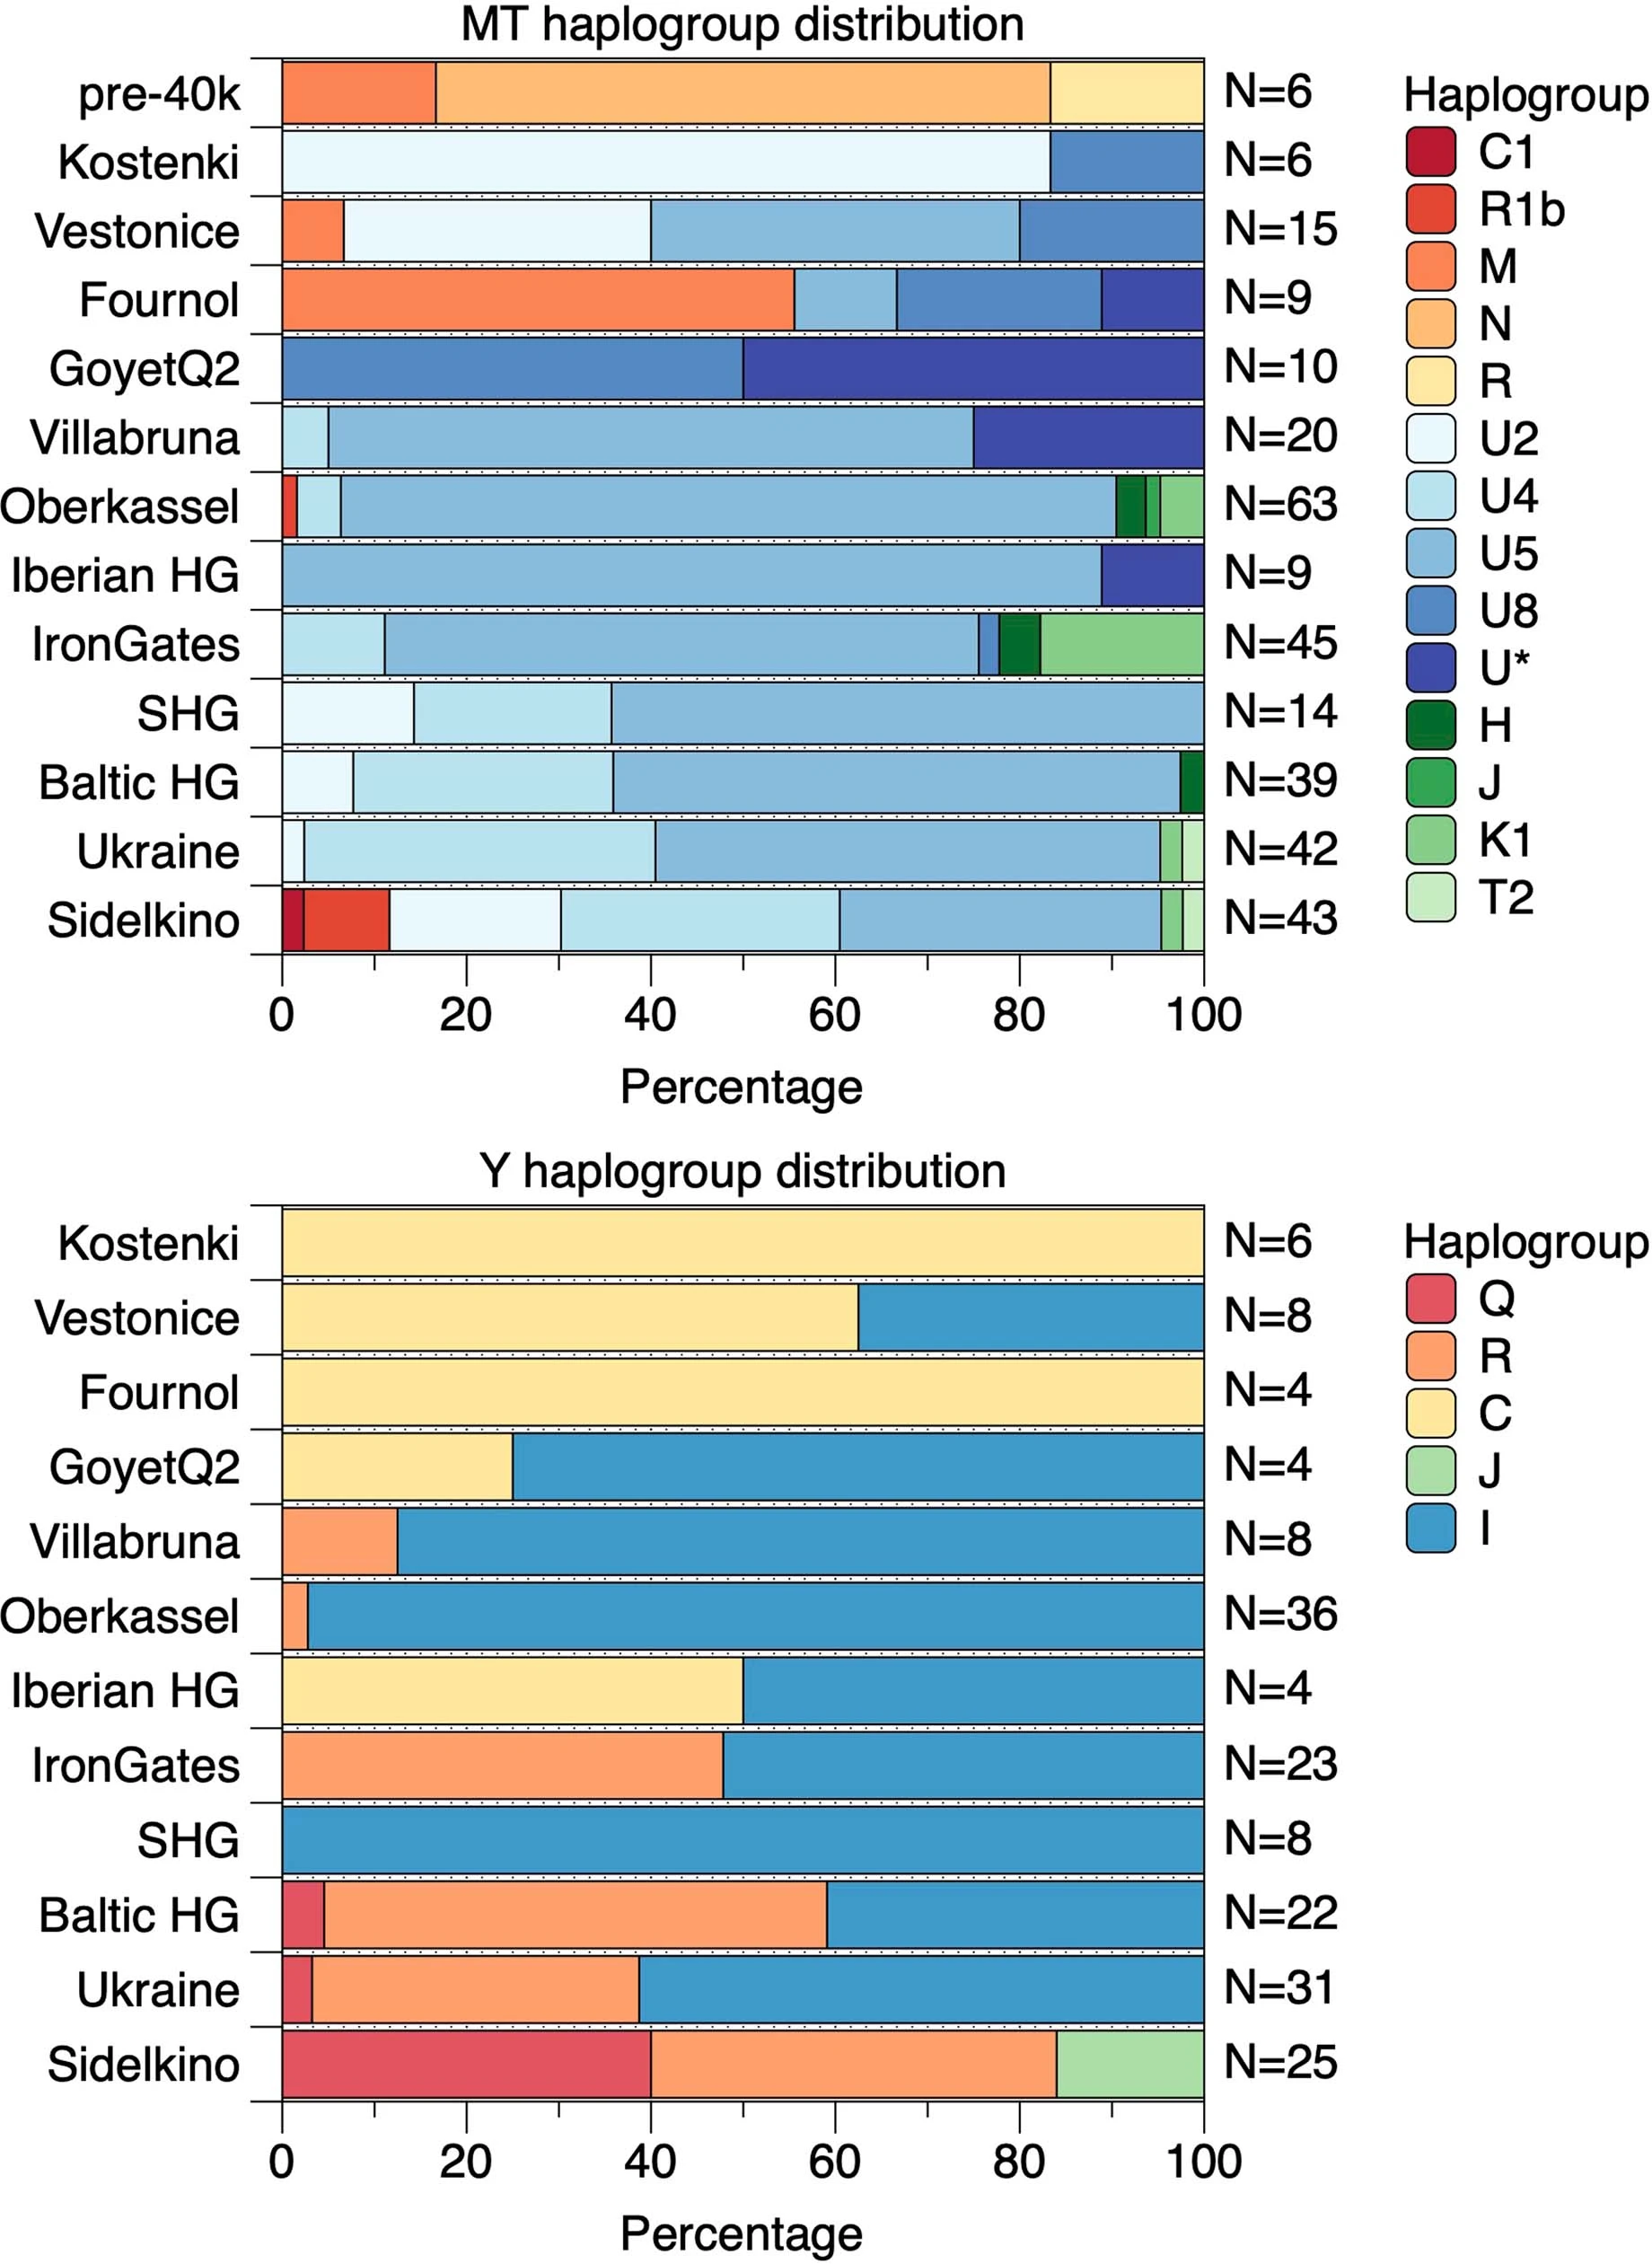 The length of each coloured bar represents the fraction of individuals carrying the corresponding haplogroup (legend on the right of each panel). The number of individuals in each group is written to the right of each bar. We only plotted groups with more than two individuals and, for this reason, individuals from the GoyetQ116-1 cluster are included here into the Fournol cluster. Extended Data Fig. 3: F4-statistics comparing the affinity of pre-LGM European hunter-gatherers to Goyet Q116-1 and Sunghir. 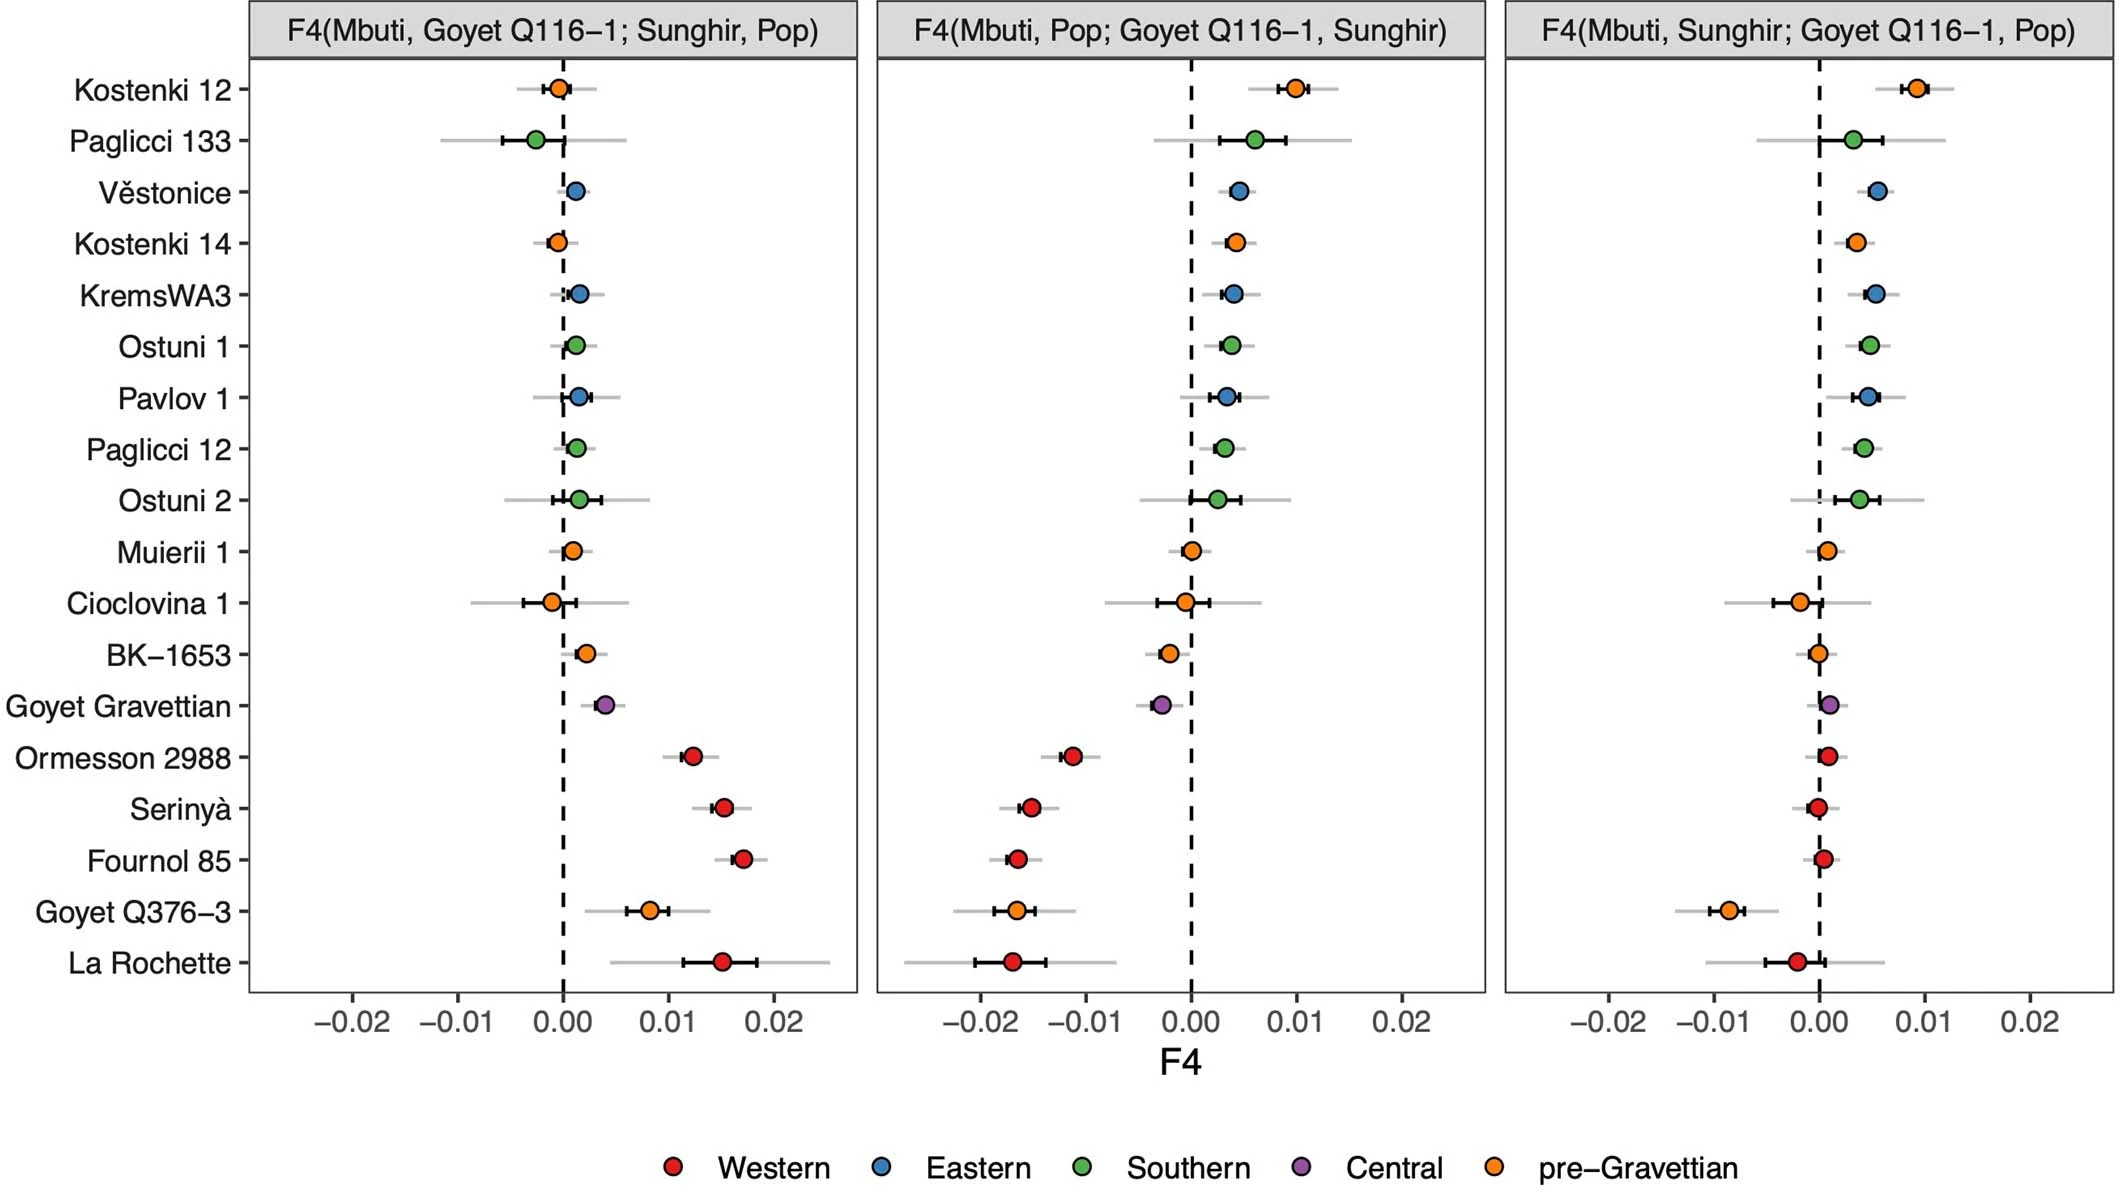 The colours correspond to the grouping of tested populations, dots refer to the f4-values and the dark and light error bars to 1*SE and 3*SE estimated from 5 cM block jackknife, respectively. This figure shows that the Gravettian-associated individuals from western Europe (Fournol cluster) are closely related to Goyet Q116-1 while the Gravettian-associated individuals from central-eastern and southern Europe (Věstonice cluster) are closely related to the Sunghir group, representative of the Kostenki cluster. Details are provided in Data S2.B. Extended Data Fig. 4: Admixture graph modelling of pre-34 ka hunter-gatherer lineages. 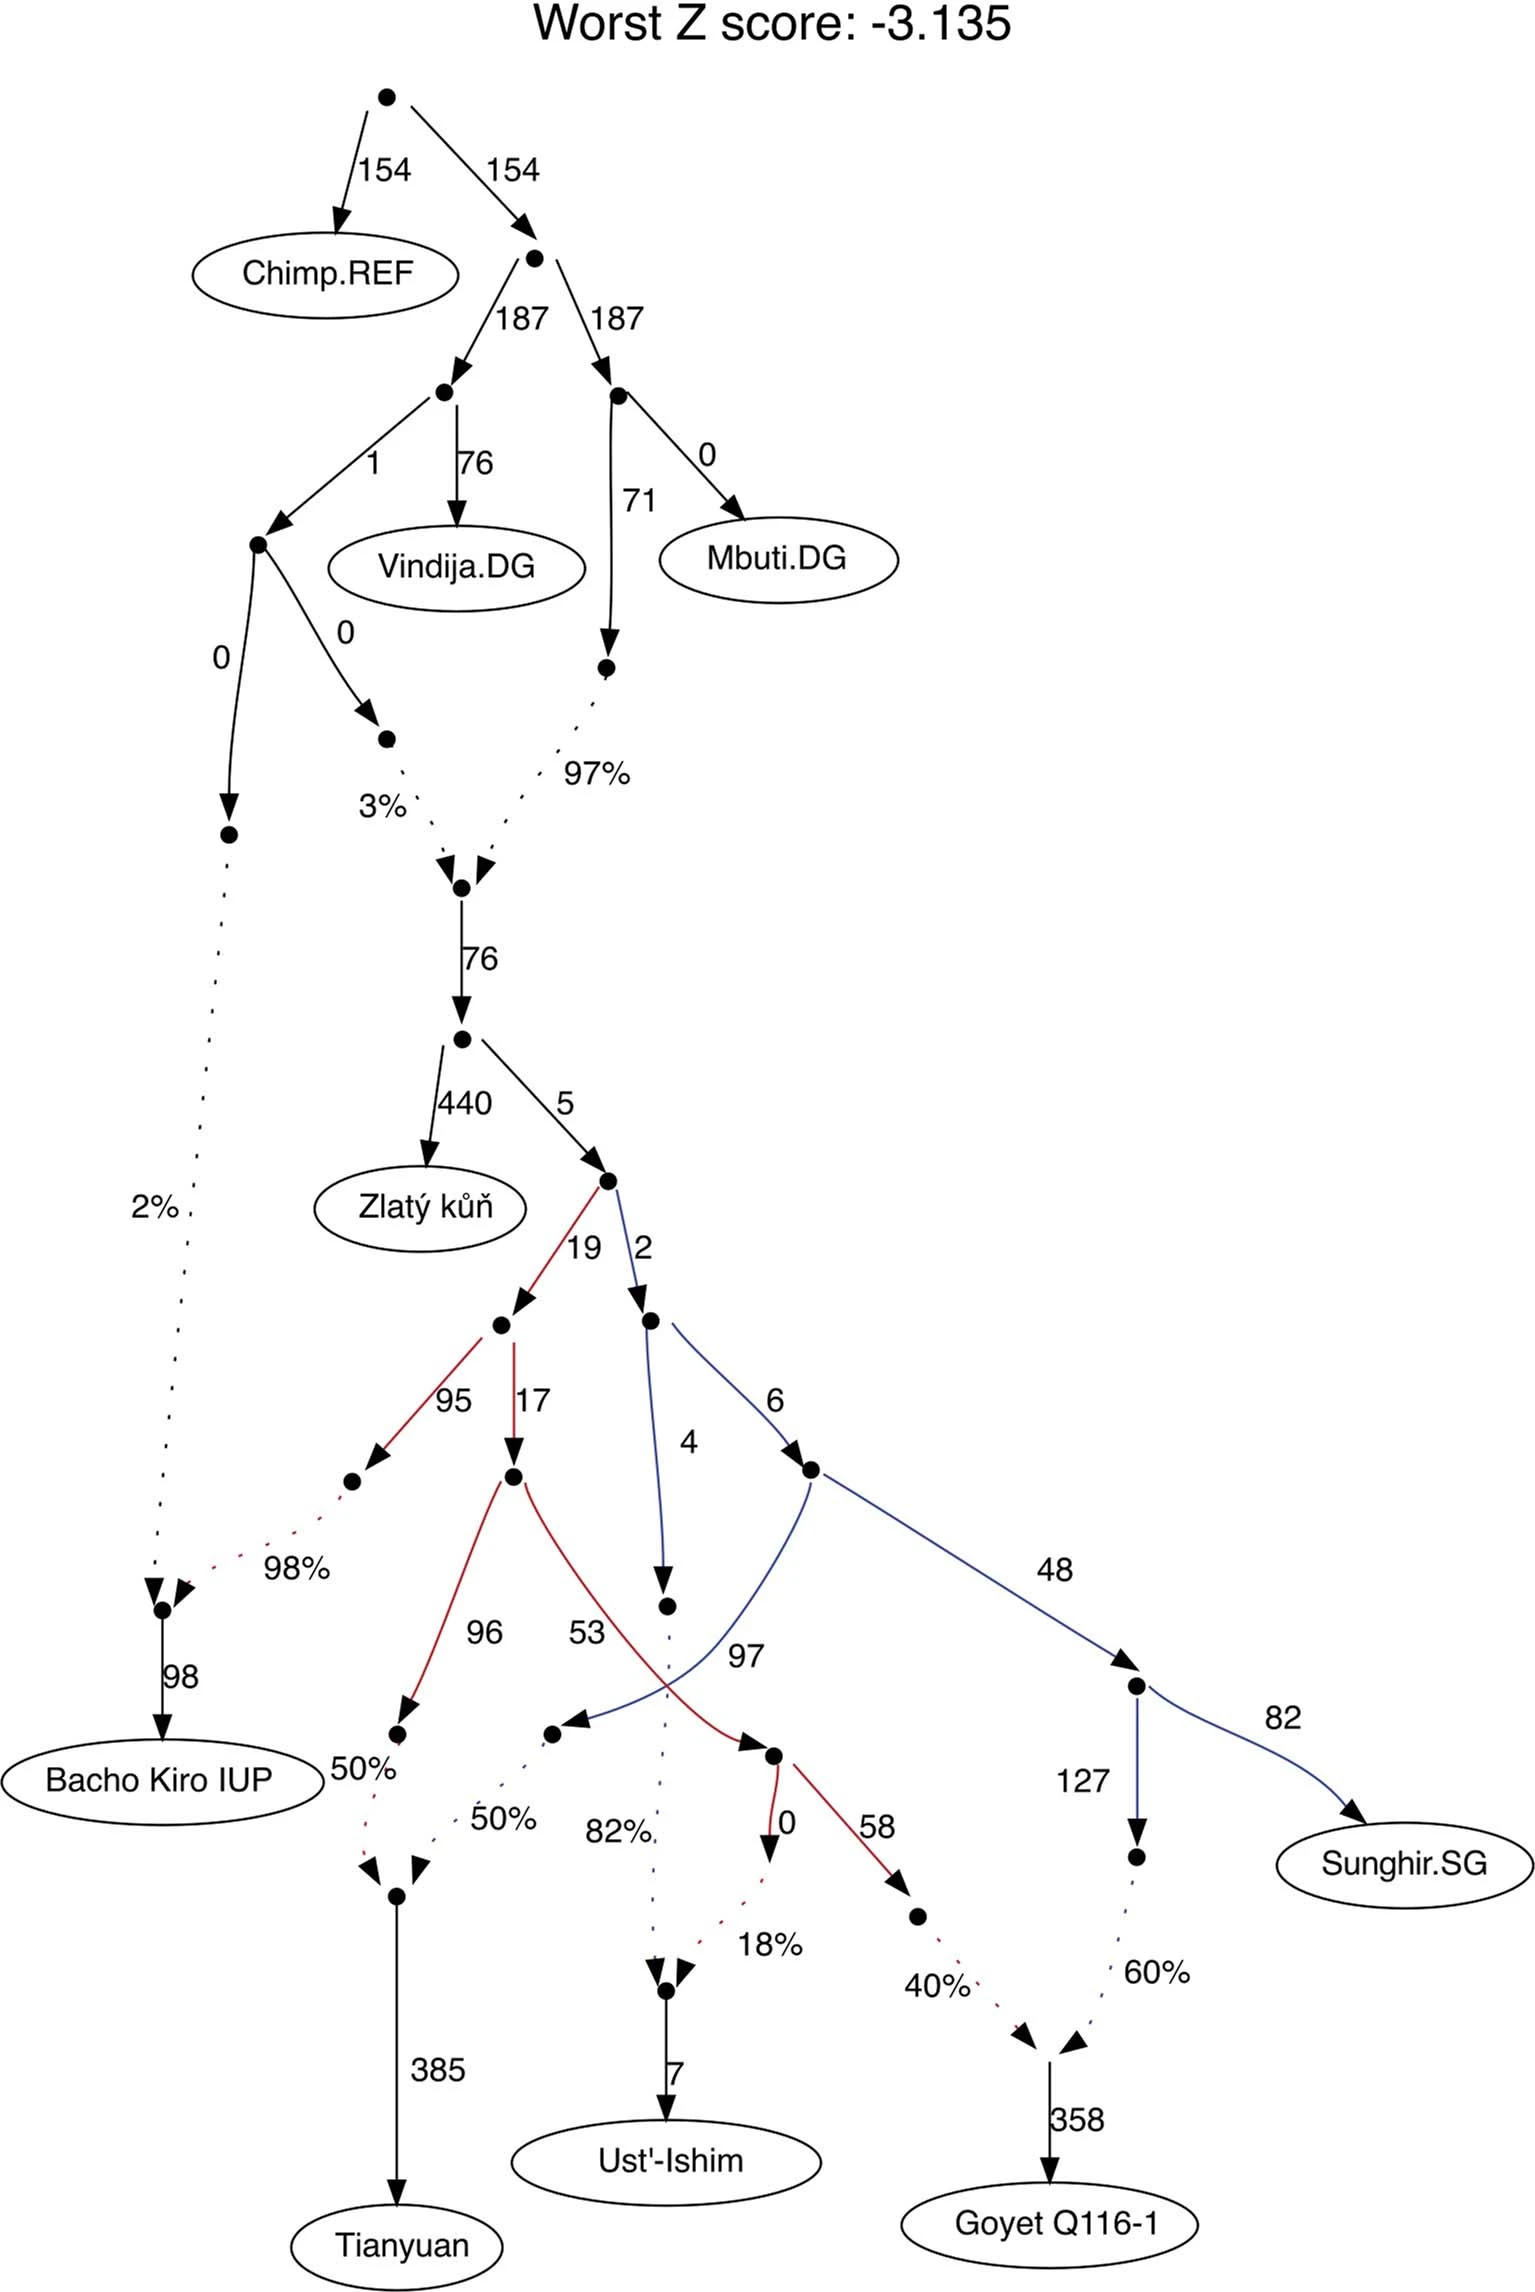 In this admixture graph, the lineage related to Zlatý kůň splits more basally than the Bacho Kiro IUP group, who contributes to Tianyuan, Ust’Ishim and Goyet Q116-1 (indicated with red lines), but not to the Sunghir group. |
|
|
|
Post by Admin on Mar 17, 2023 18:36:15 GMT
Extended Data Fig. 5: Summary of ROH segments detected in Eurasian hunter-gatherers. From: Palaeogenomics of Upper Palaeolithic to Neolithic European hunter-gatherers 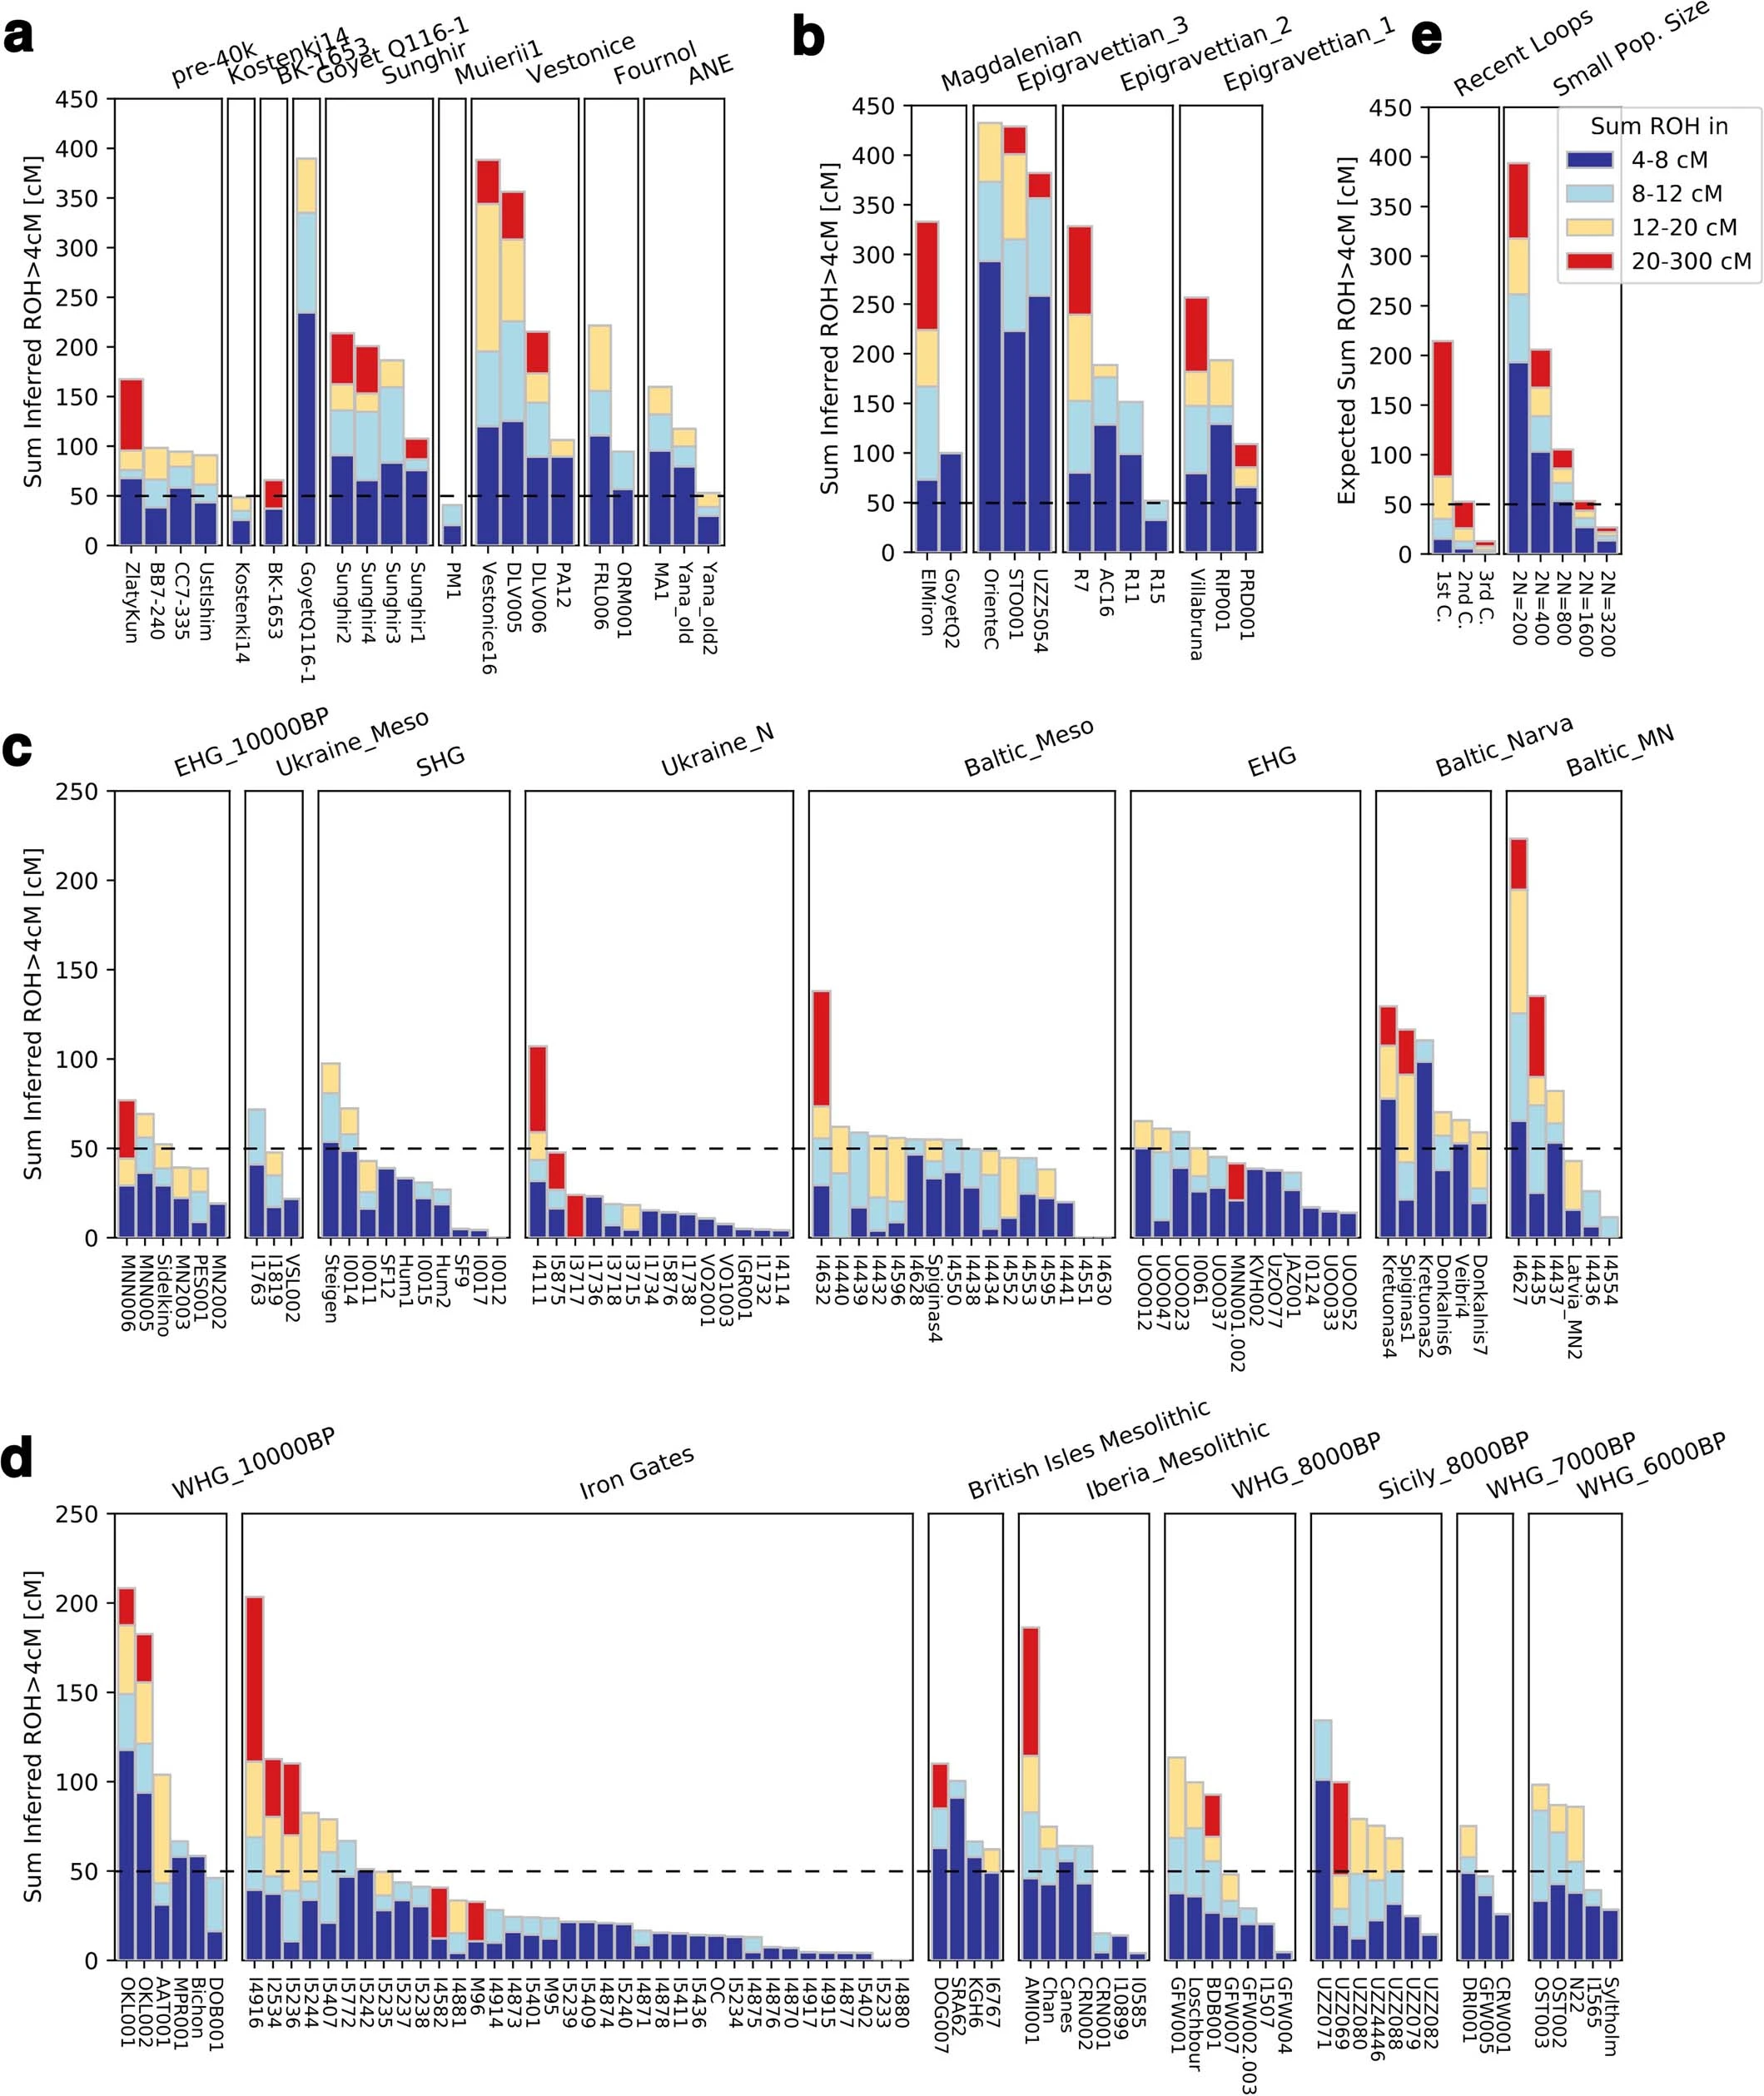 We visualize the total amount of ROH longer than 4 cM for (a) pre-LGM individuals, (b) Epigravettian- and Magdalenian-associated individuals, (c) individuals carrying high proportions of Sidelkino-related ancestry, and (d) individuals carrying high proportions of Oberkassel-related ancestry. Colour legend is shown in (e). Each bar represents one individual with the ROH grouped in four length categories (grouped by colour). The inferred pattern of short ROH (4–8 cM, visualized in blue) being common is in stark contrast to most later farmer populations, where the majority of individuals have no short ROH whatsoever (see101), and evidences small effective population sizes across West Eurasian hunter-gatherer groups. A dashed line of 50 cM total ROH is drawn in each panel to help comparison between panels with different y-axis scales. Details of the grouping and ROH segments are provided in Data S3.B. Extended Data Fig. 6: West Eurasian PCA showing the genetic positioning of post-LGM hunter-gatherers. From: Palaeogenomics of Upper Palaeolithic to Neolithic European hunter-gatherers 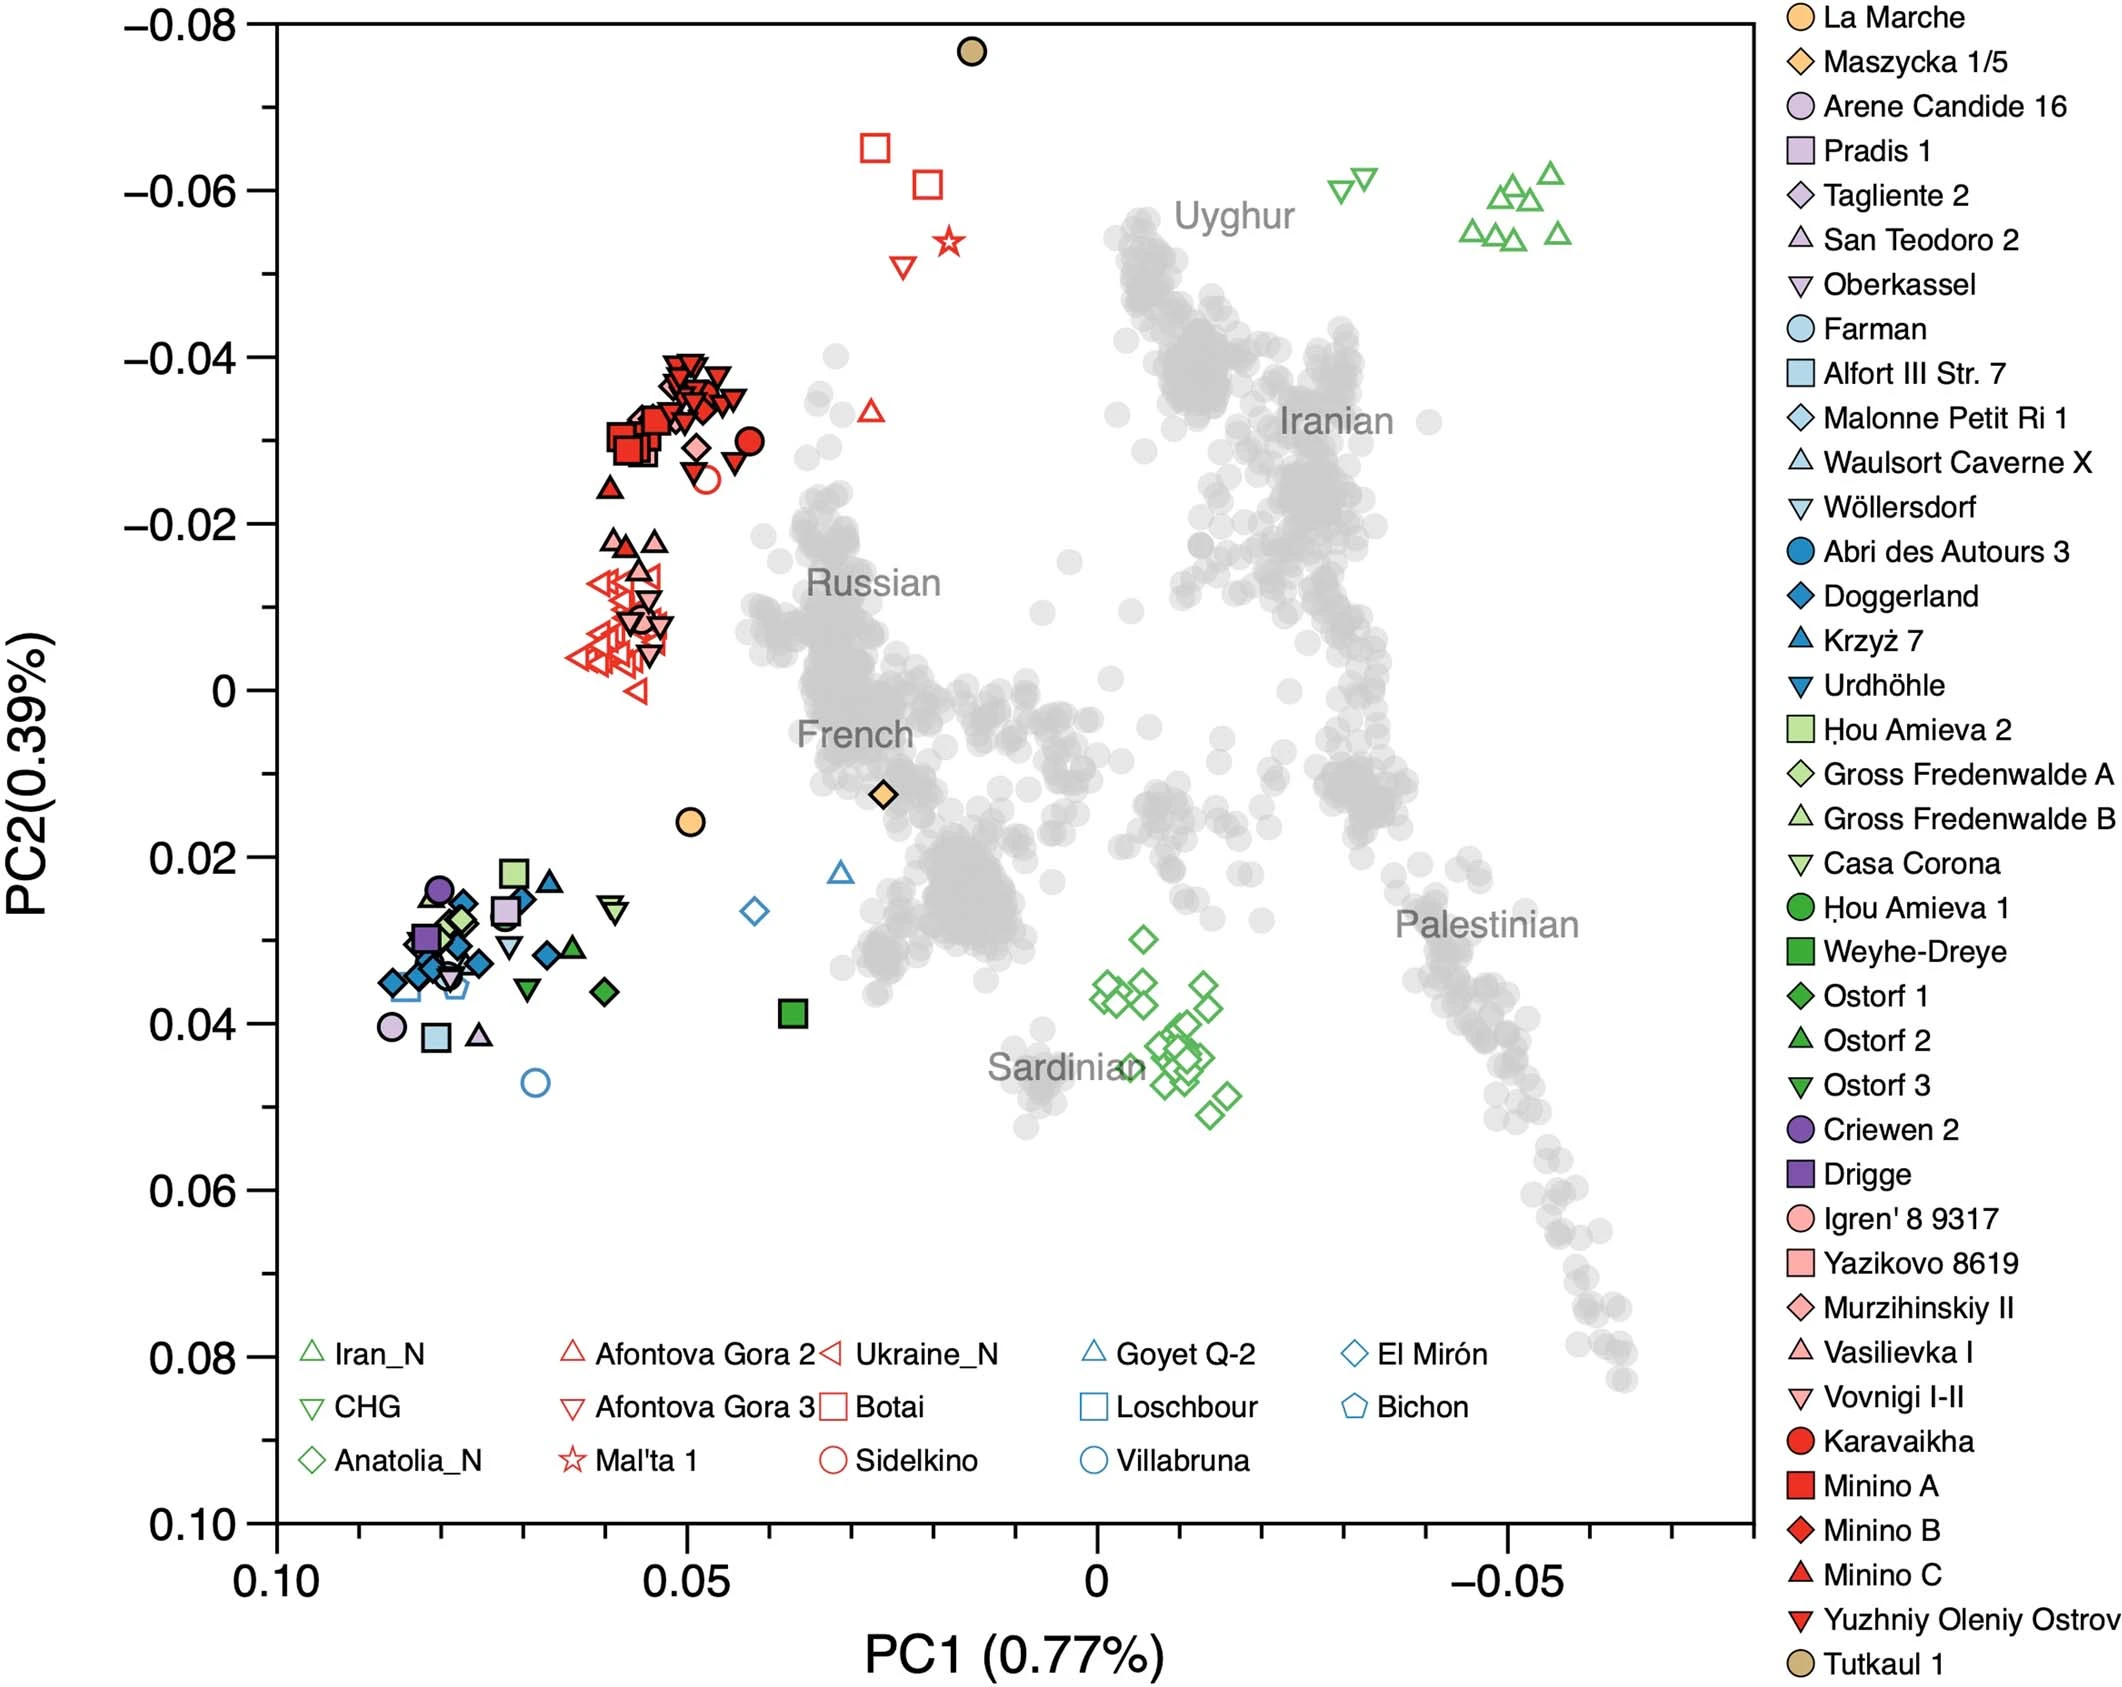 Present-day individuals (gray dots) genotyped on the Human Origins dataset are used to define the PCA variation onto which ancient genomes (coloured symbols) are projected. The newly reported individuals with over 15,000 SNPs on the Human Origins dataset are shown in black-outlined and filled symbols, as illustrated in the legend on the right, while representative ancient genomes are shown in outlined symbols, as illustrated in the legend at the bottom of the PCA. Extended Data Fig. 7 Admixture dates between Oberkassel/Villabruna and ANE ancestries in the oldest individuals from the Sidelkino cluster. 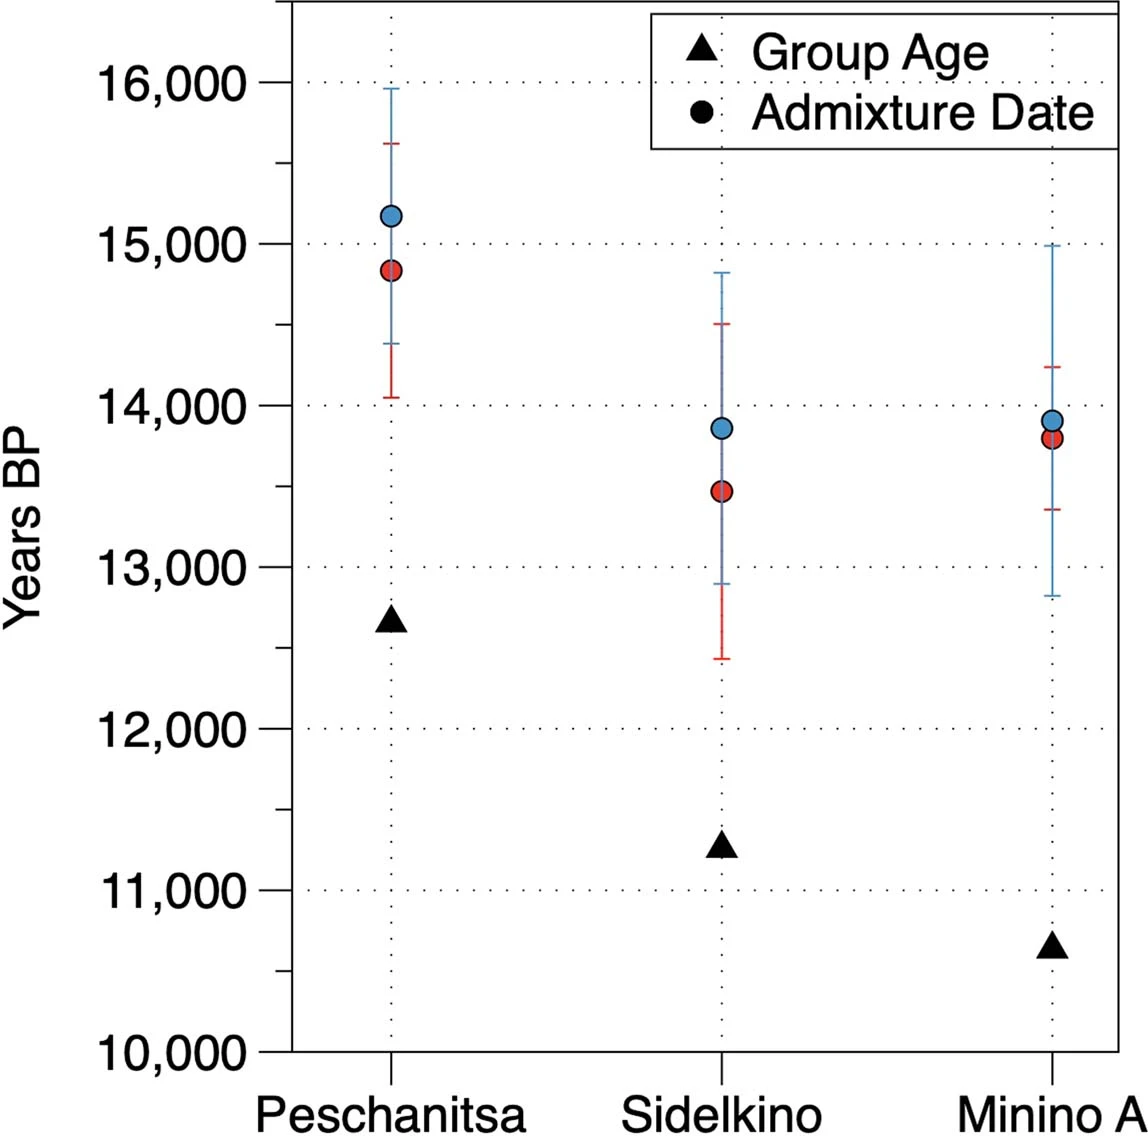 The triangles show the average calibrated dates of the tested groups and the dots show the estimated admixture dates with the software DATES105 using Oberkassel (red dots) or Villabruna (blue dots) clusters as one source and ANE-related individuals as the other source population. The generation time is set to 29 years and the error bars show the SE of the admixture date estimated from jackknife resampling (n = 22 autosomal chromosomes). Additional details are provided in Supplementary Information, section 11 and Supplementary Table 3. Extended Data Fig. 8 Changes of Sidelkino and Oberkassel ancestry proportions in post-14 ka hunter-gatherers. 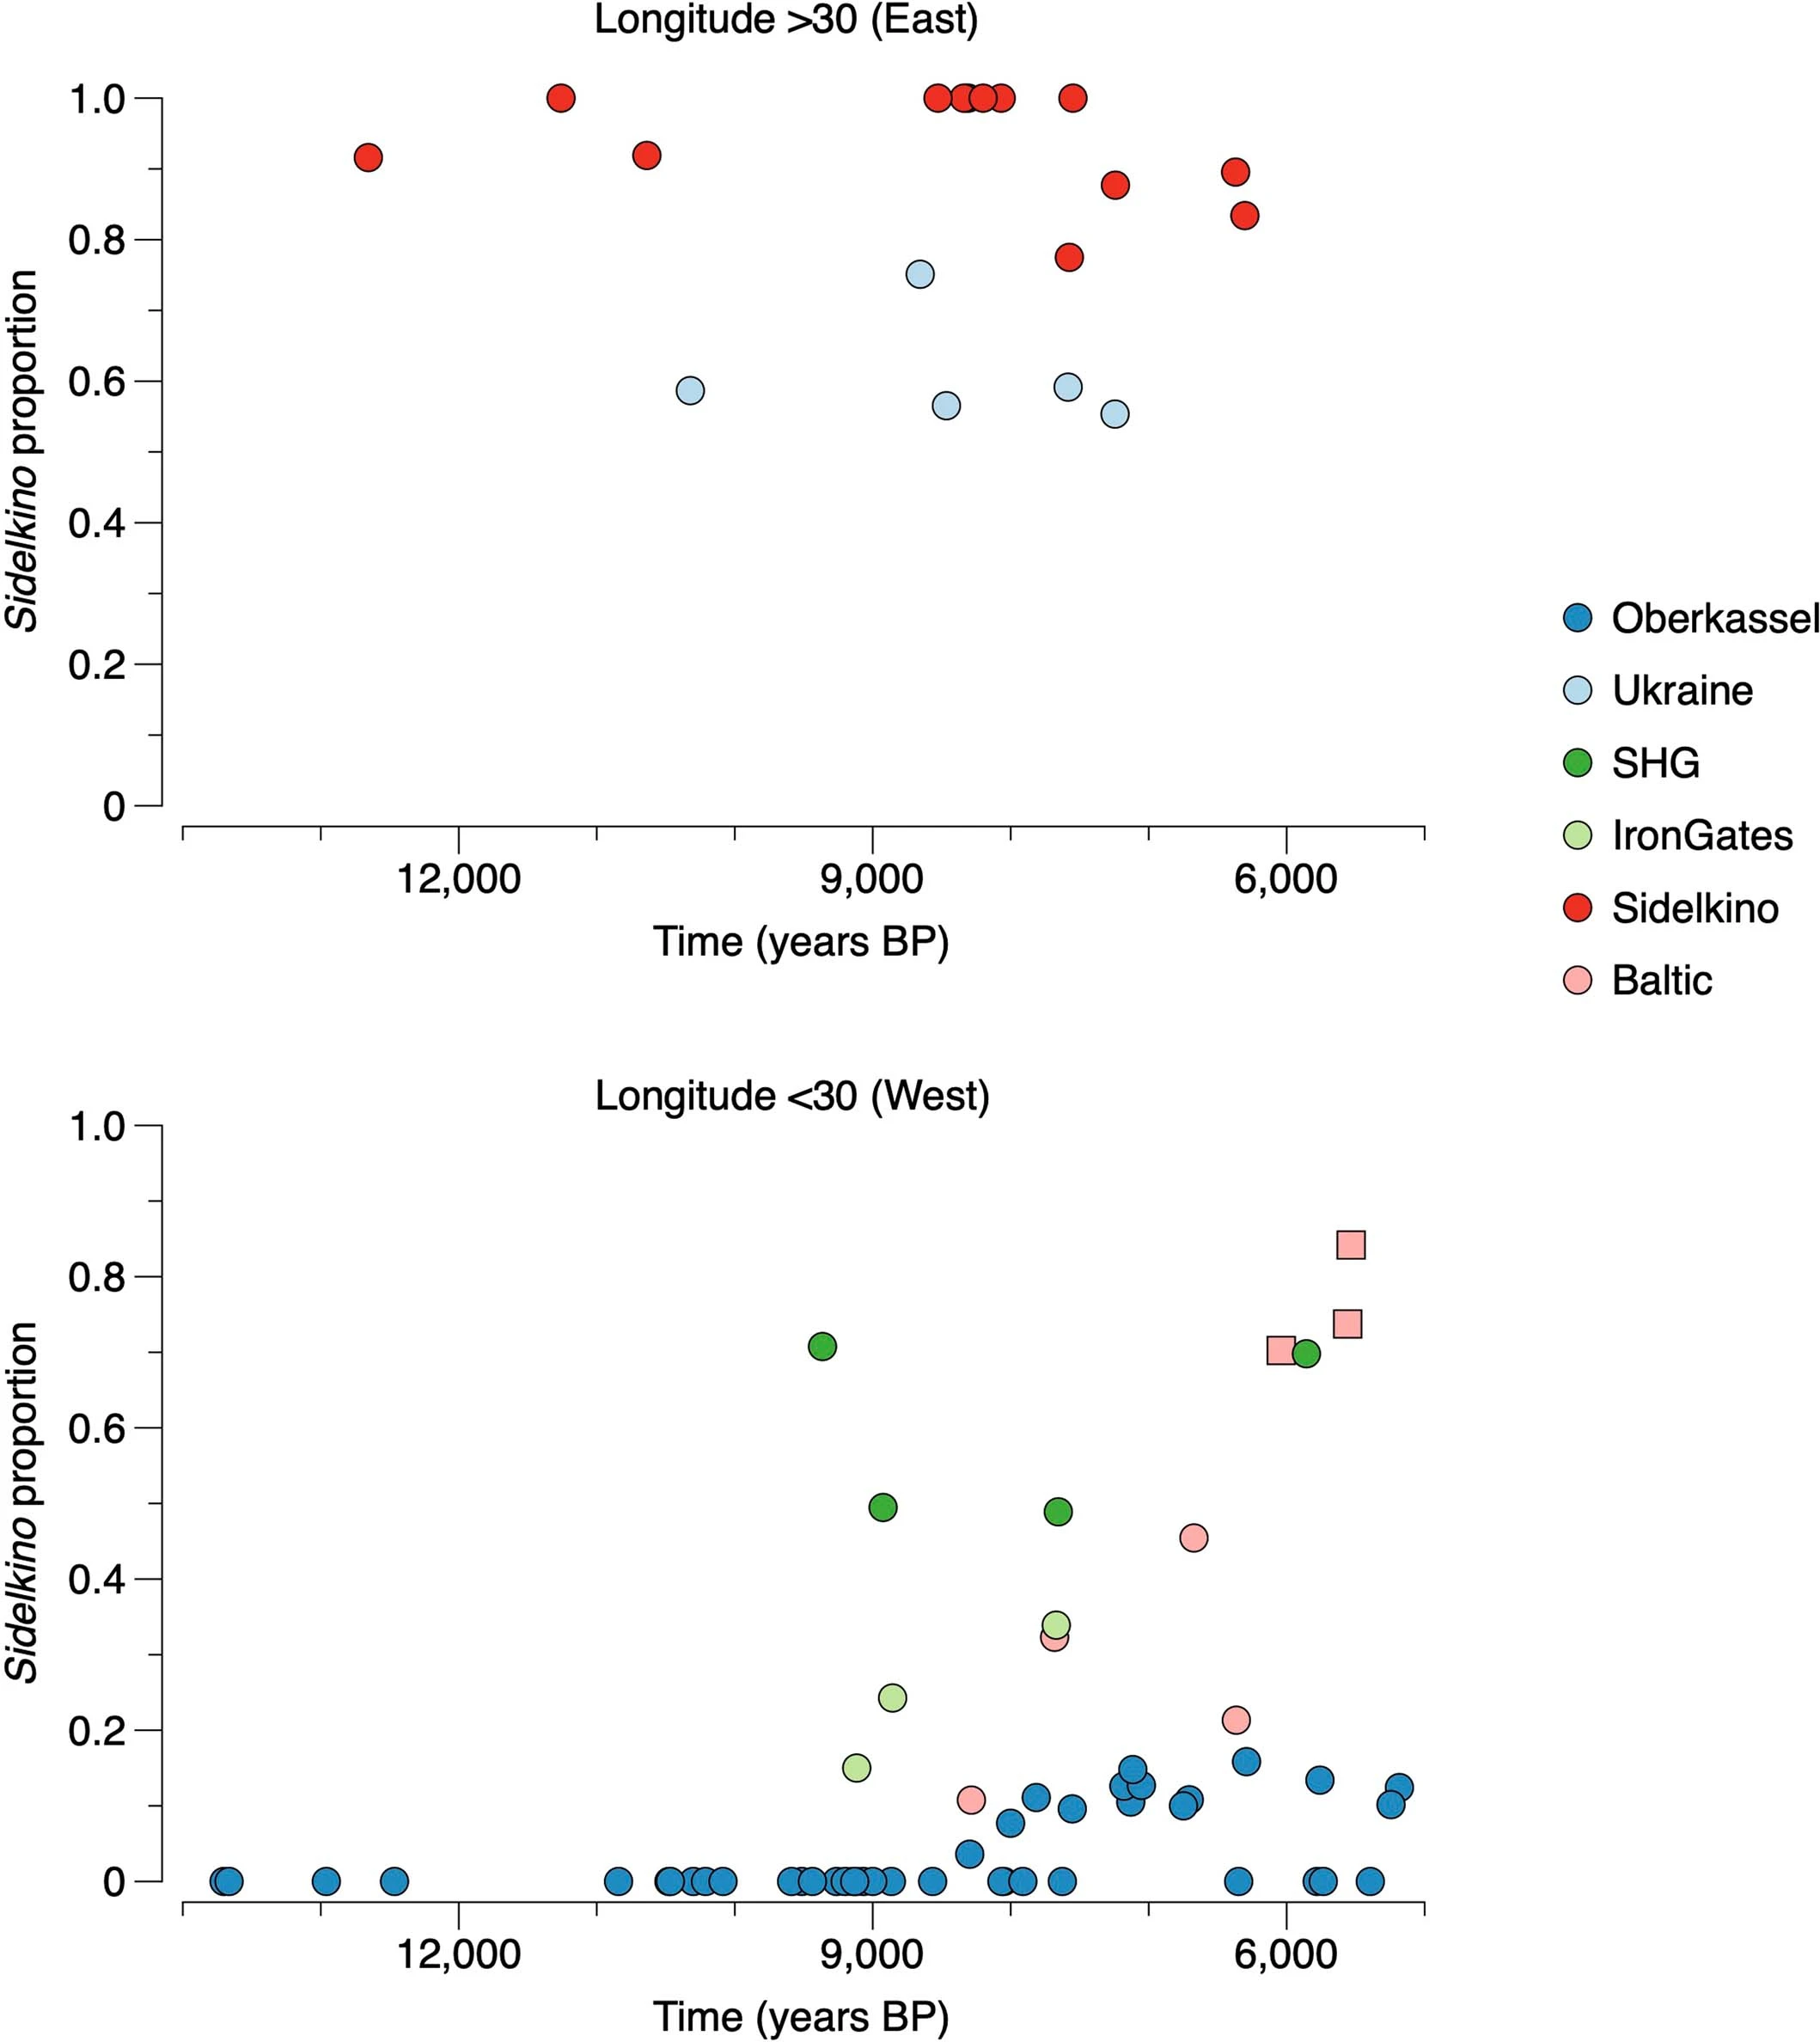 The bivariate plots show the expansion of Oberkassel and Sidelkino ancestries through time in two European areas (longitude below and above 30 degrees). The x-axis shows the average age of each tested individual/group and the y-axis shows the proportion of Sidelkino ancestry, relative to the total hunter-gatherer ancestry (Oberkassel + Sidelkino) in each group. The three squares highlight Baltic HG groups associated with the Comb Ceramic Culture (CCC) that show a marked increase in Sidelkino-related ancestry compared to older Baltic HG groups. Extended Data Fig. 9 Graphical summary depicting the main genetic transformations in post-40 ka hunter-gatherers from Europe. 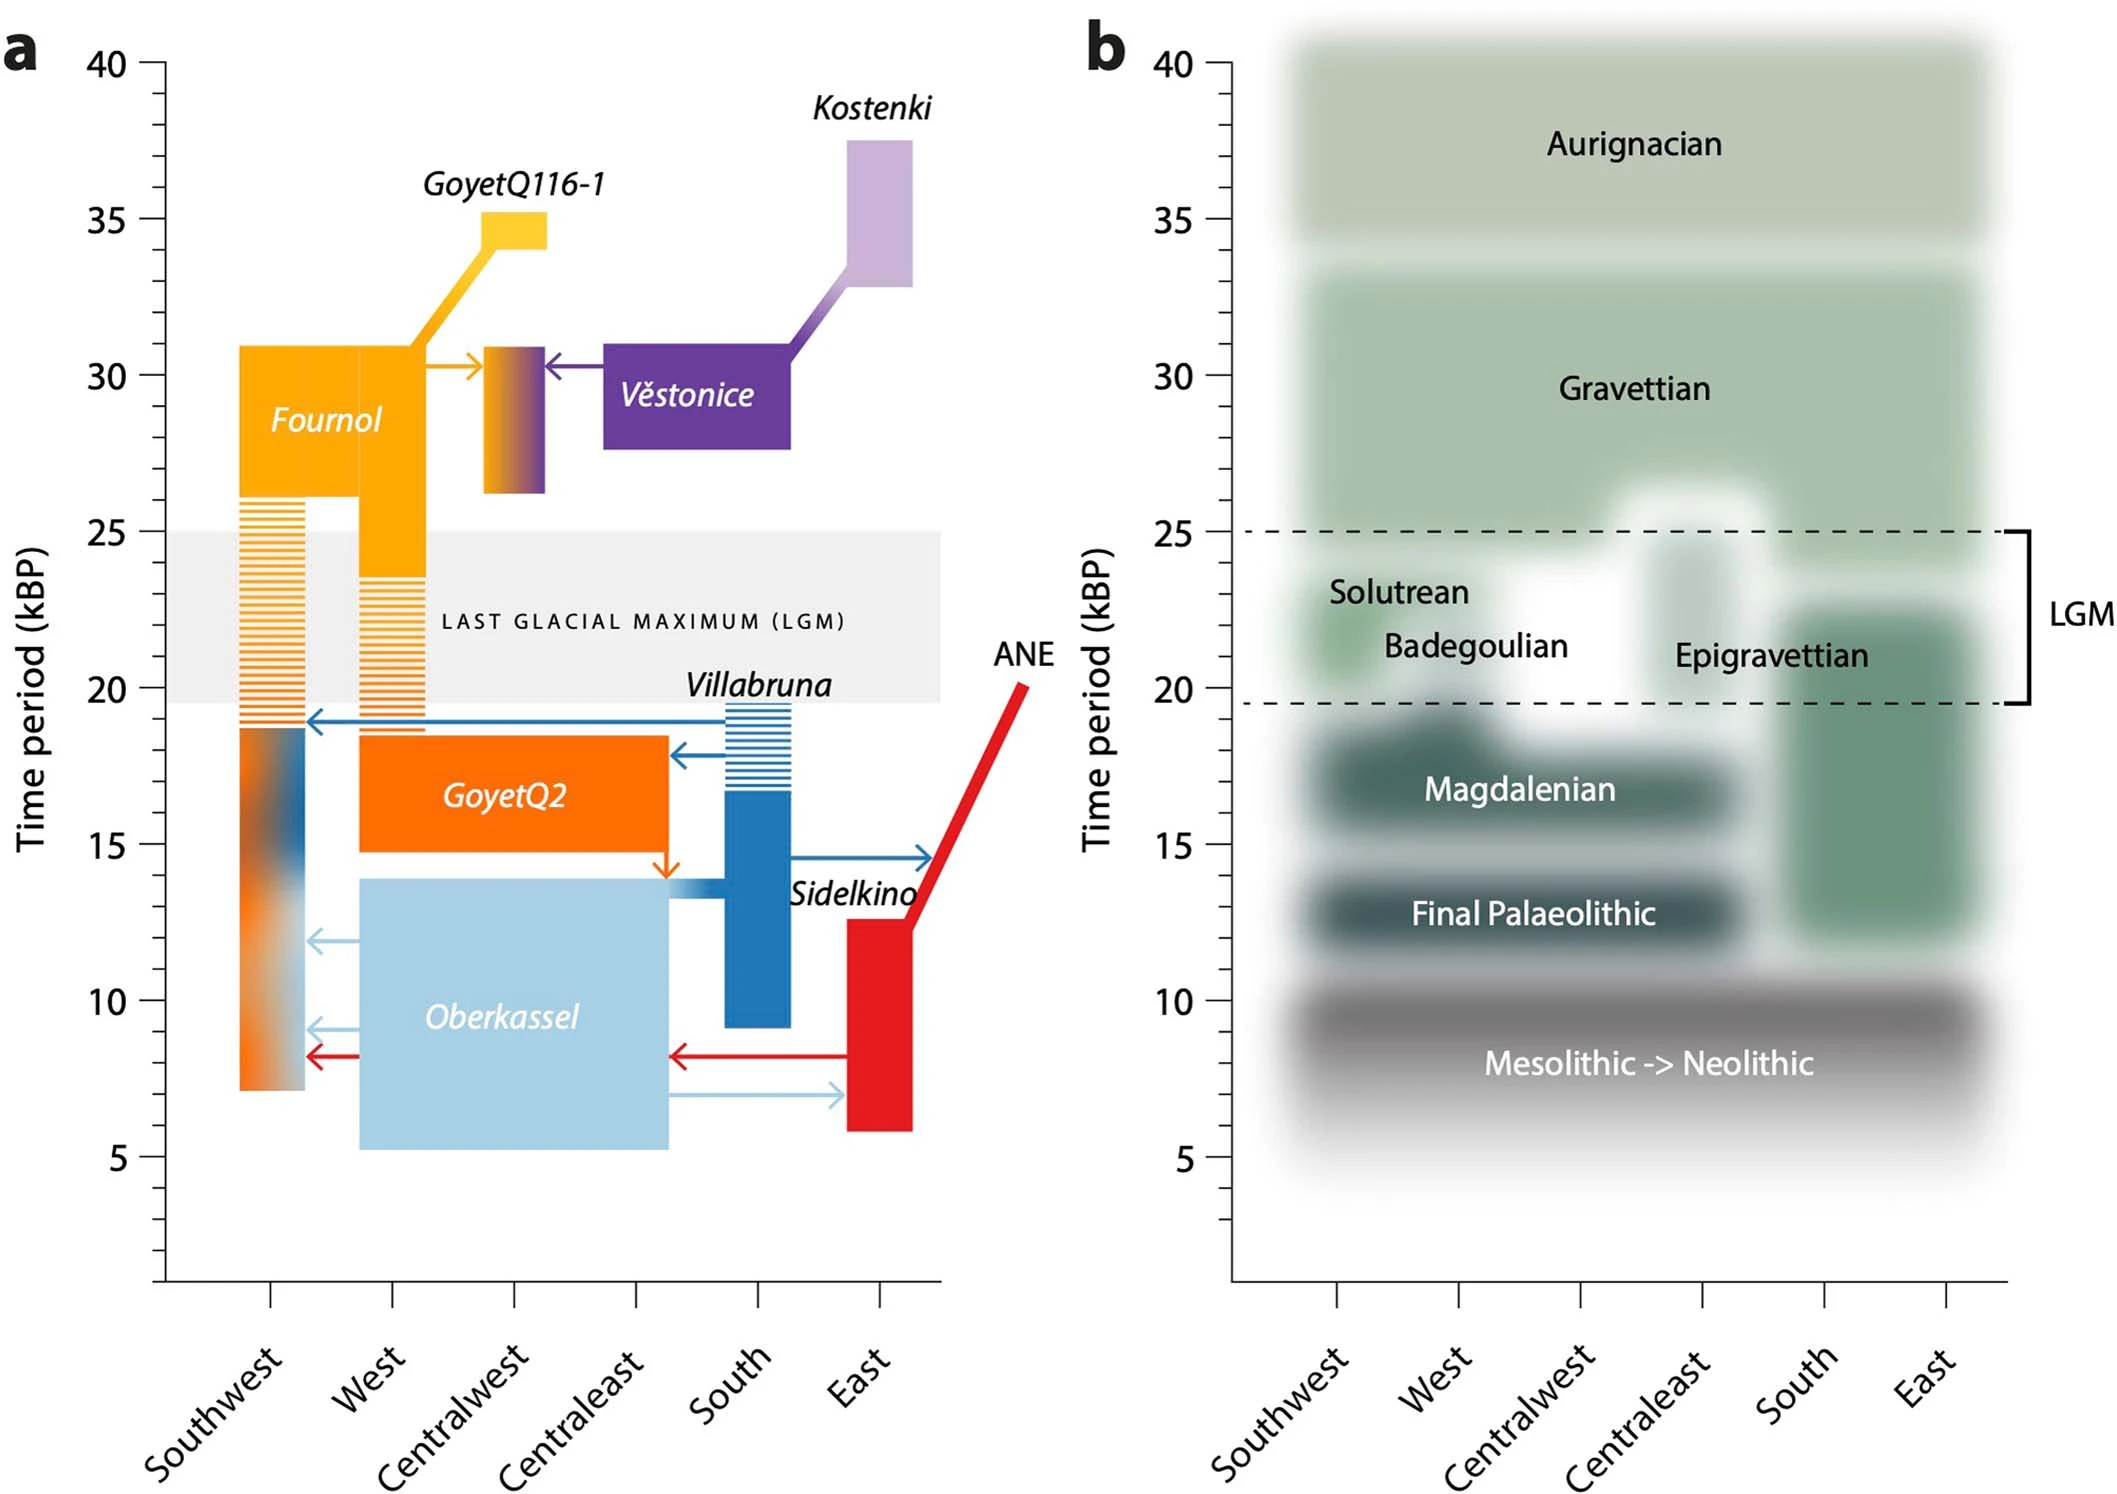 This figure shows (a) the distribution of and interaction between hunter-gatherer genetic ancestries and (b) a simplified schematic representation of major chrono-cultural subdivisions of the European Upper Palaeolithic (green blocks) followed by a grouped Mesolithic to Neolithic block (in gray). The x-axes report the geographic regions as divided in Fig. 1a, and the y-axes report time in thousand years before present (kBP). In panel a, genetic affinity between different ancestries is indicated by thick lines or shades, while admixture is indicated with arrows. In panel b, the colour code does not imply archaeological similarities. |
|
|
|
Post by Admin on Aug 9, 2023 18:32:57 GMT
Genetic continuity, isolation, and gene flow in Stone Age Central and Eastern Europe Abstract The genomic landscape of Stone Age Europe was shaped by multiple migratory waves and population replacements, but different regions do not all show similar patterns. To refine our understanding of the population dynamics before and after the dawn of the Neolithic, we generated and analyzed genomic sequence data from human remains of 56 individuals from the Mesolithic, Neolithic, and Eneolithic across Central and Eastern Europe. We found that Mesolithic European populations formed a geographically widespread isolation-by-distance zone ranging from Central Europe to Siberia, which was already established 10,000 years ago. We found contrasting patterns of population continuity during the Neolithic transition: people around the lower Dnipro Valley region, Ukraine, showed continuity over 4000 years, from the Mesolithic to the end of the Neolithic, in contrast to almost all other parts of Europe where population turnover drove this cultural change, including vast areas of Central Europe and around the Danube River. Introduction Modern humans started spreading into Europe some 50,000–40,000 years ago1,2,3. Before the agricultural transition that started ~8500 years ago4,5, Europe was inhabited by hunter-gatherer populations, roughly clustering into two groups (as defined by archaeogenetics); Western Hunter-Gatherers (WHG) in Western Europe and East European Hunter-Gatherers (EHG)6,7,8 in northeastern and in the extreme eastern frontier of Europe9,10. In between these core regions, the groups from the east (EHG) and from the west (WHG) probably met and admixed11,12,13. In Scandinavia, where ice coverage partially persisted until 10,000 years ago, the colonization of WHG groups took place from the south, whereas EHG groups entered from the northeast, likely following the Norwegian Atlantic coast from the north to the south, creating an admixture pattern that goes in the opposite direction to central/eastern Europe11. However, our knowledge concerning the history and dynamics as well as the time scale of genetic admixture and continuity of the Mesolithic populations across Europe is still limited. The population structure of Stone Age Europe experienced a large-scale change in the early Holocene. This change was driven by the migration of farming groups (European Neolithic, EN)14,15,16 from the Near East, which were genetically closely related to the groups from the Neolithic Anatolia (AN)17,18,19 and more distantly to the hunter-gatherers from the Caucasus region also known as CHG20. The mode and level of population interaction in the initial and subsequent times of the European Neolithic farmers and hunter-gatherers has been a matter of debate for very long time. The current consensus points to geographically and temporally varying level of genetic admixture of the EN and WHG groups7,21,22,23,24 starting already at the early stages of the arrival of the former in central Europe24. Based on evidence from the archeological record, there may have been differences in the levels of cultural contacts between the farmer and hunter-gatherer groups in a west-east gradient of the widely spread Early Neolithic Central European Linear Pottery culture (LBK)25. However, the suggested differences in interaction levels may have been in the form of exchange of goods rather than genetic admixture. In addition to the variable contacts and interactions between the hunter-gather and incoming farmer groups, in some European regions (for instance in parts of Scandinavia, the Baltic region, and the Eastern Europe) the hunter-gathering lifeway prevailed for much longer in comparison with the Southern and Western Europe. In Ukraine for example, the steppe and forest steppe zones of the North Pontic region were inhabited by hunter-gatherer communities still during the Neolithic sustaining mostly on aquatic resources26. A similar type of development took place in these communities as in the Neolithic farming groups. For instance, in some parts of Eastern and Northeastern Europe pottery was introduced but the subsistence was still mainly based on hunting and gathering27,28. Genetic data from some of these groups have shown that the genetic makeup before and after the European agricultural dawn remained similar in contrast to Central and Western Europe12,29,30. To improve our understanding of the level, character, and regional variability of contacts between the Central and Eastern European Stone Age groups, we sequenced and analyzed whole genomes of individuals who lived before and after the Neolithic transition (i.e., 7500–5500 cal BP) in the eastern frontier of Europe. The investigated area encompasses an area covering modern-day Romania, Poland, and the lower Dnipro Valley region in Ukraine over a time span of ~5000 years (ca. 10,500–5500 cal BP). Our investigation revealed that before Neolithic, the eastern frontier of Europe contained an admixture cline between genetically differentiated groups from Central Europe and Siberia. We also observe stronger genetic continuity and limited admixture in the Dnipro Valley region after the Neolithic transition while large-scale gene flow took place in populations further to the west. www.nature.com/articles/s42003-023-05131-3 |
|

