|
|
Post by Admin on Nov 24, 2017 19:11:06 GMT
DISCUSSION Our analysis indicates that positive selection on pigmentation variants associated with depigmented hair, skin, and eyes was still ongoing after the time period represented by our archaeological population, 6,500–4,000 y ago. This finding suggests that either the selection pressures that initiated the selective sweep during the Late Pleistocene or early Holocene were still operative or that a new selective environment had arisen in which depigmentation was favored for a different reason. The high selection coefficients estimated for pigmentation genes HERC2, SLC45A2, and TYR are best understood in the context of estimates obtained for other recently selected loci. Using spatially explicit simulation and approximate Bayesian computation, selection on the LCT -13,910*T allele—which is strongly associated with lactase persistence in Europeans and southern Asians—was inferred to fall in the range 0.0259–0.0795 and to have begun around 7,500 y ago in the region between the Balkans and central Europe (37). However, another simulation-based study incorporating latitudinal effects on selection resulted in a lower estimate of S (0.008–0.018) (38). The selective advantage of the G6PD A− and Med deficiency alleles conferring resistance to malaria have been estimated at 0.019–0.048 and 0.014–0.049, respectively, in regions where malaria is endemic (39). These alleles are estimated to have arisen ∼6,357 y ago (G6PD A−) and 3,330 y ago (G6PD Med) (39). Thus, the estimates of S for the three pigmentation genes examined in this study are comparable to those for the most strongly selected loci in the human genome.  Although these estimated selection coefficients are high, they are comparable to previous estimates for genes in the pigmentation complex. The selective sweeps favoring the SLC45A2 derived allele, as well as the derived alleles of SNPs in SLC24A5 and TYRP1, which are also implicated in the lightening of skin pigmentation, are estimated to have begun between 11,000 and 19,000 y ago, after the separation of the ancestors of modern Europeans and East Asians (the ages of the selective sweeps affecting HERC2 and TYR have not yet been estimated) (14, 40). Beleza et al. (14) recently estimated the coefficient of selection at the SLC45A2 locus to be 0.05 under a dominant model of inheritance and 0.04 under an additive model. Selection favoring the derived alleles of SNPs in SLC24A5 and TYRP1 was found to be similarly strong. Estimating selection coefficients using the ancient DNA-based simulation approach presented here offers considerable advantages over traditional methods based on allele age and frequency estimates (1): Selection coefficients are estimated over a defined period; selection acting on standing variation can be accommodated; and our approach is insensitive to the frequently unaccounted for uncertainties associated with allele age estimation using molecular or recombination clocks. This latter advantage is likely to result in considerable improvements in precision. However, our approach does require the assumption of population continuity and will not provide direct estimates of when a selective sweep began. |
|
|
|
Post by Admin on Nov 26, 2017 18:59:05 GMT
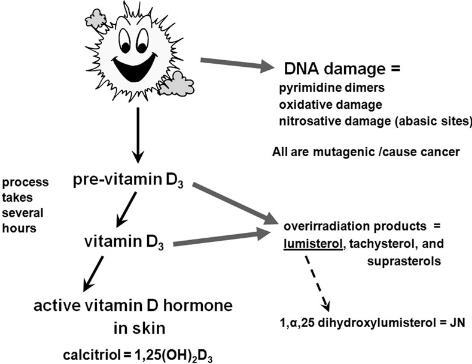 Although the strength of the selection coefficients in a certain time window can be estimated with improved precision using our ancient DNA-based simulation approach, the actual nature of the selection pressure remains unknown. However, temporal and geographical information from the prehistoric skeletal population under study can help in formulating reasonable hypotheses. Geographic variation in many functional skin pigmentation gene polymorphisms (13), and lighter skin pigmentation more generally, correlate strongly with distance from the equator in long-established populations, suggesting that selective pressure also occurred along a latitudinal gradient. The samples in our study were from between 42°N and 54°N, a latitudinal belt in which yearly average UVR is insufficient for vitamin D3 photosynthesis in highly melanized skin (4, 41). Constraints on the ability to photosynthesize vitamin D3 imposed by low incident UVR intensity may have provided significant selective pressure favoring lighter pigmentation populations in high-latitude regions such as the northern Pontic steppe belt. The need to admit UVB radiation to catalyze the synthesis of vitamin D3, together with the decreased danger of folate photolysis at higher latitudes, may account for the observed skin depigmentation from prehistoric to modern times in this region (5). Dietary change during the Neolithization process may have reinforced selection pressure favoring depigmented skin. The individuals analyzed in this study lived ∼500–2,000 y after the arrival of farming in the region north of the Black Sea (42, 43). In many parts of Europe, the Mesolithic–Neolithic transition is associated with a switch from a vitamin D-rich aquatic or game-based hunter–gatherer diet (44) to a vitamin D-poor agriculturalist diet. In low-UV regimes such as the one prevailing in our study region, it is difficult to meet vitamin D requirements without the consumption of significant quantities of oily fish or animal liver (45, 46). The vitamin D recommended dietary allowance of 800–1,000 IU for adults requires the daily consumption of the equivalent of 100 g of wild salmon (the dietary input with the greatest measured vitamin D concentration). Isotopic evidence suggests that the populations sampled in our study continued to access aquatic resources, primarily river fish, in the Neolithic, Eneolithic, and Bronze Age, although there was considerable heterogeneity in fish consumption within the study region (47–50). However, any diminution in fish consumption may have been sufficient to generate additional selective pressure favoring depigmentation at this low-incident-UVR latitude. 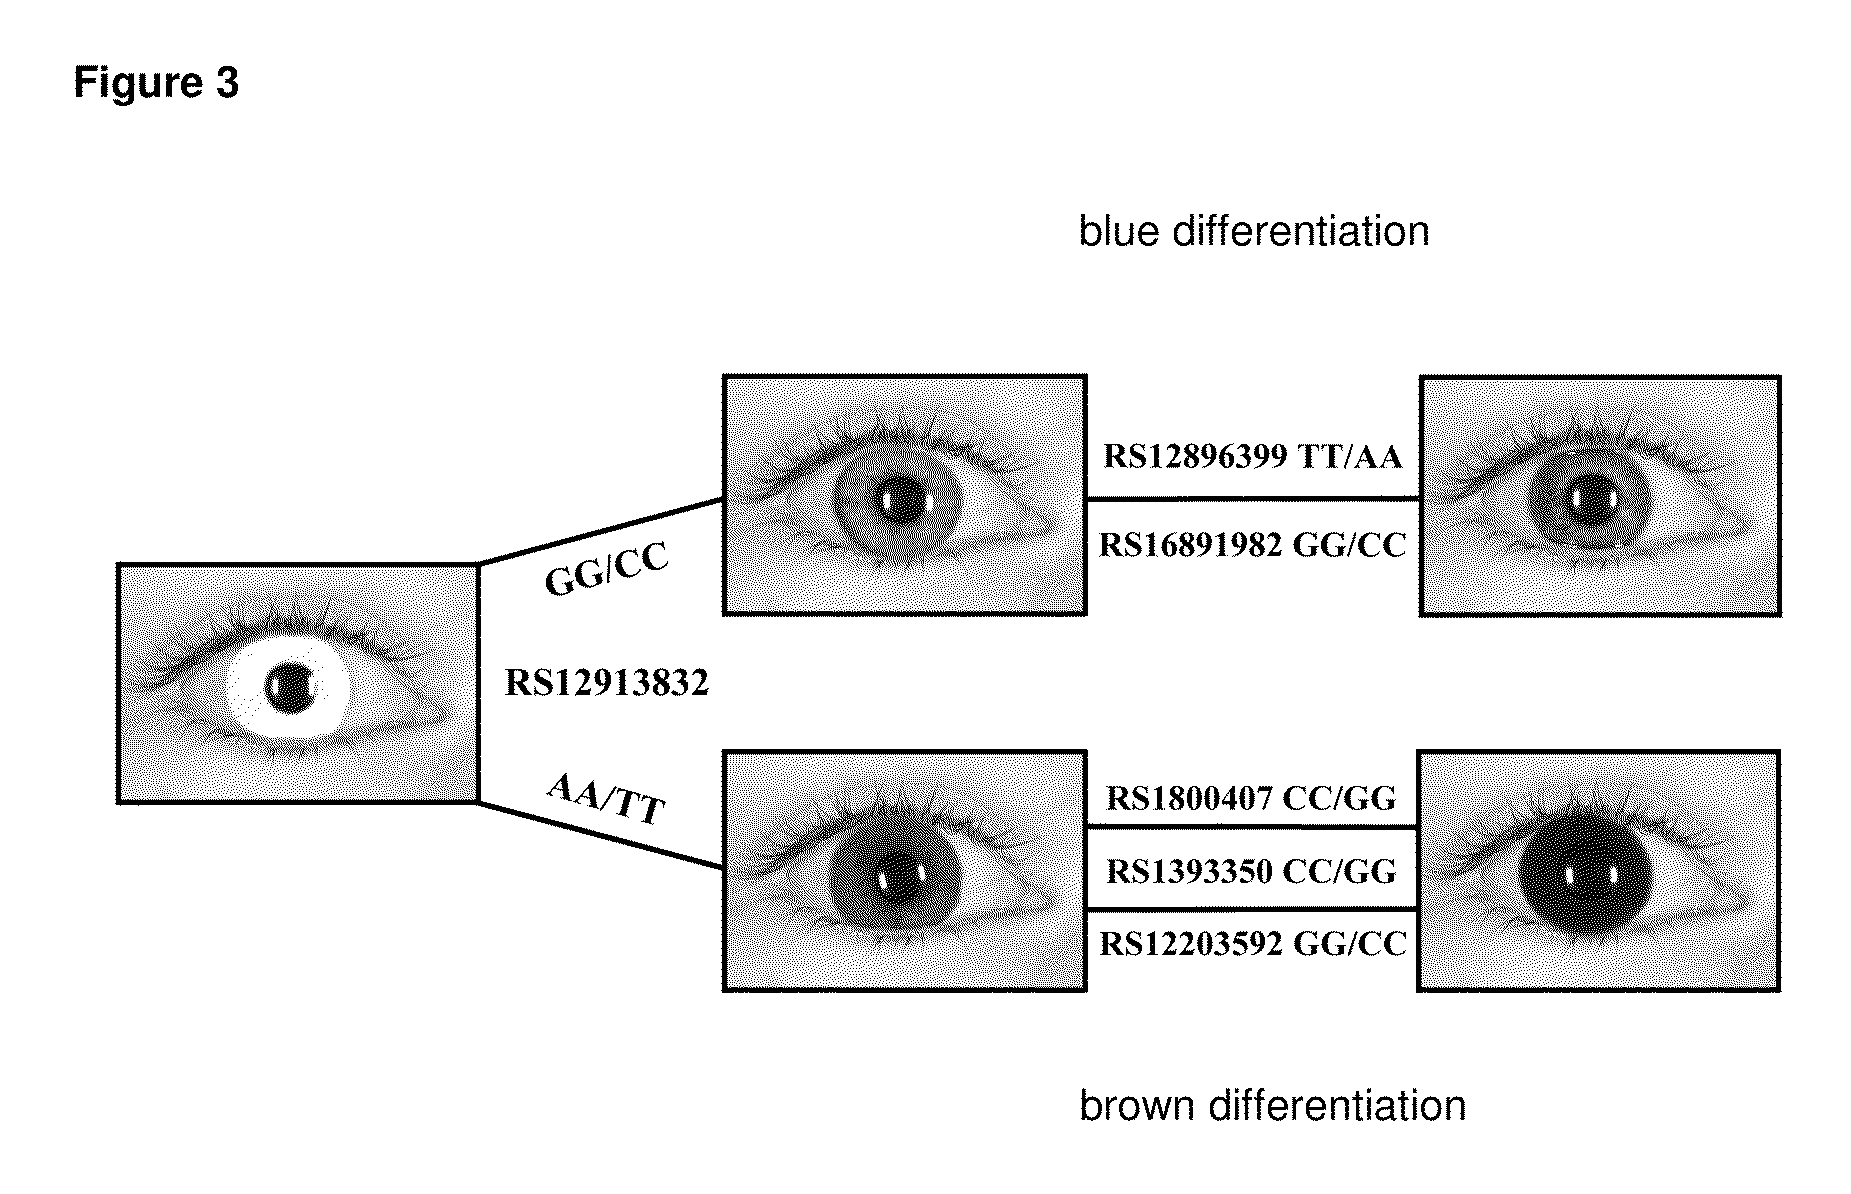 Although ecological and environmental factors may be sufficient to explain the observed change in European skin pigmentation, these explanations are unlikely to hold for eye and hair color. The geographic distribution of iris and hair pigmentation variation does not conform as well to a latitudinal cline model, with much of the observed phenotypic variation restricted to Europe and closely related neighboring populations (51, 52). The blue iris phenotype characteristic of the HERC2 rs12913832 G allele, for example, is almost completely restricted to western Eurasia and some adjacent regions, its descendant populations, and populations containing European admixture (51, 52). It is possible that depigmented irises or the various human hair color morphs in Europeans are by-products of selection on skin pigmentation. There is evidence for gene–gene interaction within the polygenic system governing complex pigmentation traits; interactions between HERC2, OCA2, and MC1R, in particular, have been found to have a statistically significant effect on hair, iris, and skin color (36). There is also evidence for epistatic interactions between components of the melanin synthesis pathway in other mammalian model systems, including interactions between the products of ASIP, MC1R, and TYR (53). Additionally, many pigmentation genes, including TYR, HERC2, and SLC45A2 have pleiotropic effects on skin, hair, and eye color (11, 36). Given that intraspecific pigmentation variability in other taxa, particularly avians, has been attributed to signaling and other factors associated with mate choice (54) it is possible that depigmented irises and the various hair colors observed in Europeans arose through sexual selection (7). Frequency-dependent sexual selection in favor of rare variants has been observed in vertebrates (55, 56), and such selection favoring rare pigmentation morphs could have driven alleles associated with lighter hair and eye colors to higher frequency. Once lighter hair and eye pigmentation phenotypes reached appreciable frequencies in European populations, these novel traits may have continued to be preferred as indicators of group membership, facilitating assortative mating. Assortative mating based on coloration is common in vertebrates (57), and skin pigmentation has been observed as a criterion for endogamy in modern human populations (58, 59). In addition, there is some evidence that lighter iris colors, because of their recessive mode of inheritance, may be preferred by males in assortative mating regimes to improve paternity confidence (60). Consistent with positive assortative mating, an exact test of Hardy–Weinberg equilibrium reveals an excess of HERC2 rs12913832 homozygotes in both the modern (P = 0.0543) and ancient (P = 0.0084) East European samples genotyped here (Table S3), despite the relatively small sample sizes. 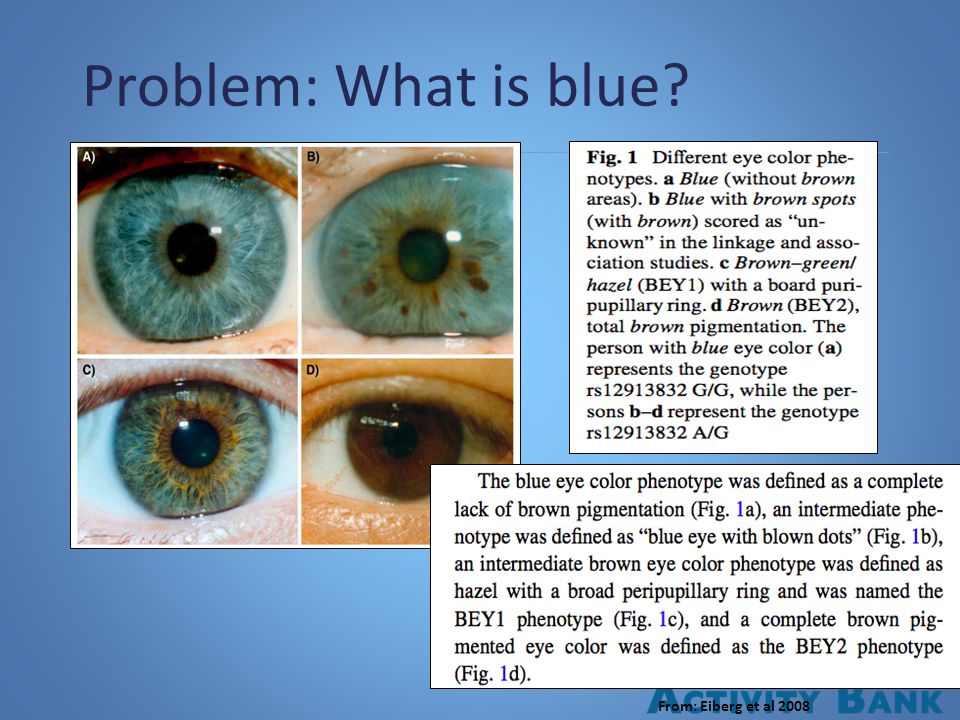 The observed excess of HERC2 rs12913832 homozygotes in the ancient sample might be explained by population stratification in a temporally heterogeneous population sample. Although we do not observe any chronological or spatial patterning of the pigmentation markers in our prehistoric sample, we cannot exclude population stratification in the absence of additional neutral SNPs. However, we note that neither the TYR nor the SLC45A2 SNPs investigated here, nor three additional SNPs investigated in the same ancient and modern samples, showed any significant observable excess of homozygotes (Table S3), suggesting that the excess of HERC2 rs12913832 homozygotes is less likely to be due to population stratification. Proc Natl Acad Sci U S A. 2014 Apr 1; 111(13): 4832–4837. Published online 2014 Mar 10. doi: 10.1073/pnas.1316513111 PMCID: PMC3977302 Anthropology |
|
|
|
Post by Admin on Apr 8, 2018 18:49:07 GMT
 The study provides a glimpse into the movements of early humans, as they populated new lands and latitudes. For example, our trivia above tells us fair skin evolved in two separate events for Europeans/South Asians and East Asians. A team of biologists from Europe, India and Australia examined the genes of more than 1,600 South Asian people. Although previous studies had found three genes play a part in skin color in South Asians, the researchers zeroed in on the one gene identified as most important, SLC24A5. (One of the other important genes is SLC45A2, which happens to be the gene that makes white tigers.) In fact, the researchers mostly examined just one form of SLC24A5, called allele A. Allele A is what makes Europeans and some South Asians fairer. The researchers looked for how prevalent allele A was in different South Asian populations as clues to how those populations' ancestors might have spread over the Indian subcontinent. The study volunteers included 43 ethnic groups and 54 "distinct tribal and caste populations," according to a paper about the study, which was published in the journal PLOS Genetics.  One of the key pigmentation genes in humans is SLC24A5 (OMIM 609802). It is located on chromosome 15q21.1 and encodes a protein called NCKX5. The association of this gene with lighter pigmentation was initially discovered in zebrafish [4]. Using admixed populations, it was further demonstrated in this study [4] that a non-synonymous variant (ref SNP ID: rs1426654) in the third exon of this gene explains 25–38% of the skin color variation between Europeans and West Africans. The ancestral (G) allele of the SNP predominates in African and East Asian populations (93–100%), whereas the derived (A) allele is almost fixed in Europe (98.7–100%) [4]. Functional assays of this gene suggested its direct involvement in human melanogenesis through cation-exchange activity [17], [18]. However, the fact that the ancestral (G) allele is virtually fixed not only in Africans but also in East Asians suggests that light skin at high latitudes evolved independently in East and West Eurasia [19]. Genome-wide scans have also identified SLC24A5 as one of the most important “hot spots” for positive selection in Europeans, thereby supporting the role of natural selection acting on this gene [4], [20], [21]. Populations of South Asia live at lower latitudes than would be expected to require selection for lighter skin color on the basis of improved vitamin D synthesis [8]. Nevertheless, South Asians do exhibit a wide variation in skin color [22]. Two previous studies have assessed the genetics of skin pigmentation variation in expatriates from South Asia. The first of these [6] concluded that non-synonymous variants at three genes, SLC24A5, SLC45A2 (OMIM 606202), and TYR (OMIM 606933), collectively contribute to variation in skin pigmentation in South Asians, with SLC24A5 showing the largest effect. The second study on common disease variants suggested high prevalence of the light skin associated allele of SLC24A5 in Asian Indians [23]. Nevertheless, both the studies involved populations that were structured and represented only a small range of the vast ethnic and genetic landscape of South Asia. Hence, comprehensive assessment of this phenotypic trait in native populations of South Asia has been lacking so far. |
|
|
|
Post by Admin on Apr 9, 2018 18:47:32 GMT
 Table 1. Global range of human skin pigmentation assessed by the melanin index (MI). Therefore, in the present study, we sought to address the following objectives. First, we aimed to quantify the amount of skin pigmentation variation that can be explained by the rs1426654 SNP of SLC24A5 in a homogeneous cohort of 1228 individuals from South Asia. Second, we studied the geospatial pattern of rs1426654-A allele in the Indian subcontinent using 1573 individuals from 54 populations and investigated how various factors influence its distribution. Third, we aimed to uncover the fine-scale genetic variation of SLC24A5 and determined the coalescence age of rs1426654 by resequencing 11.74 kb in a diverse set of 95 individuals. Lastly, we assessed whether SLC24A5 resequencing data and genome-wide genotype data were in concordance with the earlier reported evidence of positive selection in Europeans, and tested for any further evidence of selection among the studied populations. Our results confirm that rs1426654 plays a key role in pigmentation variation, while in-depth study of the light skin associated allele (rs1426654-A) among Indian populations reveals that the genetic architecture of skin pigmentation in South Asia is quite complex. The present study also provides important insights on evidence of positive selection and the evolutionary history of this light skin associated allele.  Figure 1. Association of rs1426654 genotypes with melanin index. (A) Distribution of melanin index (MI) in 1228 individuals of Cohort A. The two dotted black lines represent approximately 10% thresholds for the low (MI<38) and high (MI>50) MI groups, which were used to assess genotype-phenotype association using a logistic regression model. (B) Distribution of mean melanin index for the genotypes of rs1426654. The mean melanin indices for each genotype, as obtained separetely for males and females are shown together with their 95% confidence intervals, as estimated by multiple imputation model (Table S3A). We further aimed to estimate the effect size of the SNP. However, direct estimation of the effect size based on the samples genotyped from high or low MI group of Cohort A would only allow us to assess the effect of genotype for the extremes of pigmentation phenotype rather than for the whole distribution. Therefore, to estimate how much variation in MI could be explained by the rs1426654 SNP if all 1228 individuals in Cohort A had been genotyped, we used a multiple imputation approach based on simulations. The distribution of estimated mean MI across the genotypes, as obtained separately for males and females from the imputed dataset, is presented in Figure 1B and Table S3A. We observed that the estimated mean MI for each genotype in females was lower than that of males (Table S3A). Analysis of the imputed datasets using a General Linear Model (GLM) revealed that the effect of genotype was highly significant (p<1×10⁻¹⁶). Notably, the total variation in pigmentation (R2) that can be explained by the full model (including sex and genotype) was calculated to be 29% (95% CI, 24–34), while that by the SNP alone was 27% (95% CI, 22–32). Besides the quantitative assessment of the effect size, we found that the effect of the SNP was not exactly additive. Individuals with GG genotypes were darker than expected under the additive model (Table S3B). This result is consistent with the similar mode of inheritance observed in SLC24A5 by Lamason [4] and in other pigmentation genes, such as KITLG (OMIM 184745) and SLC45A2 [7], [19]. |
|
|
|
Post by Admin on Apr 10, 2018 18:48:59 GMT
 Figure 2. Isofrequency map illustrating the geospatial distribution of SNP rs1426654-A allele across the world. Geospatial distribution of rs1426654-A allele and its correlation with geography, language and ancestry component In an attempt to map the geospatial pattern of rs1426654-A allele frequencies across South Asia, we genotyped 1054 individuals across 43 ethnic groups including major language groups and geographic regions (see Materials and Methods, Cohort C) from the Indian subcontinent. In summary, 1573 individuals from 54 distinct tribal and caste populations from all the three cohorts (A, B and C) were assessed for this polymorphism (Table S4; Figure S1). We found that the rs1426654-A allele is widely present throughout the subcontinent, although its frequency varies substantially among populations (0.03 to 1) with an average frequency of 0.53±0.32 (Table S4). To explain how the various genetic and non-genetic factors affect the geospatial distribution of the rs1426654-A allele in the Indian subcontinent, we assessed the correlation of rs1426654-A allele frequency with major geographical divisions, language families and the ancestry component detected in previous studies of Indian populations [24], [25]. However, to avoid bias due to low sample sizes in some of the populations, only data from 1446 individuals representing 40 populations were used (Table S5). Although we observe a considerable local heterogeneity, there is a general trend of rs1426654-A allele frequency being higher in the Northern (0.70±0.18) and Northwestern regions (0.87±0.13), moderate in the Southern (0.55±0.22), and very low or virtually absent in Northeastern populations of the Indian subcontinent (Figure 2, Table S6). Notably, the Onge and the Great Andamanese populations of Andaman Islands also showed absence of the derived-A allele. Given the fact that one can observe a pronounced latitudinal cline for skin pigmentation across world populations, we also sought to test the observed derived-A allele frequencies in terms of absolute latitude and longitude in South Asia. We found that the rs1426654-A allele frequency in South Asia does not significantly correlate with latitude (r = 0.23, p = 0.15). However, a significant negative correlation with longitude (r = −0.49; p = 0.002) was observed.  We found that the Tibeto-Burman and the Austroasiatic language families have the lowest frequencies of the A allele ( and Table S6). The rs1426654-A allele frequency was significantly higher in Indo-European speakers than in other language groups (Table S6). In particular, there was a significant difference (p<0.001) between the A allele frequencies of the Indo-European and the Dravidian speaking groups. We found that both language and geography have a significant influence on rs1426654-A allele frequency, as revealed by Mantel tests (p<0.001). We also studied the geospatial pattern of rs1426654-A allele frequencies at the global level using 2763 subjects from previously published data (Table S7) and 1446 individuals from the present study (Table S5). The isofrequency map illustrates high frequencies of the rs1426654-A allele in Europe, Middle East, Pakistan, moderate to high frequencies in Northwest and Central Asia, while being almost absent in East Asians and Africans with notable exceptions in Bantu (Southwest), San, Mandeka, and Ethiopians (Table S7, Figure 2). As rs1426654-A allele frequency was found to be higher in West Eurasian populations that are known to share one of the genome-wide ancestry components of South Asia [24], [25], we sought to test the correlation between the derived-A allele frequency and the proportion of the West Eurasian ancestry component (as depicted by the “light green component” in [24]) for the studied populations. For this, we used the genome-wide information available on Indian populations from literature [24]–[28] (Table S8) and relevant global reference populations to perform the ADMIXTURE run. Population structure as inferred by ADMIXTURE analysis at K = 7 is shown in Figure S2A. The proportions of k5 light green ancestry component obtained at K = 7 for the populations studied were plotted against the rs1426654-A allele frequency available for all populations and South Asia in particular (Figure S2B). As shown in Figure S2B, we obtained a significant positive correlation for South Asian populations (r = 0.90, p<0.0001) but a weak, although significant correlation when all populations sharing the k5 component (r = 0.64, p = 0.04) were considered. |
|

