|
|
Post by Admin on Feb 7, 2019 17:58:48 GMT
 Published in the journal Cell, the study attempts to give greater clarity on the genetics of the earliest settlers in South America. The study has a vast number of authors ranging from archaeologists that uncovered ancient remains to the analysts of the DNA itself. They extracted small amounts of DNA from bone samples and return the remains back to the archaeologists. “Very little is known about the migrations that took place into the Americas as compared with Europe or Asia,” Nathan Nakatsuka told The Bogotá Post about how this nascent technology could provide answers to the question of who the earliest settlers were in South America. Nakatsuka is a PhD student at the David Reich Lab at Harvard Medical School and was one of the lead authors on the study.  It had been known prior to this study that the earliest migrants into North America had arrived at the Bering strait from Asia around 20,000 years ago and into North America around 16,000 years ago. Individual remains on the continent also suggested that this original group split into two populations around 16,000 years ago in North America following that migration. It remains unclear as to what genetic admixture took place between these two populations– named ANC-A and ANC-B–but this study did show that the ANC-A population were likely the pioneers into South America as their genes were found in ancient remains throughout the continent. “Our paper suggests that all the samples that we have [from South America] have very limited amounts of ANC-B in them,” Nakatsuka said.  Clovis culture moves in One of the study’s key findings was the likelihood of individuals associated with Clovis culture being among the first to populate South America. The Clovis Complex in archeology refers to a period characterised by projectile points, or “spear tips”, precise and powerful enough to hunt mammoths that were used by the people that were living in North America around 13,000 years ago. The most famous example of a Clovis-associated individual was the ancient remains of a baby boy found in a farm in Montana at a burial site that was in the vicinity of Clovis artifacts. The boy was unceremoniously named Anzick-1 as his remains were found on the Anzick family ranch. The remains were around 12,800 years old, making him the oldest and most important fully-sequenced individual in the Americas.  Interestingly, the ancient remains of individuals in Belize, Brazil and Chile all showed a strong genetic correspondence to Anzick-1, suggesting that the people of the Clovis culture, after having populated North America, also pushed on to expand into Central and South America. Twin mysteries: Population Y and the California Channel Islands One major bone of contention among archeologists as it relates to the Americas involves the fossil records of the Lapa do Santo region in Brazil where the shape of skull remains correspond more with individuals from Africa or Melanesia rather than with other Native Americans at later time points. “A previous study had found a signal of genetic ancestry in some present day Amazonian groups that had a specific affinity to present day indigenous Australian and Melanesian groups,” Nakatsuka said, which suggested that the genetic ancestry is from a different migration from Asia. “This genetic signal, termed “Population Y” ancestry, was thought to be potentially an explanation for the different skull morphologies found in some ancient Native Americans.”  However, Nakatsuka told us that the ancient-DNA results suggest that the Lapa do Santo individuals are not genetically more closely related to any group outside of the Americas (e.g. from Melanesia or Australia) relative to the other ancient indigenous individuals with different skull morphology. “It’s possible that the Paleo-american skull morphology was either due to environment or it could have been associated with the fact that these Lagoa  individuals were Clovis Ancestry and were later replaced with another ancestry. But there doesn’t seem to be a very obvious connection right now between the genetics and the skull morphologies.” 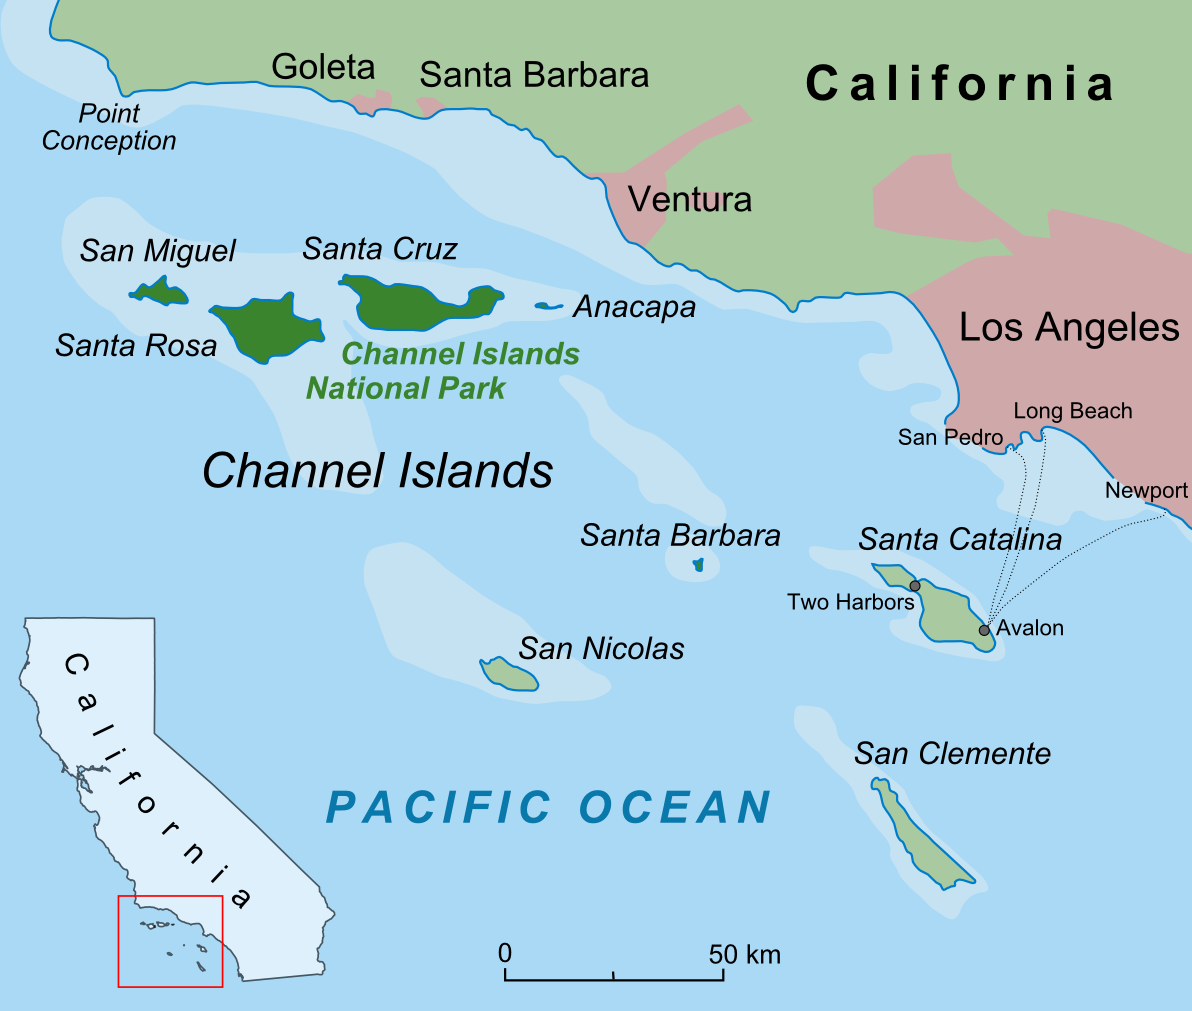 Another intriguing mystery tossed up by the study was a possible genetic link between ancient individuals found in the Channel Islands off the coast of California and a population found in the the Southern Peruvian Andes around 4,200 years ago. The California Channel Islands have some of the oldest paleontological sites in the Americas and the researchers postulate that the population didn’t directly migrate to the Peruvian Andes but, instead, may have migrated thousands of years earlier and there just haven’t been any other individuals found with shared genetic material. A population explosion around 5000 years ago in the Andes may be one reason that this ancestry has been detected at such a late stage. |
|
|
|
Post by Admin on Feb 9, 2019 17:55:21 GMT
 Genetic studies of present-day and ancient Native Americans have revealed that the great majority of ancestry in indigenous people in non-Arctic America derives from a homogeneous ancestral population. This population was inferred to have diversified 17,500–14,600 calendar years before present (BP) (Moreno-Mayar et al., 2018a) into two branches that have been called “Southern Native American” or “Ancestral A” (ANC-A) and “Northern Native American” or “Ancestral B” (ANC-B) (Moreno-Mayar et al., 2018a, Raghavan et al., 2015, Rasmussen et al., 2014, Reich et al., 2012, Scheib et al., 2018). An individual dating to ∼12,900–12,700 BP from the Anzick site in Montana and associated with the Clovis culture was on the ANC-A lineage, which is also heavily represented in present-day Central and South Americans and in ancient Californians. In contrast, ANC-B ancestry is heavily represented in eastern North Americans and in ancient people from southwest Ontario (Scheib et al., 2018). The original studies that documented these two deep lineages fit models in which Central and South Americans were of entirely ANC-A ancestry (Rasmussen et al., 2014, Reich et al., 2012). However, Scheib et al. (2018) suggested that all Central and South Americans harbor substantial proportions of both ancestries (at least ∼30% of each). Recent analyses have also shown that some groups in Brazil share more alleles with Australasians (indigenous New Guineans, Australians, and Andaman Islanders) (Raghavan et al., 2015, Skoglund et al., 2015) and an ∼40,000 BP individual from northern China (Yang et al., 2017) than do other Central and South Americans. Such patterns suggest that these groups do not entirely descend from a single homogeneous population and instead derive from a mixture of populations, one of which, Population Y, bore a distinctive affinity to Australasians. Notably, our study includes data from individuals such as those from the Lapa do Santo site who have a cranial morphology known as “Paleoamerican,” argued to indicate two distinct New-World-founding populations (von Cramon-Taubadel et al., 2017). Here, we test directly the hypothesis that a Paleoamerican cranial morphology was associated with a lineage distinct from the one that contributed to other Native Americans (whether the proposed Population Y or another).  Figure 1. Geographic Locations and Time Ranges (Top) Color coding is based on the value of f4(Mbuti, Test; USR1, Anzick-1), which measures the degree of allele sharing of each Test population with Anzick-1 compared to the Ancient Beringian USR1 (the latter two plotted as green triangles). All values and standard errors are listed in Table S4. Present-day individuals are circles and ancient individuals are squares (the newly reported individuals are indicated with a thick black outline). (Bottom) We show previously published (gray) and newly reported ancient data. Magenta, Brazil; brown, Belize; green, Peru/northern Chile; blue, Southern Cone. The numbers give sample size in each grouping. Prior to the present study, published data from Central and South America older than the last millennium was limited to two low coverage genomes (Raghavan et al., 2015). Here, we report genome-wide data from 49 individuals from Belize, Brazil, Peru, and the Southern Cone (Chile and Argentina), 41 older than 1,000 years, with each time transect starting between 10,900–8,600 BP (Figure 1; Table S3). To obtain these data, we worked with government agencies and indigenous peoples to identify samples, prepared powder from skeletal material, extracted DNA (Dabney et al., 2013), and generated single and double stranded DNA libraries, most of which we treated with the enzyme uracil-DNA glycosylase (UDG) to reduce characteristic errors of ancient DNA (Gansauge and Meyer, 2013, Rohland et al., 2015). We enriched for mtDNA and ∼1.2 million SNPs (Fu et al., 2015) and sequenced the enriched libraries on Illumina instruments (Table S3; STAR Methods). We combined ancient and present-day data to study genetic changes over the last 11,000 years. |
|
|
|
Post by Admin on Feb 10, 2019 18:09:57 GMT
 Figure 2. Relatedness of Ancient to Present-Day People Allele sharing statistics of the form f3(Mbuti; Test, Ancient), where the “Ancient” individuals represented by a green triangle are Chile_LosRieles_10900BP, Argentina_ArroyoSeco2_7700BP, Brazil_LapaDoSanto_9600BP, Moraes_Brazil_5800BP, Belize_SakiTzul_7400BP, and Peru_Lauricocha_8600BP. The heatmap shows the degree of allele sharing, with red indicating most sharing; yellow, intermediate; and blue, least. Long-Standing Population Continuity in Multiple Regions of South America We grouped ancient individuals by location, date range, and genetic similarity, for the most part using italicized labels like Argentina_ArroyoSeco2_7700BP (“country” followed by “site” followed by a “date” that for us is the average of the midpoint of the date ranges for the individuals in the grouping rounded to the nearest hundred) (Eisenmann et al., 2018). These groupings sometimes span an extensive period of time; for example, the eight Arroyo Seco 2 date estimates range from 8,570 to 7,160 BP. For some analyses, we also lumped individuals into larger clusters, for example grouping individuals from the Andes before and after ∼4,200 BP into “Early Andes” and “Late Central Andes” based on qualitatively different affinities to other individuals in the dataset (STAR Methods). To obtain an understanding of how the ancient individuals relate to present-day ones, we computed f3- and f4-statistics, which estimate allele sharing between samples in a way that is unbiased by population-specific drift (Patterson et al., 2012).  Figure S1. Relatedness of Ancient to Present-Day Individuals, Related to Figure 2 Outgroup f3-statistics of the form f3(Mbuti; Test, present day Native American), where Test is an ancient individual in Figure 2. (A) Southern Cone (Chile and Argentina) individuals. (B) Late Central Andes individuals. (C) Early Andes individuals. (D) Brazil and Belize individuals. The oldest individuals in the dataset show little specific allele sharing with present-day people. For example, a ∼10,900 BP individual from Chile (from the site of Los Rieles) shows only slight excess affinity to later Southern Cone individuals. In Belize, individuals from two sites dating to ∼9,300 and ∼7,400 BP (Mayahak Cab Pek and Saki Tzul) do not share significantly more alleles with present-day people from the region near Belize than they do with present-day groups elsewhere in Central and South America. In Brazil, genetic data from sites dating to ∼9,600 BP (Lapa do Santo) and ∼6,700 BP (Laranjal) show no distinctive shared ancestry with present-day Brazilians (Figures 2 and S1; Table S1), although the Laranjal individuals do show potential evidence of shared ancestry with a ∼5,800 BP individual from Moraes (Table S4), confirmed by the statistic f4(Mbuti, Brazil_Laranjal_6700BP; Brazil_LapaDoSanto_9600BP, Brazil_Moraes_5800BP), which is Z = 7.7 standard errors from zero. We detect long-standing continuity between ancient and present-day Native Americans in each of the regions of South America we analyzed beginning at least ∼5,800 BP, a pattern that is evident in heatmaps, neighbor-joining trees, and multi-dimensional scaling plots computed on outgroup-f3 statistics (Figures 2, S1, and S2; Table S1). In Peru, the most ancient individuals dating up to ∼9,000 BP from Cuncaicha and Lauricocha share alleles at the highest rate with present-day indigenous groups living in the Central Andes (Lindo et al., 2018, Llamas et al., 2016). Individuals dating up to ∼8,600 BP from Arroyo Seco 2 and Laguna Chica also show the strongest allele sharing with some present-day indigenous people in the Southern Cone. In Brazil, the evidence of continuity with present-day indigenous people begins with the Moraes individual at ∼5,800 BP. A striking pattern of continuity with present-day people is also observed in the ∼2,000 BP Jabuticabeira 2 individuals who were part of the Sambaqui shell-mound building tradition that was spread along the south Brazilian coast from around 8,000–1,000 BP. The Jabuticabeira 2 individuals share significantly more alleles with some Ge-speaking groups than they do with some Tupi-Guarani speaking groups who have been predominant on the coast during the post-Colonial period (Figure S3; Table S1). This supports the theory of shared ancestry between the makers of the Sambaqui culture and the speakers of proto-Ge who are hypothesized to have lived in the region ∼2,000 BP (Iriarte et al., 2017). These findings also support the theory of coastal replacement of Ge speakers by Tupi-Guarani speakers after ∼1,000 BP (Hubbe et al., 2009) (STAR Methods). |
|
|
|
Post by Admin on Feb 11, 2019 18:07:25 GMT
 Figure S2. Correlation of Genetics and Geography, Related to Figures 2 and S1 Outgroup f3-statistics of the form f3(Mbuti; America1, America2) for both ancient and present-day Americ an groups for all individuals with over 100,000 SNPs of coverage. (A) Heatmap of the matrix of statistics. (B) Neighbor joining tree of the matrix of inverted statistics (distances = 1/outgroup f3-statistic). (C) MDS plot of the matrix of 1-outgroup f3-statistic. (D) PCA of ancient individuals projected onto present day variation. PCA built with the “unadmixed unmasked” version of the Illumina dataset (STAR Methods); newly reported ancient individuals are projected in black outline. Evidence for at Least Four Genetic Exchanges between South America and Other Regions Figure 1 plots the excess rate of allele sharing of ancient Central and South Americans with the ∼12,800 BP Anzick-1 individual from Montana compared to the ∼11,500 BP USR1 individual from Alaska, an Ancient Beringian who derives from a lineage that split from the one leading to all other known Native Americans before they separated from each other (Moreno-Mayar et al., 2018a) (Table S4). The distribution of this statistic f4(Mbuti, Test; USR1, Anzick-1) confirms previous findings that Anzick-1 relatedness is greatest in Central and South Americans and lowest in North American groups (Table S4) (Rasmussen et al., 2014), with the exception of the California Channel Islands, where the earliest individuals from San Nicolas Island around 4,900 BP show some of the highest Anzick-1 relatedness, consistent with an early spread of Anzick-1-related people to these islands followed by local isolation (Scheib et al., 2018) (Figure S2D).  Figure S3. Relatedness of Jabuticabeira 2 Individuals to Present-Day Groups, Related to Figure 2 and Table S1 Outgroup f3-statistics of the form f3(Mbuti; Brazil_Jabuticabeira2_2000BP, present day Native American). We marked with blue outline groups that speak Tupi-Guarani languages (Karitiana, Surui, Guarani and Parakana) and with a white outline groups that speak Ge languages (Kaingang) and Carib languages (Arara), and find that the latter two have a specific affinity to Brazil_Jabuticabeira2_2000BP. Archeological site location is indicated with a green triangle on each map. More careful examination reveals significant ancestry variability in the ancient South Americans. The ∼10,900 BP Los Rieles individual from Chile, the ∼9,600 BP individuals from Lapa do Santo in Brazil, and individuals from southern Peru and northern Chile dating to ∼4,200 BP and later (“Late Central Andes” from Cuncaicha, Laramate and Pica Ocho), share more alleles with Anzick-1 than do other South Americans (Figure 1; Table S4). Many of these signals of asymmetrical relationship to Anzick-1 are significant as assessed by statistics of the form f4(Mbuti, Anzick-1; Test1, Test2): Z score for deviation from zero as high as 3.4 for the (Test1, Test2) pair (Early Andes, Chile_LosRieles_10900BP), 3.1 for the pair (Early Andes, Brazil_LapaDoSanto_9600BP), and 3.0 for the pair (Early Andes, Late Central Andes) (Table S2). We confirmed these findings using qpWave (Reich et al., 2012), which evaluates the minimum number of sources of ancestry that must have contributed to a test set of groups relative to a set of outgroups (STAR Methods). We tested all possible pairs of populations and found that none of the three combinations are consistent with being derived from a homogeneous ancestral population: p = 0.0023 for (Early Andes, Brazil_LapaDoSanto_9600BP), p = 0.0007 for (Early Andes, Late Central Andes), and p = 0.0000004 for (Brazil_LapaDoSanto_9600BP, Late Central Andes). We obtained qualitatively similar results replacing Brazil_LapaDoSanto_9600BP with Chile_LosRieles_10900BP (Figure S4; Table S5). We also obtained similar results for subsets of individuals in each group. Our power to reject models of just two sources of ancestry for the ancient South American individuals depends critically on the use of Anzick-1 as an outgroup, as when we remove this individual from the outgroup set there is no evidence of a third source of ancestry contributing to Brazil_LapaDoSanto_9600BP (p = 0.11) or Chile_LosRieles_10900BP (p = 0.35). It also depends critically on the use of California Channel Islands individuals, as when we remove them as outgroups there is no evidence for a third source of ancestry contributing to Late Central Andes groups (p = 0.12). |
|
|
|
Post by Admin on Feb 12, 2019 17:57:15 GMT
 Figure S4. Minimum Number of Ancestral Sources, Related to Figures 4 and 5 qpWave analyses with all (A) pairs and (B) triplets of South American groups as “left” populations (related to Table S5, which also shows quadruplet and quintuplet statistics). Southern Cone, Belize, Brazil, and Early Andes individuals are labeled “Old,” while Late Central Andes individuals are labeled “Young.” Only individuals with over 100,000 SNPs covered were used for this analysis. The colors of the dots indicate whether the combination includes Brazil_LapaDoSanto_9600BP (red), Chile_LosRieles_10900BP (brown) or Argentina_ArroyoSeco2_7700BP or Argentina_LagunaChica_6800BP (orange). Cuncaicha_LA_combined refers to a combination of Peru_Cuncaicha_4200BP and Peru_Cuncaicha_3300BP. Rank 0 and 1 refers to a model in which all populations in the analysis fit as derived from one or two ancestral populations, respectively, relative to the outgroups (rejection of these ranks means that additional waves of ancestry are required to model the populations). The fact that the three pairs each require two different sources of ancestry in order to produce a model fit could mean that they descend from a total of three (or more) distinct sources of ancestry differentially related to groups outside South America or alternatively that they are mixtures in different proportions of only two sources. To distinguish these possibilities, we used qpWave’s ability to test for consistency with the hypothesis that sets of three populations (Test1, Test2, Test3) derive from just two populations relative to the same set of outgroups. qpWave rejects the hypothesis of two sources (p = 0.0022), a result that is unlikely to be due to backflow from South America into Central America as the signal persists when we remove present-day Mexicans from the outgroup set (p = 0.001) (Table S5). Further evidence for the robustness of the finding of three source populations comes from the fact that the signal remains significant when we restrict to transversion polymorphisms that are not affected by cytosine-to-thymine errors (p = 0.01). We caution that we did not find significant signals of ancestry heterogeneity relative to North American outgroups when repeating the qpWave tests on pairs of present-day populations. We speculate that this may reflect more recent homogenization leading to variation in ancestry proportions too subtle for our methods to detect. When we add present-day Surui individuals into the analysis, there is evidence for a fourth source of ancestry (p = 0.03) (Table S5), likely reflecting the same signal that led to finding “Population Y” ancestry in this group (Raghavan et al., 2015, Skoglund et al., 2015).  Figure 3. Skeleton Model that Fits the Data with Minimal Admixture Figure S5. Alternative Admixture Graphs, Related to Figures 4 and 5 (A) Admixture graph in the same format as Figure 3 except with Chile_LosRieles_10900BP added. The maximum Z-score is 3.2 (we give in parentheses the value when restricting to transversions, here 3.1). The significant shared ancestry between the two Los Rieles individuals is indicated by statistics such as f4(Mbuti, Chile_LosRieles_10900BP; Argentina_ArroyoSeco2_7700BP, Chile_LosRieles_5100BP), which gives Z = 2.8. The following graphs have the same format of Figure 4 but (B) with Chile_PicaOcho_700BP instead of Peru_Cuncaicha_4200BP. The maximum Z-score is 3.4 (4.7, a signal of poor fit that may be an artifact of extremely low coverage of Chile_PicaOcho_700BP when restricting to transversions). (C) with Peru_Laramate_900BP instead of Peru_Cuncaicha_4200BP, which gives a maximum Z-score of 3.6 (3.5). Admixture graphs with an extra added admixture edge of ANC-B (D) for Peru_Cuncaicha_4200BP (maximum Z-score is 3.3 (3.0)), (E) for Chile_PicaOcho_700BP (maximum Z-score is 3.4 (4.8)), and (F) for Peru_Laramate_900BP (maximum Z-score is 3.5 (3.5)). Admixture graph including Surui, which shows the necessity of additional East Asian-related ancestry into (G) Peru_Cuncaicha_4200BP (maximum Z-score is 4.2 (3.7)). (H) Chile_PicaOcho_700BP (maximum Z-score is 4.0 (4.6)). (I) Peru_Laramate_900BP (maximum Z-score is 4.1 (3.5)). This graph models nine of the ancient North, Central, and South American groups without admixture (branch lengths are in units of FST × 1,000). The maximum deviation between observed and expected f-statistics is Z = 2.9 (Z = 3.1 when restricting to transversions). Drift lengths in the terminal edges are unlabeled as randomly sampling an allele to represent each individual makes them artifactually long. Modeling the Deep History of Central and South America We modeled the relationships among diverse ancient Americans using qpGraph, which evaluates whether a model of population splitting and admixture is consistent with all f-statistics relating pairs, triples, and quadruples of groups (Patterson et al., 2012). We were able to fit genome-wide data from nine ancient North, Central and South American groups (not including Anzick-1) as a star-like radiation from a single source population with negligible admixture between the ANC-A and ANC-B lineages after their initial bifurcation (maximum |Z| score for a difference between the observed and expected statistics of 2.9 [Figure 3] and 3.2 [Figure S5A]; we represent ANC-B by the Ancient Southern Ontario population Canada_Lucier_4800BP-500BP). This model is not what would be expected based on the claim of a recent study (Scheib et al., 2018) that major ANC-A/ANC-B admixture (at least ∼30% of each) is necessary to model Central and South Americans. While we confirmed that the model proposed in Scheib et al. (2018) fits the data when restricting to a subset of the populations they analyzed, when we added into the model non-American populations with previously established relationships to Native Americans, the model failed (STAR Methods). To more directly explore whether there is evidence of widespread ANC-B ancestry in South America, we tested whether Canada_Lucier_4800BP-500BP shares more alleles with a range of Central and South American Test populations than with Anzick-1, but find no evidence for a statistically significant skew (Table S4). Indeed, the supplementary materials of the previously reported study (Figure S13 of Scheib et al., 2018) show that a model such as the one we favor—without widespread ANC-B admixture in South America—fits the data with no differences between observed and expected f-statistics greater than Z > 2. We also find that when we explicitly model ANC-B admixture into the ancestors of South Americans, the inferred genetic drift specific to Canada_Lucier_4800BP-500BP is not significantly different from 0, providing evidence against specific affinity to ANC-B in South Americans (Figure S6; STAR Methods). |
|


 individuals were Clovis Ancestry and were later replaced with another ancestry. But there doesn’t seem to be a very obvious connection right now between the genetics and the skull morphologies.”