|
|
Post by Admin on Feb 13, 2019 18:08:46 GMT
 Figure S6. No Evidence for Widespread ANC-B Ancestry in the Americas, Related to Figures 3–5 (A) Admixture graph in the same format as for Figure 2A of Scheib et al. (2018) (we left out USA_SanNicolas_1400BP (LSN in Scheib et al., 2018) from our modeling due to its known relationship with Pima, which would lead to higher maximum Z-scores of the later graphs). This graph has a maximum Z-score of 1.1 for mismatch between observed and expected f-statistics. (B-D) Admixture graphs in the same format as for A but with additional non-American populations with known relationships to American ones added as outgroups. B shows a poor fit (maximum Z-score = 4.8), likely due to lack of modeling of the “Population Y” signal. C and D have reasonable fits (maximum Z-scores = 3.4 and 3.0, respectively), but the genetic drift on the edge leading to Canada_Lucier_4800BP-500BP (ASO in Scheib et al., 2018) in all cases is not significantly different from zero when computing jackknife estimates by resampling over 100 contiguous blocks. Thus, the ancestry on the Canada_Lucier_4800BP-500BP branch that mixes into the South American groups does not share a significant amount of drift with Canada_Lucier_4800BP-500BP (see STAR Methods for more details). To fit the Anzick-1 genome associated with the Clovis culture into the admixture graph, we needed to specify additional admixture events. We identified a range of fits for the data. Figure 4 shows the result of manually exploring models guided by common sense principles (geography, time, and archaeology) as well as the genetic data. Figure 5 shows a model obtained by a semi-automated procedure constrained only by the fit to the genetic data (Lazaridis et al., 2018). The most important difference between the two models concerns the question of how the Clovis culture associated Anzick-1 genome relates to ancient Central and South Americans. Figure 4, which models the lineage leading to Anzick-1 as unadmixed, seems most plausible because it is natural to expect that the oldest individuals will be least admixed, and because it is simple to explain this model via North-to-South spreads. Figure 5 models some of the ancestry of the Clovis associated genome as deriving from within the radiation of lineages represented in South America, which if true would require a more complex history.  Figure 4. Adding in the ∼12,800 BP Anzick-1 and ∼10,900 BP Los Rieles We used Figure 3 that models all analyzed Native Americans as unadmixed as a framework graph (excluding Belize_MayahakCabPek_9300BP because of relatively low coverage). We then added in Anzick-1 and Chile_LosRieles_10900BP. This model specifies three sources of North American related ancestry in South America, indicated by color-coding (Population Y ancestry is not included but Figures S5B–S5I show related fits some of which do include it). The maximum deviation between observed and expected f-statistics is Z = 3.4 (Z = 3.0 when restricting to transversions). The inferred 2% West Eurasian admixture into Canada_Lucier_4800BP-500BP is most likely explained by contamination in these samples by people of European ancestry.  Figure 5. An Alternative Fitting Admixture Graph Obtained by a Semi-automated Method We also applied a semi-automated approach that aims to fit population relationships while minimizing the number of admixture events (STAR Methods) (Lazaridis et al., 2018). This is less plausible than Figure 4 on archaeological grounds, but it has a lower maximum Z score for the same number of admixture edges (Z = 2.9 for all sites, Z = 2.9 when restricting to transversions). Like Figure 4, this model specifies a minimum of three genetic exchanges between North and South America, indicated here by color-coding (please see Figure 4 color legend). First, both graphs imply a minimum of four genetic exchanges between South America and regions outside South America consistent with the qpWave results in the previous section. This includes: (1) a primary source of ANC-A ancestry in all South Americans; (2) an ANC-A lineage with distinct affinity to Anzick-1 in Chile_LosRieles_10900BP, Brazil_LapaDoSanto_9600BP, and some early Southern Cone populations; and (3) ANC-A ancestry with a distinctive affinity to ancient individuals from the California Channel Islands (USA_SanNicolas_4900BP) present in the Central Andes by ∼4,200 BP (Figures S5B and S5C). (4) The final spread of ancestry contributes to present-day Amazonian groups like the Surui. In Figures 4 and 5, we do not include the Surui but do show such models in Figures S5G–S5I where Surui can only be fit by proposing some ancestry differently related to Eurasians than is the case for other Native Americans (as expected if there is Population Y ancestry in the Surui). Second, both graphs specify minimal ANC-B ancestry in South Americans. While we do find significant allele sharing with a representative ANC-B population (Canada_Lucier_4800BP-500BP) in people from the Central Andes after ∼4,200 years ago—as reflected in significantly positive (2 < Z < 4) statistics of the form f4(Mbuti, Canada_Lucier_4800BP-500BP; Brazil_LapaDoSanto_9600BP or Brazil_Laranjal_6700BP, Late Central Andes or present-day Aymara and Quechua from Peru) (Tables S2 and S4)—when we fit admixture graph models specifying an ANC-B contribution to Late Central Andes groups, the ANC-B proportion is never more than 2% (Figures S5D–S5F). Third, both graphs infer little genetic drift separating the lineages leading to the different ancient groups in each major region of South America. This can be seen in our inferred five-way split whose order we cannot resolve involving lineages leading to: (1) the early Belizeans, (2) early Peruvians, (3) early Southern Cone populations, (4) the main lineage leading to Brazil_LapaDoSanto_9600BP, and (5) the lineage leading to Chile_LosRieles_10900BP (Figure S5A). This suggests rapid human radiation of the main lineage ancestral to later South Americans (Raghavan et al., 2015, Reich et al., 2012). Fourth, both graphs agree that there is distinctive shared ancestry between the Clovis culture associated Anzick-1 and the earliest South American individuals from Lapa do Santo in Brazil and Los Rieles in Chile. We also detect evidence of ancestry related to Anzick-1 in the oldest Central American genome, as the most ancient individual from Belize has evidence of more Anzick-1 relatedness than later Belize individuals as reflected in the weakly significant statistic f4(Mbuti, Anzick-1; Belize_SakiTzul_7400BP, Belize_MayahakCabPek_9300BP) (Z = 2.1). Taken together, these results support the hypothesis that an expansion of a group associated with the Clovis culture left an impact far beyond the geographic region in which this culture was spread (Fiedel, 2017). At the same time, both classes of models provide evidence against a stronger version of this hypothesis, which is that an expansion of a homogeneous population associated with the Clovis culture was the primary source of the ancestry of later Central and South Americans. Specifically, both models find that the overwhelming majority of the ancestry of most Central and South Americans derives from one or more lineages without the Anzick-1 affinities present at Lapa do Santo. Thus, a different ANC-A lineage from the one represented in Anzick-1 made the most important contribution to South Americans, and there must have been a population turnover in the mid-Holocene that largely replaced groups such as the ones represented by the ∼10,900 BP individual at Los Rieles in Chile and the ∼9,600 BP individuals at Lapa do Santo in Brazil. This genetic evidence of a major population turnover correlates with the findings from morphological studies of a population turnover in Brazil around this time (Hubbe et al., 2014). It is tempting to hypothesize that the early branching ANC-A lineages that we have shown contributed most of the ancestry of Central and South Americans today—and that harbor no specific Anzick-1 association—contributed to the people who lived at the site of Monte Verde in southern Chile and whose material artifacts have been dated to a pre-Clovis period at least ∼14,500 BP (Dillehay et al., 2008). However, because all the earliest Central and South American individuals show affinities to Anzick-1, our results could also be consistent with a scenario in which nearly all the ancestry of the South American genomes derives from population movements from North America that began no earlier than the Clovis period. In either case, we demonstrate that the non-Anzick-1 associated ancestry type began to spread in South America by at least ∼9,000 BP, the date of the oldest genomes that have no specific Anzick-1 affinity (from Cuncaicha and Lauricocha in the Central Andes). |
|
|
|
Post by Admin on Feb 14, 2019 17:43:11 GMT
All the Ancient South Americans Descend from the Same Eurasian Source Population Previous studies have suggested that present-day groups like Surui from Amazonia harbor ancestry from a source termed “Population Y” (Raghavan et al., 2015, Skoglund et al., 2015), which shared alleles at an elevated rate with Australasian groups (Onge, Papuan, and Australians) as well as the ∼40,000 BP Tianyuan individual from China (Yang et al., 2017). We tested for this signal in the ancient South American individuals with statistics of the form f4(Mbuti, Australasian; X, Mixe or ancient South American), and while we replicated the originally reported signal when X was present-day Karitiana or Surui, we could not detect a signal when X was any of the ancient South Americans (Table S6). We also studied the statistic f4(Mbuti, Tianyuan; Ancient1, Ancient2) to test if any ancient individual is differentially related to Tianyuan (Yang et al., 2017), but no statistic was significant (Table S6). We finally applied qpWave to all pairs of South American groups, testing whether they were homogeneously related to a set of diverse non-Native American outgroups (Mbuti, Han, Onge, French, and Papuan) and found no pair of ancient South Americans that consistently gave significant signals (p < 0.01), as expected if all the ancient South Americans we analyzed derived from the same stem Native American population (Table S6). Our failure to find significant evidence of Australasian or Paleolithic East Asian affinities in any of the ancient Central and South American individuals raises the question of what ancient populations could have contributed the Population Y signal in Surui and other Amazonian groups and increases the previously small chance that this signal—despite the strong statistical evidence for it—was a false-positive. A priority is to search for the Population Y signal in additional ancient genomes. Our finding of no excess allele sharing with non-Native American populations in the ancient samples is also striking as many of these individuals—including those at Lapa do Santo—have a “Paleoamerican” cranial morphology that has been suggested to be evidence of the spread of a substructured population of at least two different Native American source populations from Asia to the Americas (von Cramon-Taubadel et al., 2017). Our finding that early Holocene individuals with such a morphology are consistent with deriving all their ancestry from the same homogeneous ancestral population as other Native Americans extends the finding of Raghavan et al. (2015) who came to a similar conclusion after analyzing Native Americans inferred to have Paleoamerican morphology who lived within the last millennium.  Figure S7. Mitochondrial DNA Phylogeny, Related to Figure 3, Figure 4, Figure 5 (A) Maximum parsimony phylogenetic tree of 65 ancient mtDNA (previously published sequences are in blue font and newly reported sequences are in red font) and 230 modern mtDNA sequences (in black font) built using MEGA6 (Tamura et al., 2013). Related to Table S3. The African mtDNA L haplogroup was used to root the tree (not shown). (A) Tree portion that includes mtDNA haplogroup C1, D4h3a and D1; (B) Tree portion that includes mtDNA haplogroup A2 and B2. The mtDNA sequence of individual LagunaChica_SC50_L763 (Table S3) is not reported in this tree due to the high proportion of unassigned positions (2444Ns).
The patterns we observe on the Y chromosome also force us to revise our understanding of the origins of present-day variation. Our ancient DNA analysis shows that the Q1a2a1b-CTS1780 haplogroup, which is currently rare, was present in a third of the ancient South Americas. In addition, our observation of the currently extremely rare C2b haplogroup at Lapa do Santo disproves the suggestion that it was introduced after 6,000 BP (Roewer et al., 2013).The patterns of variation at phenotypically significant variants are also notable. Our data show that a variant in EDAR that affects tooth shape, hair follicles and thickness, sweat, and mammary gland ductal branching and that occurs at nearly 100% frequency in present day Native Americans and East Asians (Kamberov et al., 2013) was not fixed in USR1, Anzick-1, a Brazil_LapaDoSanto_9600BP individual and a Brazil_Laranjal_6700BP individual, all of whom carry the ancestral allele (Table S7). Thus, the derived allele rose in frequency in parallel in both East Asians and in Native Americans. In contrast at FADS2, one of the variants at a polymorphism (rs174570) associated with fatty acid desaturase 2 levels is derived in all the ancient individuals, supporting the hypothesis that the selective sweep that drove it to near fixation was complete prior to the peopling of the Americas (Amorim et al., 2017).  DNA analysis of Anzick provided us with his mitochondrial haplogroup, D4h3a, a known Native American group, and his Y haplogroup was Q-L54, another known Native American haplogroup,estimated to be about 16,900 years old. Most important, our discovery that the Clovis-associated Anzick-1 genome at ∼12,800 BP shares distinctive ancestry with the oldest Chilean, Brazilian, and Belizean individuals supports the hypothesis that an expansion of people who spread the Clovis culture in North America also affected Central and South America, as expected if the spread of the Fishtail Complex in Central and South America and the Clovis Complex in North America were part of the same phenomenon (direct confirmation would require ancient DNA from a Fishtail-context) (Pearson, 2017). However, the fact that the great majority of ancestry of later South Americans lacks specific affinity to Anzick-1 rules out the hypothesis of a homogeneous founding population. Thus, if Clovis-related expansions were responsible for the peopling of South America, it must have been a complex scenario involving arrival in the Americas of sub-structured lineages with and without specific Anzick-1 affinity, with the one with Anzick-1 affinity making a minimal long-term contribution. While we cannot at present determine when the non-Anzick-1 associated lineages first arrived in South America, we can place an upper bound on the date of the spread to South America of all the lineages represented in our sampled ancient genomes as all are ANC-A and thus must have diversified after the ANC-A/ANC-B split estimated to have occurred ∼17,500–14,600 BP (Moreno-Mayar et al., 2018a).  A second notable finding of this study is our evidence that the ancient individuals from the California Channel Islands have distinctive and significant allele sharing with groups that became widespread over the Central Andes after ∼4,200 BP. There is no archaeological evidence of large-scale cultural exchange between North and South America around this time, but it is important to recognize that ∼4,200 BP is a minimum date for the exchange between North and South American that drove this pattern; the gene flow itself could have occurred thousands of years before and the ancestry deriving from it could have persisted in a region of South America not yet sampled with ancient DNA. The evidence of an expansion of this ancestry type in the Central Andes by ∼4,200 BP is notable in light of the increasing density of sites in this region at approximately this time, a pattern that is consistent with a demographic expansion of a previously more restricted population (Goldberg et al., 2016). We conclude by highlighting several limitations of this study. First, all the individuals we newly report have a date less than ∼11,000 BP and thus we could not directly probe the initial movements of people into Central and South America. Second, from the period between 11,000–3,000 BP that includes most of our individuals, we lacked ancient data from Amazonia, northern South America, and the Caribbean and thus cannot determine how individuals from these regions relate to the ones we analyzed. Third, because we reported few individuals from after 3000 BP, this study provides just a glimpse of the power of this type of analysis to reveal more recent events. Regionally focused studies with large sample sizes are needed to realize the potential of ancient DNA to reveal how the human diversity of this region came to be the way it is today. Cell, Volume 175, Issue 5, 15 November 2018, Pages 1185-1197.e22 |
|
|
|
Post by Admin on Apr 29, 2019 17:41:14 GMT
 The Inca people arrived in the Cusco valley, and in a few centuries, had established the Tawantinsuyu, the largest empire in the Americas. The Tawantinsuyu was the cultural climax of 6,000 years of Central Andes civilizations overlapping modern countries of Peru, Bolivia, Ecuador, the South of Colombia and the North of Argentina and Chile. In contrast with the richness of archaeological and cultural evidence, pre-Columbian history vanishes in time as it intermingles with myths due to the lack of writing systems before the arrival of the European chroniclers. Very little is known about Inca origins, and genetic information could help reconstruct part of their history. Unfortunately, the mummies and bodily remains of the Inca emperors, worshiped as gods, were burnt and buried in unknown locations due to religious and political persecution by the Christian conquistadors and inquisitors, so there exists no direct material for DNA analysis. "Thus, for now, only the genetic analysis of modern families of Inca descent could provide some clues about their ancestors," says geneticist Jose Sandoval, first author, working at Universidad de San Martin de Porres at Lima, Peru. There were two foundational myths for the origin of the Incas before they settled in Cusco valley to build their capital city. One is that Manco Capac and Mama Ocllo, considered children of the Sun God and founder parents of the civilization, came from Lake Titicaca about 500 km southwards from the border of North Bolivia and South Peru, more or less the same region where the Tiwanaku empire existed a few centuries before. The second myth says that four Ayar brothers with divine powers came out from the caves inside of a hill in the area of Paccarictambo, 50 km south of Cusco, and only one of them, Manco, arrived to the Cusco valley. Concerning the succession of the rulers, most chroniclers mention only one patrilineal heritage; however, other authors think that succession was based on a complex selection of military and administrative skills, not necessarily by electing the son of a previous Inca. "A unique patrilineal cluster would be expected in the first case. In the second case, two or more patrilineal patterns will be evident," says geneticist Ricardo Fujita, senior author, also at Universidad de San Martin de Porres. The research team included historian Ronald Elward, who studied documentation of 12 Inca noble families and followed up from the conquista times to their contemporary descendants. "Most of them still living in the towns of San Sebastian and San Jeronimo, Cusco, Peru, at present, are probably the most homogeneous group of Inca lineage," says Elward.  Markers for Y chromosomes and mtDNA were used for the genetic analysis of these families and compared with a database for 2400 native individuals from Peru, Bolivia, Ecuador and Brazil. "The results show distinctive patrilineal origins to two founder individuals who lived between 1000 to 1500 AD, a period between the decline of former Tiwanaku (south) and Wari (north) contemporary empires, and the rise of the Inca empire a few centuries later," says geneticist Fabricio Santos from the Universidad Federal de Minas Gerais at Belo Horizonte, Brazil. The first patrilineal haplotype named AWKI-1 ("awki" means "crown prince" in the Quechua language) is found in the putative families descending from two earlier Inca, Yahuar Huacac and Viracocha. The same pattern of the Inca descendants was also found in individuals living south to Cusco, mainly in Aymaras of Peru and Bolivia. The second patrilineal haplotype, named AWKI-2, was found in one descendant of a more recent Inca, Huayna Capac, father of the two brothers (Huascar and Atahualpa) who were fighting a fraternal war over the empire at the arrival of the conquistadors. "AWKI-2 is also found in dozens of individuals from different locations in the Andes and occasionally in the Amazon, suggesting a populational expansion," says Dr. Santos. "In addition to San Sebastian and San Jeronimo, most locations of AWKI-1, AWKI-2 were southwards to Cusco including the basin of lake Titicaca and neighboring Paccarictambo, in agreement with the two foundational myths of the Inca, probably two pictures at different times of the same journey with final destination Cusco," says Ricardo Fujita. |
|
|
|
Post by Admin on Apr 30, 2019 17:45:38 GMT
Tawantinsuyu was the climax of approximately six millennia of autochthonous cultures in the Central Andes since the Norte Chico culture. The Inkas ruled Tawantinsuyu for approximately 150 years (Marsh et al. 2017) until the arrival of the Europeans in 1531. The first tribal settlement of the Inkas in the Cusco valley in Peru probably dated to the twelfth century, and their empire expanded to a territory of approximately 1,800,000 km2 with the largest political system of pre-Columbian Americas. According to a genetic study (Sandoval et al. 2013a), the current population of the Central Andes represents the highest proportion of Native American ancestry, and most Andeans are probably direct descendants of the Tawantinsuyu people. Furthermore, other studies have ratified the cultural and genetic homogeneity among Andean populations in contrast to the highly heterogeneous eastern lowland Amazonian populations (Tarazona-Santos et al. 2001; Sandoval et al. 2016). These and other genetic studies (Llamas et al. 2016; Jota et al. 2016) have shown significant advances in recovering the Native American history; however, no study has focused on the descent of the royal Inka family. Due to the haploid mode of inheritance, the Y-chromosome and mitochondrial (mt) DNA markers are widely used in reconstructing the genealogical history of populations. Genetic analysis of autochthonous Y-chromosome markers shows most South American populations with haplogroup Q (characterised by different sub-lineages) and other rare haplogroups, such as C-M217 (Jota et al. 2016). Simultaneous analysis of Y-chromosome single-nucleotide polymorphisms (Y-SNPs), which define a haplogroup or sub-lineage, and short tandem repeats (Y-STRs), which are used for paternal testing, familial genealogy and kinship identification, have allowed for the discrimination between sub-lineages among South American natives (Jota et al. 2011, 2016). Using multiple genotyping approaches, we identified informative SNPs exhibiting restricted Q haplogroup sub-lineages in South American populations (Jota et al. 2016). For example, the Q-Z19483 sub-lineage is associated with population movements of the Late Intermediate Period, as it is distributed in Central Andes, including the Altiplano region, and probably connected with the Inka expansion. 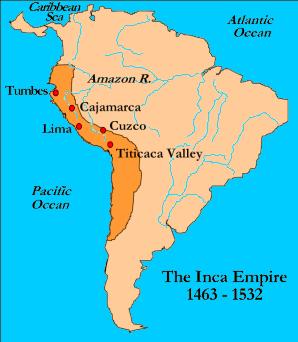 With respect to matrilineal inheritance, South American natives exhibit mainly four mtDNA haplogroups (A2, B2, C1 and D1), which comprise several sub-lineages and minor haplogroups, such as D4h3a (Brandini et al. 2017). The coalescence times for each Native American mtDNA haplogroup are estimated between 14 and 20 kya (Llamas et al. 2016; Brandini et al. 2017; Barbieri et al. 2017), suggesting that the first human settlers arrived in Americas by the end of the Pleistocene (Moreno-Mayar et al. 2018). Furthermore, comparisons of mtDNA haplogroup frequencies between ancient and modern South American populations show distinct regional patterns (Fehren-Schmitz et al. 2015; Barbieri et al. 2017). However, a general continuity in northern, central and southern parts of South America is apparent, with the North and Central Andes displaying high intra-population and low inter-population diversities with a high prevalence of haplogroup B2 due to greater effective population size and continuous gene flow (Valverde et al. 2016; Brandini et al. 2017). Coincidentally, the high prevalence area of the B2 lineage corresponds to the Tawantinsuyu region. Information on lineages of the Inka nobility and rulers of Tawantinsuyu and their ancestral origins is limited to data gathered by the Spanish chroniclers, anthropologists and modern historians and becomes more uncertain and surrounded by myths as we go further back in time (Gamboa 1572; de la Vega 1609; Cobo 1653; Bauer 1991; Espinoza-Soriano 1997). Although the origins of the Inka family before their settlement in Cusco are still unknown, there are two major legends: (1) an older myth that the Inka ancestors originated from a cave in the district of Pacarictampu in the Province of Paruro, 50 km south of Cusco and (2) an imperial tale that the ancestors originated alongside the Sun at the Isla del Sol on the Bolivian side of Lake Titicaca at 380 km southeast of Cusco (Urton 2004). For many scholars, these alternative origin places are not contradictory and represent successive settlements of the original migration of the Inka ancestors (Espinoza-Soriano 1997; Bauer and Covey 2002; Cerrón-Palomino 2013). While historical data have been published on families of putative Inka descendants (Amado-Gonzales 2009; Dunbar-Temple 2009), this information is available only for the colonial period until 1824. To identify the present-day patrilineal descendants of the Inka rulers, it is necessary to identify families that were recognised as Inka descendants before 1824 and to reconstruct family genealogies till date. At the start of the colonial period, the putative descendants of Inka rulers were recognised as nobles with rights, were not required to pay tributes and were exempt from forced labour. After the rebellion of Tupac Amaru II when the colonial government implemented political changes related to the native nobility, it became important to again prove noble ancestry. Several documents are available during the period 1780–1824 that not only identify noble families, but also contain data on ancestors and lineages. The complex society of the pre-Columbian Central Andes is based on ‘ayllu’, a kinship system of families and clans that shared the same land and labour division for several generations (Espinoza-Soriano 1997). During the Inka Empire, new ayllus were founded by different rulers for political and administrative management of Tawantinsuyu, as well as for worship in the afterlife for coming generations. Pachacutec, the first Inka Emperor, was responsible for reorganising the state and imperial family. Ten imperial ayllus, or groups of rulers’ descendants, were distributed into two groups: five for lower (hurin) Cusco from former Manco Capac till Capac Yupanqui and five for higher (hanan) Cusco from Inka Roca till Tupac Yupanqui, the son and successor of Pachacutec (Rostworowski 2001; Zuidema 2007). During the Spanish rule around 1570, Viceroy Francisco de Toledo again reorganised the imperial descendants in Houses, and the Pachacutec ayllu was split into two (Supplemental Table 1) (Gamboa 1572; Rostworowski 2001; Amado-Gonzales 2003). By 1572, the descendants of the Inka royal family had properties assigned by the Spanish crown in six so-called parishes of ‘Indians’ around Cusco: Belén, Hospital de Naturales, San Blas, San Cristobal, San Sebastian and San Jerónimo. The parishes of Santiago and  Ana were reserved for other groups (Gamboa 1572). During colonial times, uninterrupted written records of the noble Inka descendants (known as Panakas) could be found on census, municipal, parochial and legal registers until 1824 (Amado-Gonzales 2003). With the formation of the Peruvian Republic, privileges were abolished and these descendants were no longer a separate group. Other Inka descendants were also registered in the Lake Titicaca Basin, including Azángaro, Capachica and Copacabana, on the Peruvian and Bolivian sides of Lake Titicaca (de León 1553; Espinoza-Soriano 1972). A few families have been traced during the colonial period (Amado-Gonzales 2003, 2005, 2009; Dunbar-Temple 2009); these may be used as subjects of research in the absence of mummies of the Inka rulers. Most mummies were probably destroyed by Corregidor Polo de Ondegardo in the late sixteenth century (Deza and Barrera 2001), whereas five that were displayed in the Hospital de San Andrés, Lima, disappeared in the first half of the seventeenth century. Moreover, no evidence has been recovered from the Convent of Santo Domingo in Cusco where the remains of the Inkas of Vilcabamba were buried. With the complete absence of genetic material of former rulers, present-day Panakas families are the only DNA source that could help gain insight into the origin of the Inka rulers. |
|
|
|
Post by Admin on May 1, 2019 17:42:20 GMT
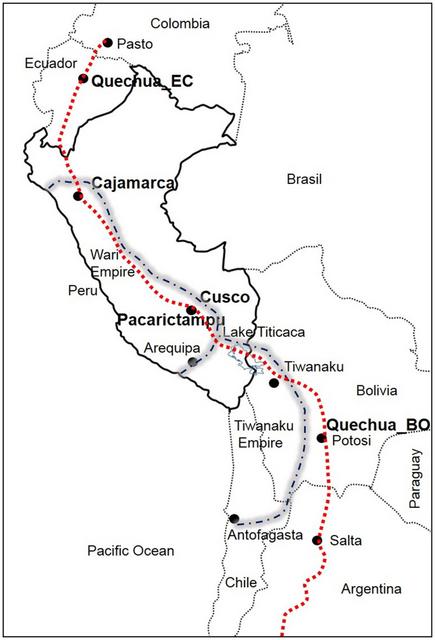 Fig. 1 Map showing the reference locations of samples investigated in this study. Dashed lines that cross from Pasto to Peru, Bolivia and Argentina indicate a part of the ‘backbone’ of Qhapaq Ñan (Great Inka Road). Dashed and dotted lines show the geographical extension of the Wari and Tiwanaku Empires Y-chromosome results Y-STR genealogy delineates a complex structure into two clusters of patrilineal inheritance among Panakas families For comparison, we included approximately 1200 samples from the South American Genographic Database and from previously published studies; however, for clarity, we selected 282 individuals with 184 Y-STR haplotypes of the Q haplogroup phylogenetically related to the Panakas. Other haplotypes belonging to non-Q haplogroups (R, E, I and T) were not considered, as they represent Eurasian lineages and were probably identified due to post-Columbian admixture. The Y-STR haplotypes identified among the San Sebastian–San Jerónimo (SsSj; n = 28) and Pacarictampu (n = 12) populations are listed in Supplemental Table 3 (49 individuals in Supplemental Table 3a and 282 individuals in Supplemental Table 3b). The haplotype distribution of Y-STRs of the Panakas in the network indicated a high genetic differentiation among them (Fig. 2). However, two majoritarian clusters, AWKI-1 and AWKI-2, and several scattered Y chromosomes were observed, precluding the presence of a unique or more frequent patrilineal pattern. 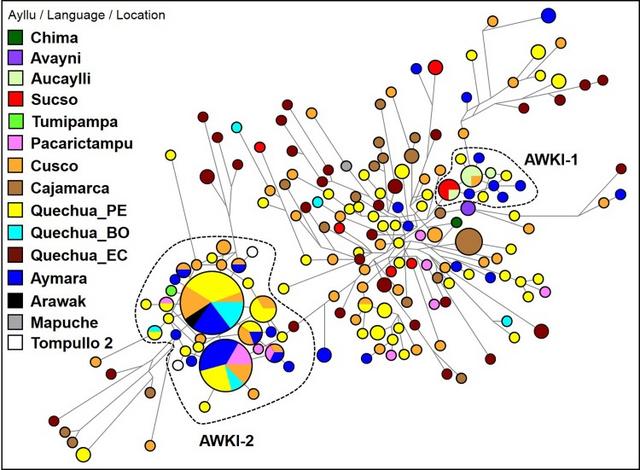 Fig. 2 Median-joining network for Q-M3* Y-STR haplotypes among selected individuals (n = 282) from different populations. Different population groups (Ayllu/Language/Location) are indicated using distinct colours. Haplotypes composed of alleles on 15 Y-STRs are represented with circles; the size of the circle is proportional to the number of individuals, and the branch length is proportional to STR mutation steps (one-step unit between haplotypes in the AWKI-1 clan). The AWKI-1 and AWKI-2 clusters are identified as Q-M3 and Q-Z19483 lineages, respectively. Population groups: Chima, Avayni, Aucaylli, Sucso and Tumipampa are ayllus from San Sebastian and San Jerónimo; Peruvian Quechuas (Quechua_PE); Bolivian Quechuas (Quechua_BO); Ecuadorian Quechuas (Quechua_EC); and Argentinian Mapuche (Mapuche). Sample codes are listed in Supplemental Table 3a Out of 18 genotyped individuals of 12 Panakas families, 8 individuals from 5 different families showed the closest Y-STR haplotypes to each other (AWKI-1 cluster). Among these eight individuals, individuals from the ayllu Sucso (K3, K11 and K12; n = 3) and an individual from ayllu Aucaylli (K22) shared a haplotype, which was related by a one-step mutation to individuals from the ayllu Aucaylli (K9, K37, K40; n = 3) that shared another Y-STR haplotype with an individual (Q_Cus03) from Maras District, Urubamba. Additionally, individual K36 was closely related by a one-step mutation to members of the corresponding ayllu Aucaylli (Fig. 2). On the contrary, two individuals (K35 and K41) from ayllu Avayni shared the same haplotypes and were related to Sucso–Aucaylli families, despite some step mutations. The other families were characterised by unrelated haplotypes and were not included in the AWKI-1 cluster. Among these unrelated haplotypes, two individuals from ayllu Sucso (K6 and K38) shared the same haplotypes. At the opposite side of the phylogenetic tree was the AWKI-2 cluster, which included one individual (K34) from the ayllu Tumipampa of the Panaka family that was connected by a one-step mutation to the most frequent haplotype in the Andes (code = 140; Supplemental Table 3b). A total of 32 individuals from different Andean locations, including San Sebastian–San Jerónimo, Aymara- and Quechua-speaking individuals from the Altiplano region (Peru–Bolivia) and other localities of the Cusco region, Arequipa, Junín, Apurimac and Amazonian Machiguengas shared this haplotype. Additionally, this common haplotype was connected by a one-step mutation with another haplotype (code = 141, Supplemental Table 3b) that was shared by 24 individuals from the same regions mentioned above, except Apurimac. Furthermore, two haplotypes (T2CH13 and T2CH81) of ancient DNA samples from the Tompullo 2 site (Inka, 1500 AD) of the Arequipa region (Baca et al. 2012) were connected by a two-step mutation to the cluster AWKI-2 (T2CH13 to K2, T2CH81 to K18). A similar genetic profile for the Y-STRs among all individuals from San Sebastian, San Jerónimo and Pacarictampu (n = 49) was obtained using PCA (Supplemental Fig. 1). |
|


 Ana were reserved for other groups (Gamboa 1572). During colonial times, uninterrupted written records of the noble Inka descendants (known as Panakas) could be found on census, municipal, parochial and legal registers until 1824 (Amado-Gonzales 2003). With the formation of the Peruvian Republic, privileges were abolished and these descendants were no longer a separate group. Other Inka descendants were also registered in the Lake Titicaca Basin, including Azángaro, Capachica and Copacabana, on the Peruvian and Bolivian sides of Lake Titicaca (de León 1553; Espinoza-Soriano 1972). A few families have been traced during the colonial period (Amado-Gonzales 2003, 2005, 2009; Dunbar-Temple 2009); these may be used as subjects of research in the absence of mummies of the Inka rulers. Most mummies were probably destroyed by Corregidor Polo de Ondegardo in the late sixteenth century (Deza and Barrera 2001), whereas five that were displayed in the Hospital de San Andrés, Lima, disappeared in the first half of the seventeenth century. Moreover, no evidence has been recovered from the Convent of Santo Domingo in Cusco where the remains of the Inkas of Vilcabamba were buried. With the complete absence of genetic material of former rulers, present-day Panakas families are the only DNA source that could help gain insight into the origin of the Inka rulers.