|
|
Post by Admin on Oct 28, 2019 21:07:37 GMT
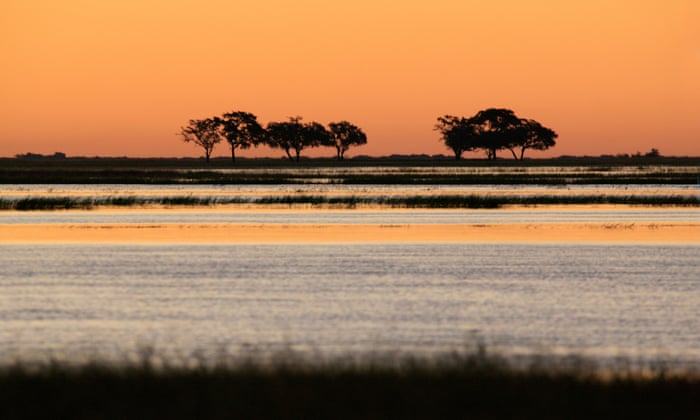 Anyone lucky enough to have visited the Okavango Delta in the southern African nation of Botswana will recall the comforting and oddly familiar sensation of looking out from the shelter of a stand of trees at the panorama of wildlife—from elephants and African wild dogs to lilac-breasted rollers—moving across the lush surrounding floodplains. That sense of familiarity may run deeper than we imagine, a new study suggests—back to a time when early modern humans also wandered there. The study, appearing Monday in the journal Nature, uses genetic, archaeological, linguistic and climatic evidence to argue that the ancestral homeland of everyone alive today was in northern Botswana—not in East Africa, as previously thought. Based on mitochondrial DNA, passed down from mother to daughter, the paper’s co-authors argue that we are all descended from a small community of Khoisan hunter-gatherers who lived 200,000 years ago in vast wetlands encompassing Botswana’s Okavango Delta and the Makgadikgadi regions. 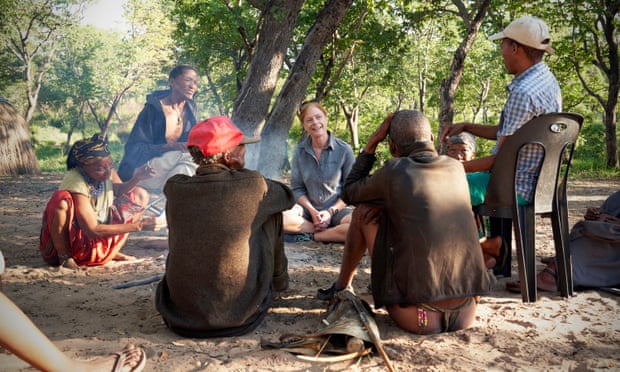 Much of that place is now a dry salt pan—and inhabited by modern Khoisan people, sometimes called Bushmen. But back then, it was a vast wetland covering an area the size of Switzerland. The community that lived there was unusually stable, thriving almost unchanged for 70,000 years in a habitat closely resembling the modern Okavango Delta, according to senior author Vanessa M. Hayes, a geneticist at the Garvan Institute of Medical Research in Australia. The new study looks at the mitogenomes, or mitochondrial genomes, of 1,217 individuals from multiple southern African ethnic identities, and focuses on a “rare deep-rooting” lineage called L0, or L zero. It’s the oldest known mitochondrial lineage, passed down intact from mother to daughter across the generations, though mutations can sometimes occur and may be associated with important evolutionary changes. Hayes became interested in that lineage as a result of her work with the South African Genome Project, which found evidence of L0 ancestry distributed across southern Africa. Archbishop Emeritus Desmond Tutu, descended mainly from Bantu groups who migrated into southern Africa 1,500 years ago, was among those identified as having Khoisan ancestry, a connection he said left him feeling “very privileged and blessed." 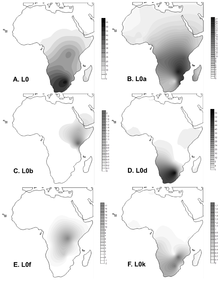 Tracking the accumulation of mutations in the L0 lineage across the eons provides geneticists with a time stamp for evolutionary changes. The co-authors of the Nature paper identify and date changes in the L0 lineage. They also correlate these “branching” events with evidence of climatic shifts, as well as with archaeological evidence of human migrations. During the initial 70,000 years of stable habitation, says co-author Axel Timmermann, a climate scientist at Pusan National University in South Korea, migration was probably constrained by harsh, dry conditions in the surrounding landscape. But about 130,000 years ago, a period of increased rainfall opened a green corridor for migrations to the northeast. Then, about 110,000 years ago, drying conditions within the homeland and opening of a green corridor to the southwest led to further migrations down to the southern tip of Africa. Evidence of both events survives, according to the study, in subgroups of the L0 lineage found in living descendants of those migrations. The new research fits with other recent genetic evidence of human origin in southern Africa, including a study earlier this year suggesting that a migration from that region to East Africa, and the resulting mixture with populations there, might have been a key turning point in the evolution of modern humans and their migration out of Africa. Another paper this year also argues that a migration from southern Africa to East Africa immediately preceded a major out-of-Africa migration 100,000 to 70,000 years ago. The alternative pan-African, or “polycentric,” viewpoint holds that multiple interlinked populations evolved across the continent, sometimes in isolation and sometimes together.  James Cole, an archaeologist at the University of Brighton in England, who was not involved in the new study, praises Hayes and her colleagues for their cross-disciplinary approach to understanding mitochondrial evolution. But he also notes that their paper overlooks major archaeological evidence, such as the 315,000-year-old skeletal remains of an anatomically modern human recently found in Morocco. Hayes replies that her study focuses only on the population of direct ancestors of “people walking around today,” and in the absence of genetic evidence from the Morocco specimens, the connection to living humans is unknown. Milford Wolpoff, a paleoanthropologist at the University of Michigan who also was not involved in the new work, similarly argues that the evidence its authors present is too narrow. Reliance solely on mitochondrial evidence leads to misinterpretation, he says, and risks overlooking important evolutionary information in the separate DNA of the cell nucleus. Our widespread inheritance of Neandertal genes shows up, for instance, only in the nuclear DNA, and it is completely absent from the mitogenome. Likewise, Wolpoff says, “the nuclear genome, with three billion base pairs, might tell an entirely different story about the African origin of modern humans from what the mitogenome’s 16,000 base pairs” suggest.  “We’re dealing with a puzzle of a million pieces,” Cole says, “and we’ve probably got the first 100 in place.” Paleogenetics has “ramped up the scale of complexity exponentially,” he adds. “From the paleontological and archeological record, it was a 1,000-piece puzzle.” But instead of providing a grand answer to the story of human origin, Cole suggests, so far, genetics is mainly showing us just how complex that story really is. According to the DNA analyses, the L0 lineage split 130,000 years ago when some of the founder population moved north-east along a green vegetated route that opened up as rains drenched the arid land. A second wave of migration headed south-west about 20,000 years later as rainfall also increased vegetation in that direction. Those who headed north-east gave rise to farming populations, while those who went south became coastal foragers, the scientists believe. “Essentially, these ancestors were the first human explorers,” Hayes said. |
|
|
|
Post by Admin on Oct 29, 2019 18:02:50 GMT
By studying the genomes of more than 1,200 indigenous Africans living in the southern part of the continent today, the team pieced together a history of one of the oldest DNA lineages on Earth: a collection of genes called L0, which is passed down maternally through mitochondria and has survived remarkably unchanged in some populations for hundreds of thousands of years. By tracking where and when the L0 lineage first split into the slightly different sublineages still seen in some indigenous African populations today, the researchers believe they have pinpointed precisely where the first carriers of L0 lived and thrived for thousands of years. "We've known for a long time that humans originated in Africa and roughly 200,000 years ago," study author Vanessa Hayes, a geneticist at the Garvan Institute of Medical Research and University of Sydney, both in Australia, said in a news conference. "But what we hadn't known until this study was where, exactly this homeland was." The L0 lineage is a sequence of DNA encoded solely in mitochondria, a small structure in your cells that turns food into cellular energy. 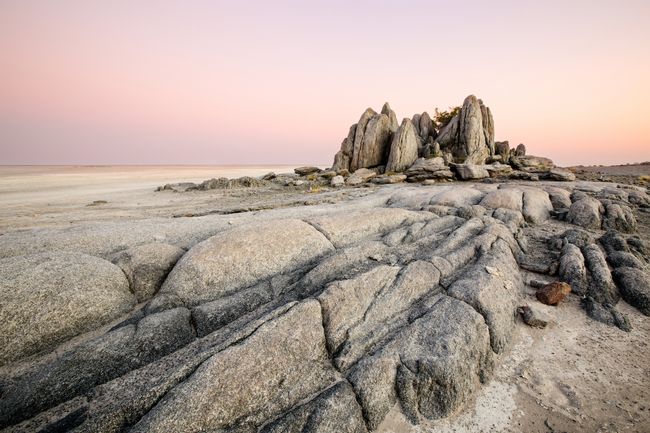 Mitochondrial DNA accounts for just a fraction of your genome, with the bulk of your DNA locked away in cell nuclei. However, while nuclear DNA is inherited from both parents and recombines with every generation, mitochondrial DNA is inherited solely from your mother and can remain unchanged for tens of thousands of years. As such, mitochondrial DNA (also known as the "mitogenome") is a key tool for tracking genetic history. L0 is especially important in that regard, as all living people are believed to descend on their maternal line from the woman who first carried the sequence, a hypothetical woman called "mitochondrial Eve." Today, the L0 lineage is found most commonly in the Khoisan people, two indigenous groups living in southern Africa. Numerous other groups of indigenous Africans carry mitochondrial DNA that descends from this lineage, but with subtle variations. By comparing those variations from group to group, geneticists can piece together a general timeline of when these ancient genetic lineages diverged. 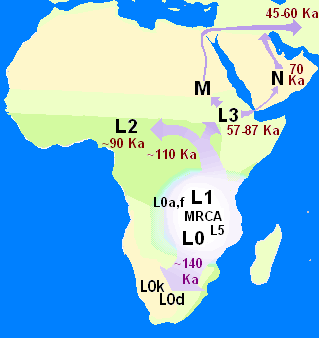 In the new study, the researchers sequenced about 200 L0 mitogenomes in indigenous people living around southern Africa. When compared to a database of more than 1,000 existing L0 sequences, the dataset created one of the most comprehensive snapshots ever taken of how the ancient lineage and its closest offshoots are dispersed around southern Africa today. This distribution data allowed the team to estimate where and when mitochondrial Eve's descendants first split into separate, genetically distinct groups. This homeland, the researchers suggested, is Makgadikgadi, a vast wetland some 46,000 square miles (120,000 square kilometers) in area, or roughly twice the area of Lake Victoria, Africa's largest lake today. The team found that mitochondrial Eve and her descendants lived in this region for about 30,000 years (from 200,000 to 170,000 years ago) before the L0 lineage split into its first subgroup. 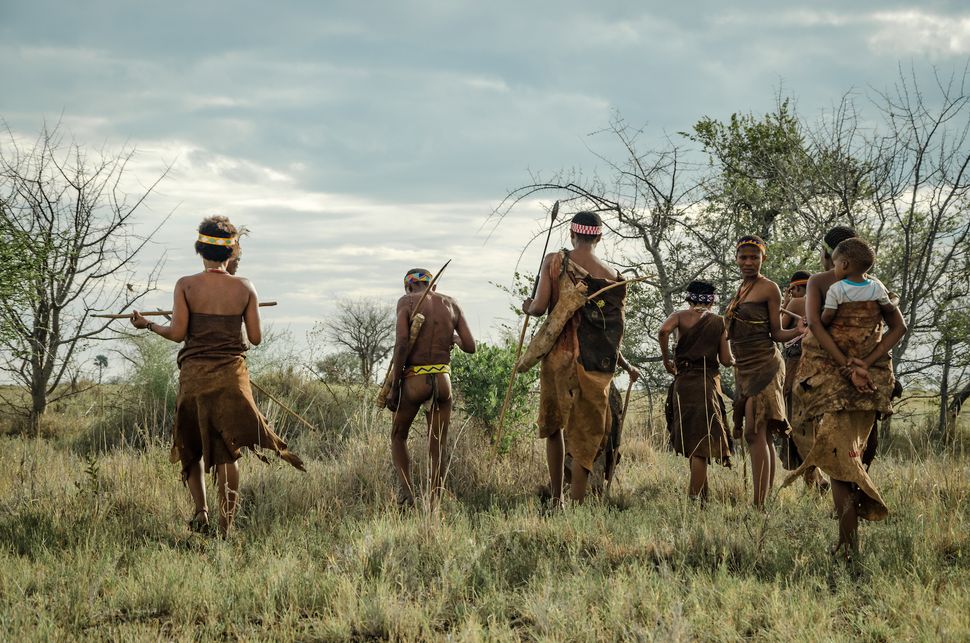 The green path Using climate models and sediment-core samples from the area, the team found that, from roughly 130,000 to 110,000 years ago, changing rainfall patterns opened up several "green corridors" of habitable land in the desert around Makgadikgadi. Corridors to the northwest and southeast of the wetland could have drawn migrants in those directions, leading them toward the areas where different indigenous groups still live today, the researchers wrote. This movement could adequately explain the distribution of L0 subgroups around southern Africa. What it does not explain, however, is the other half of our genetic lineage (the male half). According to Stringer, there's not a lot of evidence that our earliest male ancestors walked a path like the one described here. "Looking at the male-inherited Y chromosome, the most-divergent lineages currently known in extant humans are found in west Africa, not south Africa, suggesting our Y-chromosome ancestors may have originated from there," Stringer said. The authors of the study do acknowledge that modern humans may have had multiple "homelands" where different genetic lineages took root; L0 is simply the best-preserved lineage, thanks to its strictly maternal provenance. So, while researchers may now be closer to pinpointing the little Eden where mitochondrial Eve started her family, it's still too early to say we've all found our homeland. |
|
|
|
Post by Admin on Oct 30, 2019 18:25:50 GMT
Southern Africa has long been considered to be one of the regions in which anatomically modern humans (AMHs) originated. Home to contemporary populations who represent the earliest human lineages, evolutionary time estimates have largely been based on mitochondrial DNA (mitogenomes)1,6. The maternal human phylogenetic tree consists of two major branches, the extensive L1’6—which includes the out-of-Africa ancestral L3 sub-branch (or haplogroup)—and the rare deep-rooting L0. The L0 lineage is predominated by southern African haplogroups: L0d, L0k and the recently described L0g6. By contrast, the rare L0f and common L0a lineages are dispersed throughout sub-Saharan Africa1,3,6. Through L0 pre-screening, we identified 198 southern Africans with poorly represented haplogroups for whom the mitogenome was sequenced (Supplementary Table 1), allowing for a combined analysis of 1,217 mitogenomes (Fig. 1a and Extended Data Table 1). 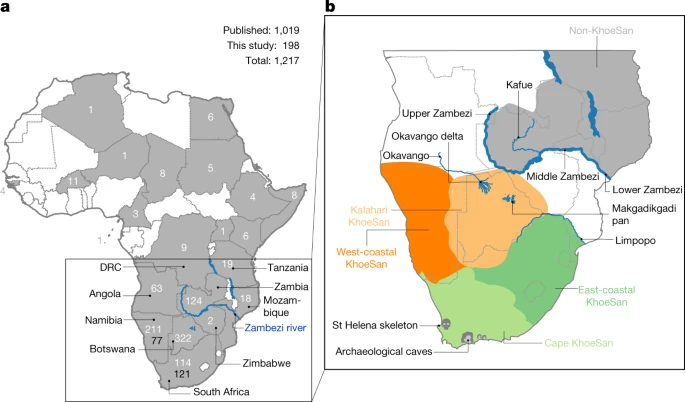 Fig. 1: Geographical distribution of 1,217 L0 mitogenomes. We ethno-linguistically classified study participants as KhoeSan—southern African populations who traditionally practiced foraging and spoke languages containing ‘click’ consonants—or non-KhoeSan individuals. Non-KhoeSan who have KhoeSan-derived L0 mitogenomes are referred to in this study as KhoeSan ancestral, with further geographical classification (Fig. 1b and Extended Data Table 2; terminology pertaining to southern African KhoeSan populations is complex and contentious, see Methods for further discussion). Contemporary KhoeSan include Kalahari KhoeSan (Kx’a, Tuu and central Khoe–Kwadi speakers) and west-coastal KhoeSan (Khoe–Kwadi Nama speakers)11. Peoples who speak Southern Bantu languages, who migrated down the east coast of Africa around 1,500 years ago, may have acquired an east-coastal KhoeSan heritage12. The arrival of European colonists to the Cape in mid-1600s gave rise to the South African Coloured and Namibian Baster populations (of Eurasian and indigenous descent), who acquired a Cape KhoeSan heritage13. Excluding the east African Sandawe and Hadza (whose languages also contain click consonants), indigenous KhoeSan populations appear to be absent northeast of the Zambezi river, supported by the lack of skeletal remains representing the KhoeSan-like hunter–forager morphology14. We classified the 198 new mitogenomes as Kalahari (n = 18), west-coastal (n = 21), Cape (n = 109) and east-coastal (n = 29) KhoeSan, or non-KhoeSan (Bantu, n = 19), although two mitogenomes were classed as unknown. Using these identifiers, we provide a best-fit classification for all 1,217 L0 mitogenomes (Supplementary Table 2). Phylogenetic analysis confirms the major L0 haplogroups, with the exclusion of L0b (Extended Data Fig. 1). Using a subset of 461 mitogenomes, including all of the rare lineages, we establish the coalescence times within the L0 lineage (Fig. 2a and Supplementary Table 3) and use the complete dataset to reconstruct geographical dispersals (Fig. 2b). We redefine the emergence of the L0 lineage to 50–25 thousand years (kyr) before previous estimates1,6, around 200 ka (95% confidence interval, 240–165 ka). L0d’k (n = 309; coalesced around 187 ka (the number of mitogenomes and the coalescence time are provided for each lineage)) is largely KhoeSan-specific, emerging approximately 20 kyr before the widely dispersed L0a’b’f’g sister branch (n = 152; around 164 ka). Although the exact branch resolution for L0k remains undetermined, we observe a preference for L0d’k (posterior probability of approximately 0.6) over L0a’b’f’g’k (posterior probability of about 0.4). Irrespective of this, the L0k (n = 113) lineage appears to remain stable for around 130 kyr before diverging into the Kalahari-specific L0k1 lineage, which is predominated by L0k1a (85 out of 94), and rarer L0k1b and L0k2 lineages distributed around the Zambezi river (Extended Data Fig. 2a). The L0d lineage remains stable for almost 60 kyr before splitting into the KhoeSan-specific L0d1’2 and rarer L0d3 lineages. 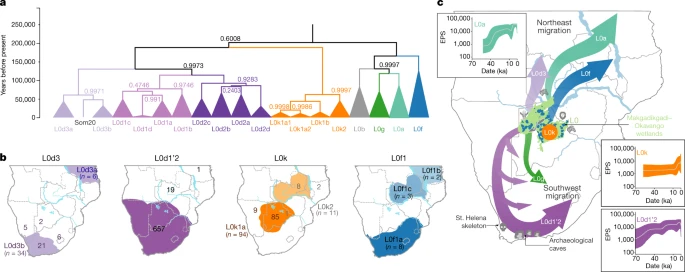 Fig. 2: L0 phylogenetic tree, geographical distributions of the major southern African L0 haplogroup and out-of-homeland L0 dispersal routes. Coalescing around 113 ka, L0d2 (n = 226) emerges approximately 15 kyr before L0d1 (n = 452). Within L0d2 (emerging about 91 ka), L0d2c diverged the earliest (n = 53; around 84 ka) with a broad and almost even KhoeSan-regional distribution (Extended Data Fig. 3 and Supplementary Table 4). In 2014, we derived an ancient L0d2c1c mitogenome from a sample of the skeleton of an approximately 2,330-year-old Cape-coastal marine forager (St Helena (StHe)/UCT606)15. Predating archaeological evidence for sheep herding in the region12,16, we proposed that this L0d2c sub-clade represented a pre-pastoral indigenous southern African lineage. Recently, whole-genome sequencing confirmed a unique southern African heritage, whereas two younger (less than 2 kyr old) Cape skeletons showed a genetic link to eastern Africa and the associated pastoralist migration17. Previously, an overrepresentation of the L0d2b (28 out of 44; around 65 ka) and L0d2a (62 out of 118; around 60 ka) lineages within the Kalahari KhoeSan has been observed; however, by doubling the contribution of the L0d2d (6 out of 11) lineage, we show a broad southern African distribution (Extended Data Fig. 3 and Supplementary Tables 5, 6). While L0d1 is also spread throughout the KhoeSan-regional identifier, we show notable overrepresentation of the L0d1b (104 out of 174; about 69 ka) and L0d1c (151 out of 184; approximately 59 ka) lineages within the Kalahari and of the L0d1a (32 out of 91; around 44 ka) lineage within the Cape (Extended Data Fig. 4). We contribute two new KhoeSan-ancestral L0d1d mitogenomes to the single published mitogenome6. In contrast to L01’2, the L0d3 lineage is not specific to southern Africa. Although L0d3b (around 30 ka) appears to be KhoeSan-specific, the rarer L0d3a (about 42 ka) lineage is exclusively found north of the Zambezi river. Notably, three out of six L0d3a mitogenomes were derived from east African Sandawe individuals. Our data support previous studies that have suggested a genetic link between east Africa and the earliest southern Africans17, who last shared a common ancestor around 59 ka. By adding a large number of mitogenomes (27 out of 40) to the L0d3 lineage, we observe overrepresentation of L0d3b in the Cape KhoeSan identifier (21 out of 34) (Extended Data Fig. 2b and Supplementary Table 7). Using a previously reported identifier that distinguishes maternal KhoeSan ancestry for the Coloured and Baster populations13, we show that the L0d3b lineage is specific to the Coloured population, whereas the new L0d2b1a2a sub-clade is specific to the Baster population (Extended Data Fig. 3b). Within the L0a’b’f’g lineage, L0f is highly divergent (emerging around 125 ka; 95% confidence interval,149–101 ka). By including a further five L0f mitogenomes, we were able to show that L0f1 (13 out of 27; around 113 ka) predominates south and L0f2’3 (14 out of 27; about 121 ka) north of the Zambezi river (Extended Data Fig. 2c and Supplementary Table 8). Within L0f1, we recognize three new branches: the northeast sister clades L0f1c (Zambian) and L0f1b (Tanzanian), and the South African clade L0f1a (n = 8). Lack of L0f representation within contemporary KhoeSan suggests that the presence of L0f1a within South Africa is probably a result of more recent east-coastal agropastoral back-migration. While the L0a’g lineages coalesce around 117 ka (95% confidence interval, 145–94 ka), contributing 19 southern African to 347 L0a mitogenomes, we concur that the L0a lineage probably diverged northeast of the Zambezi river (around 85 ka) and spread throughout Africa3; the southern representation of the L0a1b and L0a2a lineages are probably a result of a Bantu back-migration (Extended Data Fig. 5). First described in a Kx’a-speaking hunter-gatherer6, we now contribute three additional and reclassify five published mitogenomes as L0g (Extended Data Fig. 2d and Supplementary Table 9). As the L0g lineage has a broad KhoeSan and KhoeSan-ancestral distribution, we hypothesize that this lineage diverged southwest of the Zambezi river (around 69 ka), similar to the L0d1’2 lineage. Our results suggest that the greater Zambezi river basin, particularly the Kalahari region, had a critical role in shaping the emergence and prehistory of AMHs. Now a semi-desert, this region consists of salt pans within northern Botswana that represent desiccated vestiges of palaeo-lake Makgadikgadi, which at its peak in the early Pleistocene would have been the largest lake in Africa7,18. Contraction of the Makgadikgadi palaeo-lake during the Middle Pleistocene was accompanied by development of the Okavango delta as a result of neotectonic rifting, which—together with smaller lakes from the upper Zambezi to the Kafue rivers—would have created a vast residual wetland favourable for habitation by humans and mammals more broadly19 (Fig. 2c). Today, the harsh Kalahari climate and oxygen-rich salt pans are not ideal for fossil and pollen preservation, respectively. However, period-relevant lithic artefacts are documented from the Makgadikgadi pans and surroundings7,20,21, while palynology suggests that this region was once a grassland and forest biome22. Our data further suggest that the Makgadikgadi–Okavango palaeo-wetland sustained the existence of AMHs for around 70 kyr, supported by mitochondrial data of ancestral giraffe, lion and zebra23,24,25, before out-of-homeland migrations split the founder homeland populations of the L0d, L0f and L0a’g lineages. Southwest of their homeland, the L0d1’2 lineage experienced episodic splits and showed a broad south-coastal occupation of the emerged sub-populations, whereas the ancestors of the L0g lineage were less successful. Bayesian skyline plot (BSP) (Fig. 2c) analysis confirms effective population growth for the L0d1’2 lineage (BSP L0d1’2), whereas extensive archaeological evidence indicates cognitively modern human behaviour at the southern tip of Africa8,9,10 between approximately 100 and 60 ka, together with an associated increase in the density of time-appropriate archaeological sites in coastal compared to inland regions26. Northeast of their homeland, the L0d3 and L0f lineages are less successful, whereas the L0a lineage underwent considerable diversification, which post-dates the out-of-Africa migration (BSP L0a; Fig. 2c). The northeast migration route is further supported by the appearance of data-appropriate archaeological sites26. Within their homeland, the population carrying the L0k lineage sustained a constant effective population size (BSP L0k), as did the Kalahari-predominant L0d2b, L0d2a and L0d1c lineages. Although the presence of L0k in Zambia has been suggested to represent contact with an ancient pre-Bantu population27, we propose that these rare lineages represent an ancient out-of-homeland branch of the ancestral KhoeSan population. |
|
|
|
Post by Admin on Oct 31, 2019 18:35:21 GMT
Orbitally driven large-scale hydroclimate variations have been proposed as a contributor of early human migrations28,29. In some studies, wetter conditions and resulting ‘green corridors’ have been proposed to explain the out-of-Africa migration (a ‘pull’ scenario), whereas others have proposed that drier conditions and resulting food shortages forced dispersals (a ‘push’ scenario)30. To determine whether our predicted homeland isolation and major dispersals may have been driven by climate shifts, we analysed four key palaeo-hydroclimate datasets29,31,32,33, along with a transient 784-kyr-long glacial–interglacial simulation conducted with the LOVECLIM Earth system model28 (Fig. 3). Although limited by available palaeo-proxy records and a climate model of intermediate complexity, we observe a considerable degree of coherence on orbital timescales (Extended Data Fig. 6). During the homeland period (200–130 ka), palaeo-data link the 21-kyr-long precession cycle, which arises from a combination of Earth’s axis wobble and a slow rotation of Earth’s entire orbit around the Sun (Fig. 3a), with three wet–dry cycles (Fig. 3b). By contrast, the climate model simulates an extended drought, owing to a more pronounced eccentricity signal (Fig. 3e), suggestive of a wetland oasis in an otherwise vast harsh environment. 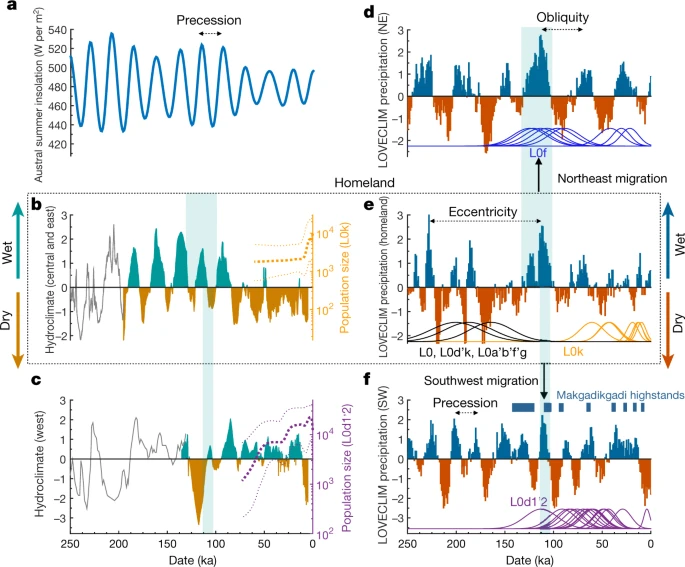 Fig. 3: Reconstructed and simulated climatic conditions during the out-of-homeland migration. During the out-of-homeland period (130–110 ka), our model simulation supports humid conditions to the northeast that facilitated the first dispersals, concurring with L0f coalescence (around 125 ka) (Fig. 3d). By contrast, the region southwest of the homeland experienced an approximately 15-kyr-long megadrought before an orbital shift created the favourable humid conditions that led to the dispersal of the L0d1’2 lineage (around 113 ka) (Fig. 3f), which is also supported by palaeo-data (Fig. 3c). This is also around the time the northeast L0a and southwest L0g migrants last share a common ancestor (around 117 ka). During the last glacial period (approximately 100–11 ka), we observe a reduction in the amplitude of the changes in orbital-scale hydroclimate and overall drying within the homeland (Fig. 3b), whereas the southwest coastal hydroclimate was dominated by precessional variability and showed relatively agreeable environmental conditions (Fig. 3c, f). Notably, periods of deceleration and acceleration in the estimates of the effective population size of the L0d1’2 lineage coincide with regional changes in hydroclimate, further linking climate, population size and evolution. We propose that the Makgadikgadi–Okavango palaeo-wetland was the possible homeland of AMHs. Although one cannot exclude the possibility of a polycentric origin34, this deltaic–lacustrine ecosystem would have provided an ideal geographical locality for the evolution and 70-kyr-long sustained existence of the deepest-branching maternal founder population of AMHs. Increased humid conditions, supported by palaeo-lake system reconstructions35, between 130 and 110 ka would have opened green corridors for successful northeast–southwest migrations, supporting a pull scenario. Drying within the homeland following the out-of-homeland period, supported by hydroclimate data (110–100 ka) and a model simulation (100–80 ka), would have created a push scenario, in which a reduced carrying capacity of the land would have increased pressure to seek out climatically more favourable regions. We propose that the southwest migrants maintained a successful coastal forager existence, while the northeast migrants—similar to the later-branching population of L1’6—gave rise to ancestral pastoral and farming populations. A recent publication36 provides further mitochondrial evidence to support the northeast out-of-homeland migration route and expansion into eastern Africa around 70–60 ka. Revealing a southern African homeland for the emergence and extended subsistence of the L0 lineage, we propose that an out-of-homeland migration event, which was probably driven by astronomically induced regional shifts in hydroclimate, shaped the present-day ethnic and genetic diversity of modern humans. Methods No statistical methods were used to predetermine sample size. The experiments were not randomized and investigators were not blinded to allocation during experiments and outcome assessment. Statement on population identifiers The authors acknowledge that population identifiers (or ethnic labels) have different meanings to different peoples across different countries and between and within different ethnic groups. During the apartheid rule, South Africans were grouped according to ethnic identities, which resulted in discrimination based on population identifiers such as Bantu or Coloured. In turn, others view the very same population identifiers with cultural identity and pride. In 2013, we performed a study led by a Coloured co-author to assess the sensitivity in self-identification as Coloured. Of 521 participants, 91.2% self-identified as Coloured, Cape Coloured or South African Coloured, while 8.8% elected against the use of Coloured for self-identification14. In turn, using such population identifiers within the context of the United States would be seen as derogatory and highly offensive. We have previously genetically profiled the Baster population of Namibia13 and again what could be to others a derogatory term, to the Baster community of Rehoboth in Namibia, the term is used with immense pride, who recognize themselves as a Republic with a national flag38.  In this study, the authors have used linguistics, supported by ethnicity, to provide population identification, with further historical, geographical and genetic classification for deriving maternal contributions (described in the next section). KhoeSan (or KhoeSaan) languages are grouped together due to their use of click consonants as a unique language identifier. Once spread across the entire southern African region, KhoeSan languages are today restricted largely to populations residing in Namibia and Botswana (and southern Angola), although two Tanzanian isolates, Sandawe and Hadza, are believed to be linguistically related click languages (or east African KhoeSan)39. ‘San’ literally means ‘forager’ and Khoe means ‘person’; culturally, the KhoiSan identifier refers to hunter–foragers (San) or herders (Khoi). At times linguistic and cultural identities clash. For example, Nama and Hai‖om peoples both speak Nama (a Khoe–Kwadi language), while culturally and historically these two populations are quite different, representing a herder and hunter-gatherer ancestry, respectively. Additionally, autosomal genetic data have been used to provide further insights into KhoeSan admixture and substructures, highlighting at a genetic level the historical differences between the Nama and Hai‖om40. We have attempted to capture both ethnic and linguistic identifiers that best reflect population ancestry. In contrast to KhoeSan languages, most Bantu languages do not contain click consonants; however, exceptions exist within Southern African Bantu languages (for example, isiXhosa and isiZulu languages, which have borrowed click consonants from their KhoeSan neighbours). Spoken across the entire sub-Saharan Africa (up to 500 groups), the Guthrie classification of languages further identifies the S-zone or Southern Bantu (South Africa, Zimbabwe, southern Mozambique and most of Botswana) and the R-zone or Southwest Bantu languages (northern Namibia, southern Angola and northwest Botswana)41, which are of relevance to this study. |
|
|
|
Post by Admin on Nov 1, 2019 4:42:47 GMT
L0 haplogroup pre-screening
Subjects were selected for whole-mitogenome sequencing based on pre-screening for specific L0 markers using direct amplicon-specific Sanger sequencing. Specifically, a 2,673-bp region (Cambridge Reference Sequence (rCRS) position 3322–5995) was amplified and initially screened for the L0 variant T5442C. L0 samples were further screened to delineate L0d (T4232C), L0d1 (G3438A), L0d1b (T3618C), L0d1c (C4197T), L0d1’2 (A3756G), L0d2 (A3981G, C205T, A4044G), L0d2a (A5153G), L0d2d (G5147A, G5231A), L0d2C (A4038G, T4937C) and L0d3 (G5460A, G5773A) lineages. This identified 188 samples carrying a rare L0 haplogroup: L0d1b (n = 21), L0d1c (n = 13), L0d2a (n = 30), L0d2b (n = 7), L0d2c (n = 15), L0d2d (n = 6), L0d3 (n = 29), L0a1 (n = 6), L0a2 (n = 6), L0f (n = 5) and L0k (n = 5); as well as 55 samples that could not be unambiguously assigned to a major L0 sub-lineage: L0d1a’c (n = 2), L0a’b’f’k (n = 5), L0a’b (n = 2), L0d2 (n = 1) and L0d1 (n = 45, assumed L0d1a) (Supplementary Table 1).
Whole-mitogenome sequencing
Mitogenomes were isolated using two overlapping amplicons as previously described6,48. Specifically, two primer pairs were used to isolate and amplify fragments 12,250–3,005 (7.2 kb) and 2,583–12,337 (9.7 kb) of the circular mitogenome. This pair of primers has been demonstrated to effectively capture the mitogenome with high specificity while minimizing off-target capture of nuclear copies of mitochondrial-derived DNA. Following touchdown long-range amplification with the Platinum Taq DNA Polymerase High Fidelity (Invitrogen), the two amplicons were purified using AMPure XP beads (Agencourt) and combined in a 7:13 ratio of short:long fragments. Sequencing was performed on the Ion Torrent PGM platform. In brief, 200-bp single-end sequencing libraries were prepared using the Ion Xpress Plus Fragment Kit and Ion Xpress Barcode Adaptors (ThermoFisher), and 4–16 samples (barcodes) were pooled and sequenced on 314v2 Ion Chips. Using the Ion Torrent suite v.5.0.2.1, sequencing reads were quality trimmed and aligned to the human mitochondrial revised rCRS (accession NC_012920.1). Consensus mitogenome sequences were derived by first identifying variants relative to rCRS, using samtools (v.1.3.1) mpileup (with parameters -d 10000 -L 1000 -Q 7 -h 50 -o 10 -e 17 -m 4)49 and bcftools (v.1.3.1) call (with parameters -c -M) (http://www.htslib.org/doc/bcftools.html), then converting to the FASTA format using the vcfutils.pl vcf2fq program in samtools.
Whole-mitogenome haplotyping
HaploGrep250 was used to type all 1,217 sequences against PhyloTree Build 1751. This resulted in the refinement and reclassification of our 198 mitogenomes, resulting in L0d1 (n = 81, including 45 L0d1a, 21 L0d1b, 13 L0d1c and 2 L0d1d), L0d2 (n = 58, including 30 L0d2a, 8 L0d2b, 14 L0d2c and 6 L0d2d), L0d3 (n = 27), L0a (n = 19), L0f (n = 5), L0k (n = 5) and L0g (n = 3) mitogenomes (Supplementary Table 1). This refined, and in some cases reclassified, the haplogroups of the 1,019 publicly available mitogenomes (Supplementary Table 2).
Published: 28 October 2019
|
|


