|
|
Post by Admin on Oct 19, 2020 6:16:39 GMT
Methods Fürst Medisinsk Laboratorium (www.furst.no) is an accredited medical diagnostic laboratory that provides diagnostic services to primary care physicians in Norway. I retrieved data from the laboratory's database on the three diagnostic test results that have been used in the present analysis, namely serum 25(OH)D concentration, serum vitB12 concentration and the Eurasian LP variant rs4988235 (T), using Microsoft SQL management studio 2012 (Microsoft Cooperation). In the first step, serum 25(OH)D test results (n 3 136 065) and serum vitB12 test results (n 4 053 944) for all individuals that have been tested between 1 January 2011 and 31 December 2017 were in turn retrieved, along with test date, sex, age at time of micronutrient test and citizens' unique identification number (FNR) into a temporary instantiated SQL table. Additional clinical or lifestyle information was not available from this diagnostic database. In the second step, using FNR and sample date, first micronutrient test results of individuals were kept and subsequent test results from individuals, if any, were discarded. At this point, data from individuals under the age of 10 years were excluded as well as all results from individuals with >150 nm-25(OH)D or 600 pm-vitB12, to minimise the effect of vitamin supplements. Consequently, individuals are only present once in the vitamin D group (n 1 158 134) and only once in the vitB12 group (n 1 344 458). In the third step, FNR was used to extract and link genetic LP variant result from the same diagnostic database, using rs 4988235 SNP test results, independent of time of SNP testing (n 112 594 and n 120 292 for 25(OH)D study and vitB12 study, respectively). In 90 % of cases, rs4988235 SNP for LP would have been tested only once for the study subjects. Results for all individuals with a micronutrient test result but without a genetic LP test result were discarded. SQL instantiation in tempdb enabled the use of FNR to link patient results without retrieving any personal identifiers in the final output. Micronutrient test dates were converted to week number and average number of daylight hours on every study subject's micronutrient test week was used as a proxy for UVB exposure at time of micronutrient testing using 2015 daylight hours from the city of Molde at location 62·7372°N, 7·1607°E using the website www.timanddate.com. The project was approved by the Regional Committees for Medical and Health Research Ethics(21), application number 2017/1848. Statistical analyses including calculations of mean, standard error, median, variance, effect size, comparison of means and variances, univariate and multiple regression analysis, as well as plotting charts were performed using The R Project for Statistical Computing version 3.4.1 (2017-06-30) and RStudio version 1.1.383. Two-sample Student's t test was used to compare means, and the F test was used to compare variances. Regression of outcome (serum micronutrient concentration) on exposure (genetic LP status) was performed by conversion of the presence of the LP rs4988235 T-allele into a discrete value and by conditioning on the discrete variable, sex, and on continuous variables, age, daylight hours and a potential interaction rs4988235 T-allele × sex. For regression analyses, daylight hours were shifted by 4 weeks to account for the lag between the daylight hours period and vitamin D and B12 concentration periods (Figs 1 and 3). For graphical representations of data, patients were stratified according to rs4988235 (T) allele copy number whenever copy number was informative, such as analysis of T-allele dose–response (Figs 1(a), (c) and 3(c)). Otherwise, as in comparing means and P values, patients were stratified according to genetic LP status (CT/TT v. CC). For clarity in graphical plots, study patients were grouped according to week number of micronutrient test starting at 1 January. Because of large sample size and consequent small P values, Cohen's d coefficient was used to verify the effect size of the independent variables. Effect sizes were described as negligible (d < 0·2), small (d = 0·2–0·5), medium (d = 0·5–0·8) and large (d > 0·8) to describe <58, 58–69, 69–79 and >79 percentiles, respectively, of mean outcome in the control group (e.g. individuals without genetic LP variant) who would be above (or in case of vitB12, below) the mean of the outcome in the experimental group (individuals with genetic LP variant). 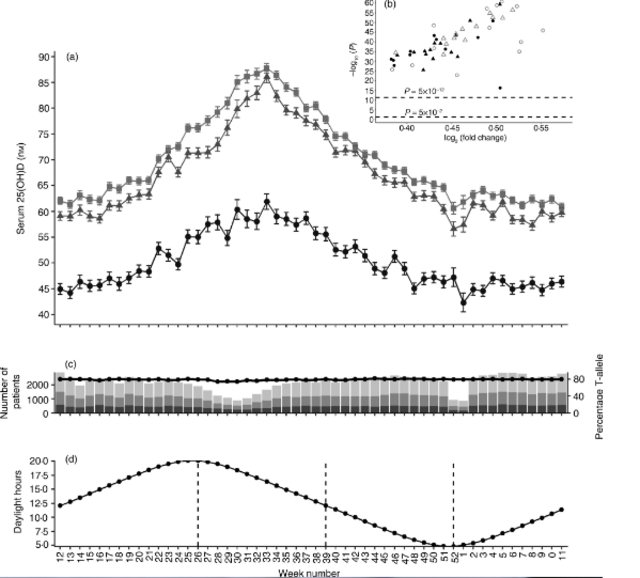 Fig. 1. Serum 25-hydroxyvitamin D (25(OH)D) concentration in individuals with genetic lactase persistence (LP) (rs4988235) test results. (a) Serum 25(OH)D concentration stratified by week of micronutrient measurement and LP rs4988235 T-allele copy number. Values are means, with standard errors represented by vertical bars. -●-, CC; -▲-, CT; --, TT. (b) Volcano plot showing –log10(P) v. log2(fold-change) in 25(OH)D) concentration in CC v. CT/TT individuals in all 52 weeks. ●, Winter; ▲, spring; ○, summer; Δ, autumn. (c) Number of individuals analysed (bar chart) stratified by week number and rs4988235 T-allele copy number. ■, CC; , CT; , TT; line shows percentage of study subjects with at least one rs4988235 T-allele. (d) Mean daylight hours throughout the year as a proxy for UVB exposure. The year is shown starting with the week of the vernal equinox and seasons are marked with vertical dotted lines. |
|
|
|
Post by Admin on Oct 19, 2020 21:26:32 GMT
Results Patient test result retrieval from January 2011 to December 2017 led to the inclusion of 112 594 individuals for serum 25(OH)D analysis and 120 292 for serum vitB12 analysis. Median ages of men and women, and of different genotype groups, were the same (Table 1), although more women (66–67 %) than men were present in the study population (Table 1). Variances for each micronutrient concentration stratified according to sex and genotype are shown in Table 1. The median ages of study subjects were 32·4 (25th, 75th percentiles 21·8, 46·6) and 32·2 (25th, 75th percentiles 21·7, 46·4) years in the 25(OH)D and vitB12 study subjects, respectively. The variance between the compared groups was statistically different (P < 0·05); however, the values were not logarithmically transformed as the ratio of variances was never greater than 1·1 and logarithmic transformation did not alter statistical differences and effect size (data not shown). Median micronutrient concentrations for serum 25(OH)D and serum vitB12 were 63 (25th, 75th percentiles 44, 82) nm and 302 (25th, 75th percentiles 244, 376) pm, respectively. Table 1. Summary of study subjects' micronutrient measurements (25-hydroxyvitamin D, nm; vitamin B12, pm), demographics and genotypes Serum 25-hydroxyvitamin D Serum vitamin B12 n % Median or mean Range Variance n % Median or mean Range Variance rs4988235 (TT) Subjects Men 16 735 31·6 19 151 33·1 Women 36 171 68·4 38 746 66·9 Age (years), median and range Men 33·7 10·1–96·8 33·8 10·1–95·0 Women 33·6 10·1–99·4 32·8 10·1–94·8 Concentration, mean, range, variance Men 63·8 10–150 626 321·8 69–600 8999 Women 71·6 10–150 688 308·8 80–600 9411 rs4988235 (CT) Subjects Men 11 893 32·6 13 204 33·8 Women 24 582 67·4 25 900 66·2 Age (years), median and range Men 32·4 10·1–94·0 32·7 10·1–90·7 Women 32·3 10·1–97·1 31·7 10·1–97·1 Concentration, mean, range, variance Men 60·8 10–150 623 323·8 55–600 9176 Women 68·6 10–150 721 311·9 72–600 9481 rs4988235 (CC) Subjects Men 8379 36·1 8589 36·9 Women 14 834 63·9 14 702 63·1 Age (years), median and range Men 31·5 10·1–92·3 31·7 10·1–92·0 Women 30·3 10·1–95·8 30·3 10·1–98·2 Concentration, mean, range, variance Men 48·1 10–149 572 325·5 50–600 9904 Women 50·9 10–150 728 323·8 58–600 10 443 Total Subjects Men 37 007 32·9 40 944 34 Women 75 587 67·1 79 348 66 Age (years), median and range Men 32·7 10·1–96·8 32·9 10·1–95·0 Women 32·3 10·1–99·4 31·8 10·1–98·2 Concentration, mean, range, variance Men 59·3 10–150 651 323·2 50–600 9656 Women 66·6 10–150 768 312·6 58–600 9656 Mean serum 25(OH)D was consistently higher in individuals with a genetic LP variant (CT or TT), whilst mean serum vitB12 was generally lower in individuals with a genetic LP variant, as described in detail below. Mean serum 25(OH)D was higher in women than in men (66·6 v. 59·3 nm; P < 2·2 × 10−16), although the effect size was small (d = 0·27; 95% CI 0·26, 0·28). Since UVB exposure is one of the main determinants of vitamin D concentration in humans, I analysed mean serum 25(OH)D concentration according to week in the year when the micronutrient test was performed (Fig. 1). Number of hours of daylight per d was used as an indirect relative measure of UVB exposure (Figs 1(d) and 3(d)). Mean serum 25(OH)D peaked in summer (week 32), 4–6 weeks after the week with the longest daylight hours (Fig. 1(a)). Persons with one or two copies of the LP rs4988235 (T) allele had markedly higher concentration of serum 25(OH)D than those without (P < 10−12 for all data points). Interestingly, this difference did not decrease in summer and in fact seemed more pronounced in summer and autumn (Fig. 1(b)). Stratification of individuals according to LP rs4988235 (T) allele copy number showed a non-linear dose–response of the rs4988235 (T) allele (P < 2 × 10⁻¹⁶; Fig. 1(a)). Throughout the year, the percentage of rs4988235 (T) allele in the study subjects did not vary noticeably and approximated to 79 %, despite fewer people seeking health care in Easter week, summer months and Christmas/Gregorian new year periods (Figs 1(c) and 3(c)). Women had higher mean serum 25(OH)D concentration than men (Fig. 2) and stratification according to genetic LP status showed that the effect size of sex on serum 25(OH)D in individuals with a genetic LP variant (d = 0·3; 95% CI 0·29, 0·32) was greater than that in genetically determined lactase non-persistent individuals, which was negligible (d = 0·11; 95% CI 0·08, 0·013; Fig. 2(a)). 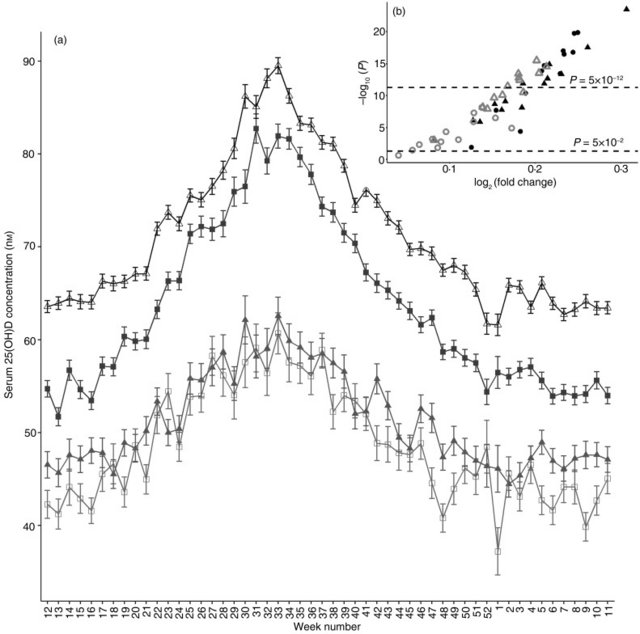 Fig. 2. Serum 25-hydroxyvitamin D (25(OH)D) concentration stratified by genetic lactase persistence (LP) status, sex and time of year. (a) Serum 25(OH)D concentration in women (▲, Δ) and men ( ■, □) with genetic LP (CT/TT, Δ, ■) and lactase non-persistence (CC, ▲, □) variants. Values are means, with standard errors represented by vertical bars. The year is shown starting with the week of the vernal equinox. (b) Volcano plot showing –log10(P) v. log2(fold change) in 25(OH)D) concentration due to sex in the LP sub-population. ●, Winter; ▲, spring; ○, summer; Δ, autumn. |
|
|
|
Post by Admin on Oct 20, 2020 4:21:28 GMT
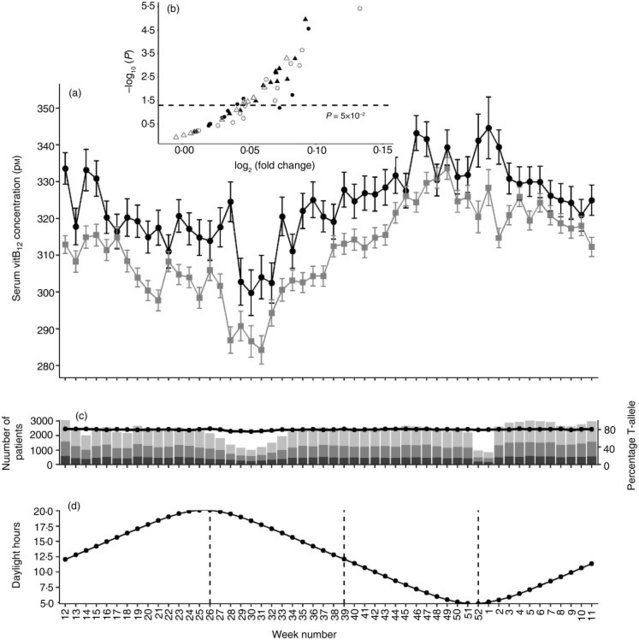 Fig. 3. Serum vitamin B12 (vitB12) concentration in individuals with genetic lactase persistence (LP) (rs4988235) test results. (a) Serum vitB12 concentration stratified by week of micronutrient measurement and LP rs4988235 T-allele. Values are means, with standard errors represented by vertical bars. -●-, CC; -An external file that holds a picture, illustration, etc. Object name is S2048679019000417_inline2.jpg-, CT/TT. (b) Volcano plot showing –log10(P) v. log2(fold change) in vitB12 concentration in CC v. CT/TT individuals in all 52 weeks. ●, Winter; ▲, spring; ○, summer; Δ, autumn. (c) Number of individuals analysed (bar chart) stratified by week number and rs4988235. ■, CC; An external file that holds a picture, illustration, etc. Object name is S2048679019000417_inline1.jpg, CT; An external file that holds a picture, illustration, etc. Object name is S2048679019000417_inline2.jpg, TT; line shows percentage of study subjects with at least one rs4988235 T-allele. (d) Mean daylight hours throughout the year as a proxy for UVB exposure. The year is shown starting with the week of the vernal equinox and seasons are marked with vertical dotted lines. It has been shown that rs4988235 (T) predicts dairy product consumption(16,22–25). In Norway, some dairy products, such as widely consumed low-fat milk, milk sent to schools, milks soured with culture and margarines, are now commonly fortified with vitamin D(26). I wanted to determine if consuming dairy products could explain some of the observations in the present study. Hence, I looked at concentrations of the micronutrient vitB12, which is naturally abundant in milk, although vitB12 is not exclusively acquired from dairy products. In contrast to 25(OH)D, serum vitB12 concentrations were lower in individuals with a genetic LP variant compared with genetically determined lactase non-persistent individuals (P < 2 × 10⁻¹⁶; Fig. 3(a)). There was no observable seasonal pattern in this difference (Fig. 3(b)), although in both genetically determined LP and lactase non-persistent groups, serum vitB12 concentration dropped in early summer (Fig. 3(a)). The effect size of the rs4988235 (T) allele on serum vitB12 was negligible to small (d = 0 to 0·3; Fig. 4). Conversely, the effect size of the rs4988235 (T) allele on 25(OH)D was medium to large (Cohen's d = 0·5 to 1; Fig. 4). 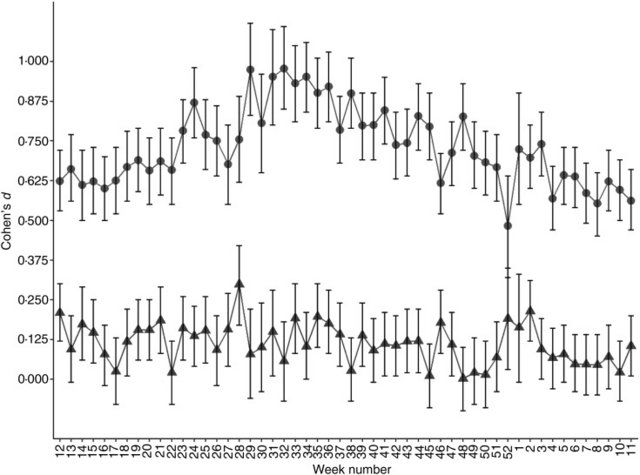 Fig. 4. Standardised effect size of genetic lactase persistence variant (rs4988235 CC v. CT/TT) on serum micronutrient concentration. Values are Cohen's d effect size for 25-hydroxyvitamin D (●) and vitamin B12 (▲) for each week of the year starting with the week with the vernal equinox, with 95% confidence intervals represented by vertical bars. In multiple linear regression analysis, presence of the rs4988235 (T) allele, daylight hours, sex, age and an introduced interaction variable, rs4988235 (T) allele × sex, all remained independent determinants of serum 25(OH)D (adjusted R2 0·15; P < 2·2 × 10−16; Table 2). In multiple regression of serum vitB12, rs4988235 (T) allele, daylight hours, age and the interaction variable, rs4988235 (T) allele × sex, remained determinants of serum vitB12 concentration (R 0·02; P = 1·4 × 10−12), but in an inverse relationship with less effect (Table 2). Sex remained an independent determinant of serum vitB12 in a model without interaction (data not shown). In these models, having CT/TT was associated with an increase of 14·2 nm serum 25(OH)D and a 1·9 pm decrease in vitB12. Being female was associated with a 2·8 nm increase in serum 25(OH)D. Being female and having CT/TT was associated with a 4·8 nm increase in serum 25(OH)D and a 10·4 pm decrease in serum vitB12. Every 1 h increase in daylight led to an average of 1·2 nm increase in serum 25(OH)D and 1·7 pm decrease in serum vitB12. Every 1-year increase in age led to an associated increase of 0·2 nm serum 25(OH)D and 0·5 pm decrease in serum vitB12 (Table 2). Table 2. Multiple regression analysis of serum micronutrient concentration on LCT-13910 T-allele conditioned on daylight hours on week of micronutrient test date, age, sex and the interaction LCT-13910 T-allele × sex 25-Hydroxyvitamin D Vitamin B12 Coefficient P Coefficient P Intercept 27·6 <2 × 10⁻¹⁶ 361·7 <2 × 10⁻¹⁶ LCT-13910 T-allele 14·2 <2 × 10⁻¹⁶ −1·9 <2 × 10⁻¹⁶ Daylight hours 1·2 <2 × 10⁻¹⁶ −1·7 <2 × 10⁻¹⁶ Age 0·2 <2 × 10⁻¹⁶ −0·5 <2 × 10−16 Sex 2·8 <2 × 10⁻¹⁶ −2·0 0·132 LCT-13910 T-allele × sex 4·8 <2 × 10⁻¹⁶ −10·4 <2 × 10⁻¹⁶ F statistic 3812* <2·2 × 10−16 457† 1·4 × 10−16 LCT, lactase gene. |
|
|
|
Post by Admin on Oct 20, 2020 19:40:18 GMT
Discussion
The genetic basis of LP in Eurasians is a single C to T mutation, 13 910 bp upstream of the lactase gene (LCT) that leads to individuals not switching off synthesis of the enzyme lactase phlorizin hydrolase in their lifetime(27). Although most individuals without the LP variant seem to tolerate moderate amounts of lactose-containing dairy products(28,29), individuals with the genetic LP variant tend to drink more unfermented milk and possibly consume more dairy products(16,23,30). In a Mendelian randomisation study of Caucasians of European descent living in Canada, the Eurasian LP variant, when used as an instrument for dairy product consumption, associated dairy product consumption with higher levels of serum 25(OH)D(16). This was attributed to vitamin D supplementation of dairy products. Similarly, European countries with high LP in the population tend do have less vitamin D deficiency in the population despite lower UVB exposure(20). In a different study of 210 individuals tested for primary adult-type lactose malabsorption (PALM) using the same genetic marker, subjects with PALM had lower levels of vitamin D and higher levels of the bone resorption marker, CrossLaps, compared with controls(31). However, in the latter study, frequency of smokers was higher in the PALM group and seasonality of vitamin D measurements was not considered. I wanted to determine whether in a country such as Norway, which is situated at high latitude and consequently with limited UVB exposure, the same pattern of 25(OH)D concentration in individuals with and without a LP variant could be observed. In Norway, approximately 50 % of the milk consumed, a lightly fat-reduced milk, is supplemented with vitamin D(26,32). Furthermore, I hypothesised that if there is a difference in vitamin D status in genetically determined LP and lactase non-persistent individuals, it should reduce in summer months, as vitamin D forms rapidly in skin after exposure to UVB, with excess compound converted to inactive metabolites(33,34). In this analysis of over 100 000 individuals, I could confirm that mean serum 25(OH)D was noticeably higher in individuals with a genetic LP variant compared with individuals without. In addition, there was a non-linear dose–response: individuals with two copies of the LP rs4988235 (T) variant (TT) had detectably higher level of serum 25(OH)D compared with those with one copy (CT; P < 2 × 10⁻¹⁶; Fig. 1). A dose–response to T-allele copy number has been reported in some studies(16,25) but is mostly undetectable in studies of dairy product consumption(22,35,36). Mean serum 25(OH)D level at different times of the year followed but lagged the sinusoid curve seen by mean daylight hours per d, used here as a proxy for UVB exposure (Fig. 1), in all three populations stratified according to Eurasian LP allele copy number. However, in contrast to the pre-study hypothesis, there was no clear diminishing of the difference in mean serum 25(OH)D concentrations between the three genotypes in summer months. In fact, the opposite seems to be true as seen in volcano plots of P v. fold-change in mean serum 25(OH)D concentrations (Fig. 1(b)); after a period of longer daylight hours, difference in serum 25(OH)D levels between genetically determined LP individuals and lactase non-persistent individuals increased. Milk is naturally high in vitB12 and although it is not the only source of vitB12, it is a significant source for populations living in countries with strong dairy industries(17,37). Hence it was hypothesised that milk consumption could be positively associated with serum vitB12 levels independent of UVB exposure. The second novel finding of the present study, albeit counterintuitive, was that persons with a genetic LP variant had equal or lower levels of vitB12 (Fig. 3). The positive effect size of the LP rs4988235 (T) allele on serum 25(OH)D was medium to large (d = 0·5 to 1) compared with that of its negative effect size on serum vitB12 concentration, which was low to negligible (d = 0 to 0·3; Fig. 4). Based on these two observations, I cannot exclude pleiotropic factors, not related to dairy product consumption, such as sunscreen use, skin pigmentation or clothing worn outdoors, to cause the difference in vitamin D levels seen in the population stratified by the LP rs4988235 (T) allele.
The third novel observation was that the effect of sex on serum 25(OH)D concentration was remarkably higher in the genetically LP sub-population (70·4 nm in women v. 62·6 nm in men; d = 0·3) compared with the genetic lactase non-persistent sub-population (50·9 nm in women v. 48·1 nm in men; d = 0·1; Table 1). Smith et al.(38) have recently reported a sex-specific association of LP with higher CVD and mortality in women but not in men(38). Although sex itself is not a driver of lactose intolerance(39), diet modulation due to actual and perceived lactose intolerance may be different in men and women(40). In the present study, an interaction between the LP rs4988235 (T) allele and sex was introduced in multiple regression analyses that was significant in both the regression of serum 25(OH)D and serum vitB12 (Table 2). This interaction reduced the coefficient for the LP rs4988235 (T) allele from 17·1 (data not shown) to 14·0 (Table 2) in the vitamin D group but did not affect coefficients for daylight hours, age or sex alone. In the vitB12 study group, the interaction reduced the coefficient for the rs4988235 (T) allele from −8·6 (data not shown) to −1·9 and sex alone became an insignificant determinant of serum vitB12 (Table 2). Interaction between genetic LP variant and daylight hours was small in the vitamin D group and insignificant in the vitB12 group (data not shown) and consequently not included in the model.
There are several weaknesses to the present study. Firstly, measurements of milk consumption by the study subjects was not available. Consequently, this is an observational study that can partially but not wholly support the causal study of Alharbi et al.(16). Secondly, the study subjects come from patients seeking health care, and consequently they cannot be classified as healthy subjects. Physicians would have ordered a test for lactose intolerance if the patient complains of frequent diarrhoea, gas, bloating, nausea or cramps or to determine if any symptoms are due to secondary lactose intolerance such as in coeliac disease. Furthermore, some ailments such as kidney and liver diseases, cystic fibrosis, Crohn's disease, coeliac disease as well as obesity can cause vitamin D deficiency or simply reduce bioavailability of vitamin D(41). None of these diseases is associated with inherited adult-type LP and stratification of such a large study population using genetic LP variant should have led to equal randomisation with respect to these diseases. Given the large sample size, it is likely that only a small fraction of the study subjects has health problems related to lactose intolerance, vitamin D deficiency or vitB12 deficiency. These tests would have been largely ordered by physicians in order to rule out potential causes. Hence the study subjects are likely to be representative of the whole population because of the large sample size. To look for signs of selection bias, I examined deviations from Hardy–Weinberg equilibrium in the study population (n 112 594) and in all patients that had been tested for genetic LP in the laboratory database (n 198 650). The latter contain patients that have not been tested for vitamin D, children under 10 years, patients with extreme vitamin concentrations or patients that have been tested in the laboratory outside of the study dates. Both the study population and the total patient population deviate significantly from Hardy–Weinberg equilibrium (P < 0·05; data not shown) but deviations in both groups were the same, with frequencies of TT, TC and CC being 0·47, 0·33 and 0·20, respectively, for both populations. Furthermore, I did not find a significant association between serum 25(OH)D levels and another SNP with high penetrance, namely HFE C282Y that leads to altered iron metabolism(42) in subjects taken from the same database of Norwegian citizens, when adjusted for sex, daylight hours and age (n 15 881, data not shown). It would be of interest to determine if associations reported in the present study can be observed in a healthy sample population living at a similar latitude. Indeed, such a study is a logical follow-up of the present study findings. Assuming a cut-off of 50 nm for vitamin D deficiency(4), throughout the year apart from summer (weeks 26 to 39; Fig. 1), 10 444 out of 18 013 (58 %) of genetically determined lactase non-persistent individuals and 20 861 out of 71 024 (29 %) of genetically determined LP individuals would have been classified as vitamin D deficient. In summer months, vitamin D deficiency would have been 2184 out of 5200 (42 %) and 1997 out of 18 357 (11 %) in the two groups, respectively. There was no evidence that genetically determined lactase non-persistent individuals were overrepresented in the database in darker months as the percentage of T-allele in the study subjects remained mostly constant at 79 % throughout the year (Fig. 1(c) and (d)). A third weakness to the study is that records of ethnicity, socio-economic status, skin pigmentation, clothing habits, smoking habits and BMI of the study subjects were not available. In the study population of Enko et al.(31), subjects with primary lactose malabsorption tended to smoke more than their LP counterparts(31). However, it is well documented that cigarette smoking reduces plasma vitB12 considerably(43). It is also well documented that lighter skin leads to more rapid vitamin D synthesis when exposed to UVB(34). All study subjects would have been Norwegian citizens as a national personal number was used to link together micronutrient readings, genotypes and demographics. At the time of writing this paper, 81·4 % of the population in Norway are Scandinavian, Finnish or Icelandic(44). It is not known whether immigrants from low-LP populations are disproportionally represented in primary health care in Norway and hence if their numbers are skewed in the present study population. Phenotypic LP frequency in ethnic Norwegians is reported to be 97 %(45). It is tempting to hypothesise that the Eurasian LP variant is correlated with a potential confounder such as the extent of skin pigmentation, and that such counfounder is more important for vitamin D status than modern dairy product consumption habits. If individuals without a genetic LP variant generally have darker skin, at high latitude they would have lower serum 25(OH)D because of limited UVB exposure, especially in darker months(46). In fact, lower vitamin D levels are reported in both the male and female immigrant population living in Norway(47). If light skin among genetically determined LP individuals, and not dairy product consumption, is the primary reason for higher serum 25(OH)D levels, that would explain why individuals with a genetic LP variant do not necessarily have higher vitB12 levels, i.e. more vitamin D and vitB12 are not acquired by genetically LP individuals through dairy product consumption. However, this does not explain the observation that in summer vitB12 concentrations drop in individuals without a genetic LP variant at a similar rate to that of genetically determined LP individuals (Fig. 3), as darker skin should protect against UVB-mediated destruction(48,49). Secondly, it does not explain why there is a sex difference in serum vitamin D levels in genetically determined LP individuals but minimal in genetically determined lactase non-persistent individuals (Fig. 4). Lastly, using LDlink(50) the Eurasian LP rs4988235 SNP was found not to be in linkage disequilibrium with eight SNP associated with skin pigmentation(51) nor with SNP in eight genes associated with vitamin D metabolism(52–54) (data not shown).
In conclusion, analysis of a large population of patients attending primary healthcare confirms the findings that people who carry the Eurasian LP rs4988235 (T) allele and live at high latitude have a higher level of serum 25(OH)D compared with those who are genetically lactase non-persistent. This difference is apparent throughout the year and does not diminished in the summer months at times of higher UVB irradiation. Higher serum vitamin D in high-latitude regions as a result of LP would advantageously enhance Ca homeostasis directly (Ca assimilation hypothesis(55)) and not just through lactose-enhancing Ca absorption or through general acquirements of micronutrients from dairy products. That I find women with a genetic LP variant have higher serum 25(OH)D compared with their male counterparts points to an additional potential selective advantage, that of giving birth to offspring without abnormal bone growth or low weight, as well as reducing likelihood of costly miscarriage(56). There are suggestions that vitamin D levels resulting from seasonal patterns of sunshine and skin pigmentation may be a determinant of birth outcomes in differing races(57). If there was a selective advantage for this allele in Northern Europe at the time of animal domestication through acquiring nutrients from milk, this did not extend to selective advantage of acquiring vitB12. Lastly, these data raise the possibility of using a non-invasive and cheap SNP test to identify individuals living at high latitude who are at higher risk of vitamin D deficiency, prior to implementing a more demanding and costly serum 25(OH)D test. Alternatively, it is very possible that optimal vitamin D cut-off levels, as set by various agencies(4), would automatically classify many genetically lactase non-persistent individuals as vitamin D insufficient, when in fact their natural vitamin D status does not reflect their health status. Even in countries with excessive sunshine, such as in Pakistan, the population is found to be vitamin D insufficient, if international agencies’ guidelines are taken into consideration(58). Lastly, these data confirm the importance of stratifying adult study subjects according to genetic LP variant when studying indicators of vitamin D status in individuals.
|
|
|
|
Post by Admin on Oct 25, 2020 20:42:25 GMT
Lactase Persistence Variants in Arabia and in the African Arabs Edita Priehodová,1 Abdelhay Abdelsawy,2 Evelyne Heyer,3 and Viktor Černý4* 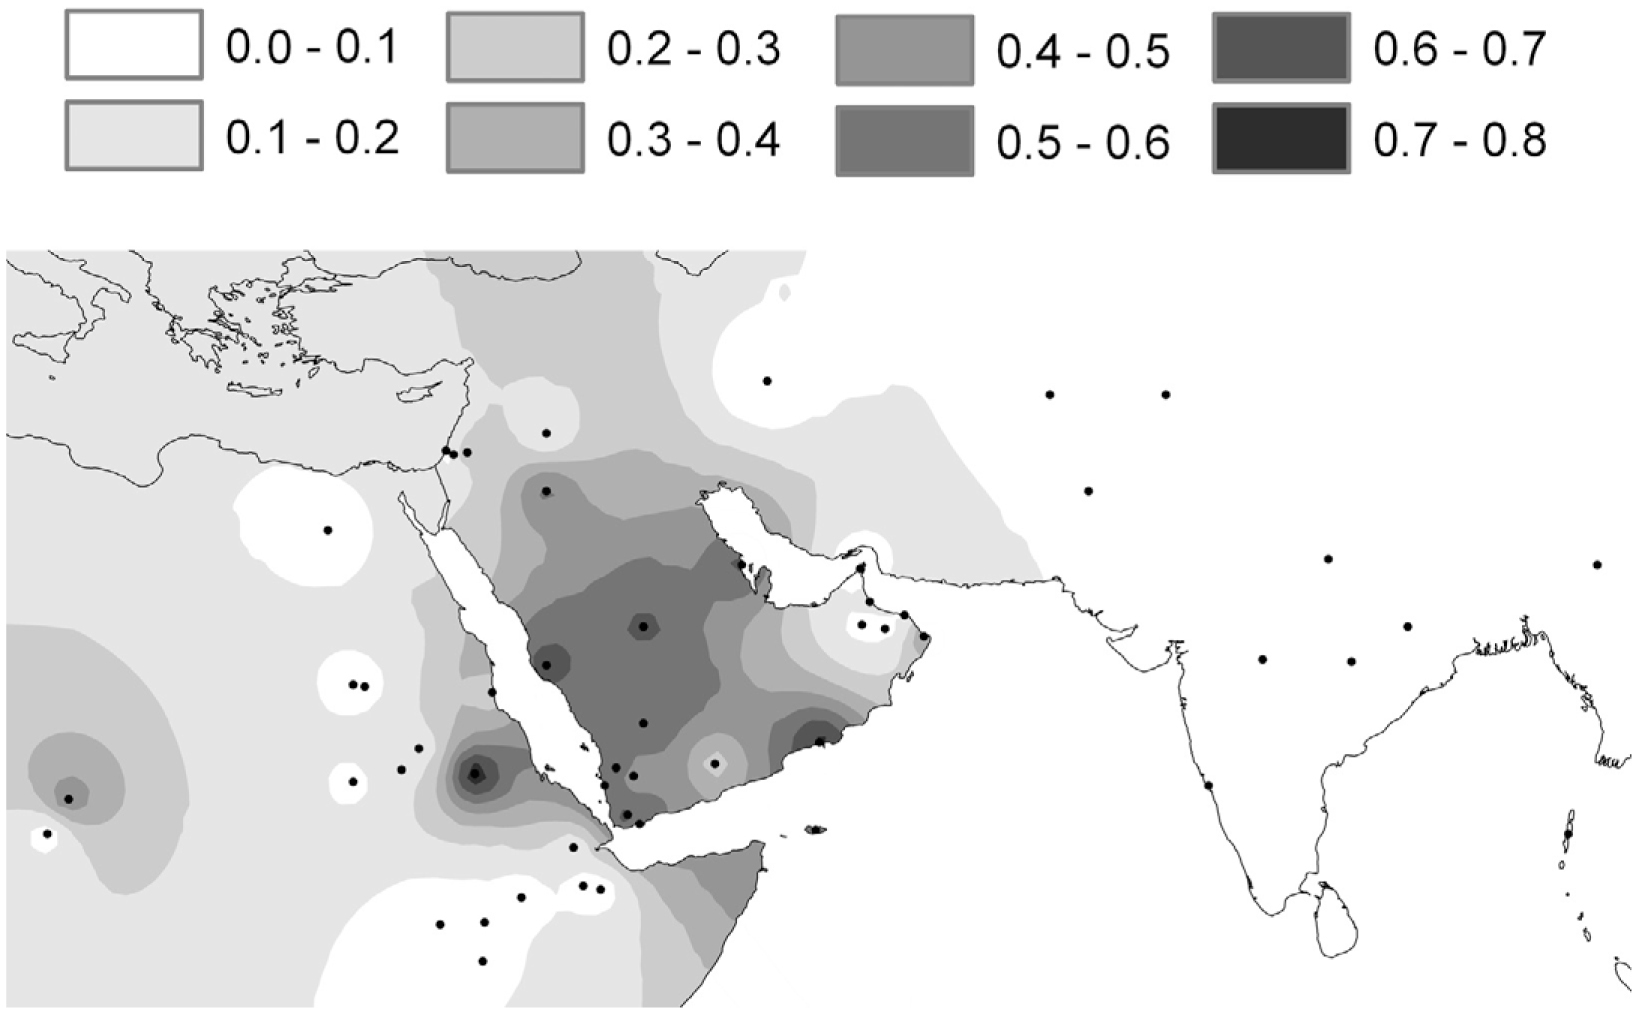
abstract
Lactase persistence (LP), the state enabling the digestion of milk sugar in adulthood, occurs only in
some human populations. The convergent and independent origin of this physiological ability in Europe
and Africa is linked with animal domestication that either had started in both places independently or
had spread from the Near East by acculturation. However, it has recently been shown that at least in its
southern parts, the population of Arabia not only has a different LP-associated mutation profile than the
rest of Africa and Europe but also had experienced an independent demographic expansion occurring
before the Neolithic around the Pleistocene-Holocene boundary. In Arabia, LP is associated with mutation –13,915*G and not, as in Europe, with –13,910*T or, as in Africa, with –13,907*G and –14,010*C. We
show here that, in Arabia, –13,915*G frequency conforms to a partial clinal pattern and that this specific
mutation has likely been spread from Arabia to Africa only recently from the sixth century AD onward
by nomadic Arabs (Bedouins) looking for new pastures. Arabic populations in Africa that still maintain
a nomadic way of life also have more –13,915*G variants and fewer sub-Saharan L-type mitochondrial
DNA haplogroups; this observation matches archaeological and historical records suggesting that the
migration of Arabic pastoralists was accompanied by gradual sedentarization that allowed for admixture
with the local African population.
Food production in the Neolithic stimulated
significant demographic growth of several
human populations (Bocquet-Appel 2011)
and facilitated the spread of certain traits having
selective advantages. One such genetically determined trait,
lactase persistence (LP), allows for the
digestion of milk sugar (lactose)—an ability common in all
mammals during nursing—to continue
into adulthood rather than being limited to children (Swallow 2003).
Since the milking of domestic
animals became a common practice at this time
(Bersaglieri et al. 2004; Hollox et al. 2001), having
the lactase persistence trait conferred advantage on
its carriers by allowing them to consume fresh milk
as a quickly available and nutritious food source.
Lactase persistence has also been theorized
to be particularly advantageous in populations
exposed to lower levels of ultraviolet radiation that
as a result sufffer a concomitant lower production
of vitamin D. Since vitamin D acts as a hormone
that controls calcium levels in the blood, higher
consumption of milk in these areas provides higher
intake of calcium, preventing rickets. This calcium
assimilation hypothesis, along with the lighter
pigmentation supporting the production of vitamin D
found in northern populations (Gerbault
et al. 2009), is consistent with the facts that high
frequencies of LP individuals are found in Europe
in general and that they are highest in northern
European latitudes where ultraviolet radiation is
weakest (Gerbault et al. 2009).
Higher frequency of LP has, however, also been
reported in Africa and the Middle East, where ultraviolet
radiation is suffficiently high that rickets
does not pose a threat. The fact that the prevalence
of the trait in these areas is chiefly tied to nomadic
pastoralists with a strong dependence on milk
consumption has inspired the hypothesis of coevolution
between genes and culture (Holden and Mace 2002).
At the molecular level, there is evidence that
LP can be caused independently by any of several
specific mutations in an enhancer element regulating
the expression of the lactase gene LCT. This
element is located in an intron of the neighboring
gene MCM6 (Enattah et al. 2002). The most frequent
variant overall is –13,910*T, thought to have
originated somewhere between central Europe
and the Balkans ~7.5 kya (Bersaglieri et al. 2004;
Itan et al. 2009) and to have subsequently been
spread northward (Malmström et al. 2010). This
“European” LP mutation also occurs in India (where
it follows a general northwest to southeast declining
pattern; Gallego Romero et al. 2012), in central
Asia (where no association with pastoralism has
been identified; Heyer et al. 2011), and in the West
African Sahel among the Fulani nomads (Lokki et
al. 2011).
The –13,910*T variant, although the most frequently
occurring, is not the only lactase-regulating
variant documented (Ingram et al. 2007; Mulcare et
al. 2004; Tishkofff et al. 2007). In Arabia, –13,915*G
has arisen in parallel, possibly as an adaptation to
consumption of camel milk (Enattah et al. 2008;
Imtiaz et al. 2007). Africa has an even more complex
repertoire of LP variants, as well as a complex
population history reflecting several genetic inputs
from Eurasia evidenced by Eurasian uniparental
markers present today, especially among nomadic
groups (Cruciani et al. 2010; Černý et al. 2011b;
Olivieri et al. 2006; Pereira et al. 2010). Lactase
persistence in Africa is associated with at least
three native variants,–13,907*G, –14,009*G, and
–14,010*C, originating on the continent independently
(Ingram et al. 2007; Jones et al. 2013; Tishkofff et al. 2007).
In addition, however, Africa also
harbors both the “European” –13,910*T and “Arabic”
–13,915*G variants, both of which must have been
introduced to the area in a similar manner as the
Eurasian uniparental markers.
It has been suggested that the Neolithic in
Arabia, at least in its southern part, evolved
independently of that in the Near East (Rose and Usik
2009). Although the subsistence pattern of the
first food-producing populations in Arabia is still
not understood in full detail, it can be suggested
that the domestication of animals (pastoralism
linked with milking) came before the cultivation
of domestic plants (Fedele 2009; McCorriston and
Martin 2009). Using large mitochondrial DNA
(mtDNA) datasets, we have recently proposed
that the population of southern Arabia underwent
expansion as early as 12 kya (Al-Abri et al.
2012), that is, before the putative Near Eastern
Neolithic input (Dreschler 2007). It has also been
revealed that some mtDNA haplogroups such as
R0a and HV1 were in fact recently introduced to
Africa from Arabia (Černý et al. 2011a; Musilová
et al. 2011), confirming contact between these
two areas.
In this study we formulated several research
questions and hypotheses to clarify the spread of
the “Arabic” LP variant –13,915*G to Africa. First, if
the variant arrived in Africa only recently with nomadic
pastoralists, then higher frequencies should
be found today in those Arabic groups leading
a pastoralist lifestyle. Second, since the mating
pattern in Arabic tribes is not always random, as
many social anthropologists maintain (Bonte 1994),
and some genetic studies indeed determined a
certain degree of heterozygote deficiency possibly
resulting from consanguinity (Cadenas et
al. 2008), we have examined whether –13,915*G
follows the Hardy-Weinberg equilibrium in the
populations here studied. Last but not least, we
analyzed –13,915*G frequencies across Arabia and
northeastern Africa for evidence of a cline. For
the purposes of our analysis, we present new LP
data from five sedentary Arabian and five African
Arabic populations. Of these 10 analyzed groups, all
from Arabia lead a sedentary lifestyle, whereas the
Arabic-speaking tribes in Africa rely on differing
degrees of nomadic pastoralism. We present here
the data from 920 chromosomes and discuss our
genetic results in a wider archaeological and historical
framework.
|
|

