|
|
Post by Admin on Oct 25, 2020 23:24:08 GMT
Materials and Methods
Population Samples
We have scanned for LP variants in five population
samples from Arabia (Yemen) and five Arabic-speaking
populations in Africa. Of these populations, all but two
(the Rashaayda from Sudan and the Sudanese Arabs) correspond
with samples whose mtDNA data have been previously published
(Černý et al. 2007, 2008, 2009; Kujanová et
al. 2009). The results and geographical locations of
all the populations examined here are presented
in Table 1. While all Yemeni groups and two Arabic
populations in Africa maintain a sedentary lifestyle,
the ancestors of the three remaining Arabicspeaking
African populations sampled in Sudan,
Chad, and Nigeria entered Africa as nomadic
pastoralists, and their present-day descendants
still continue in this tradition. However, while the
Rashaayda in Sudan and Baggara in Chad continue
to rely on nomadism fully, the Shuwa in Nigeria
today already lead a more sedentary, seminomadic
lifestyle. These Shuwa Arabs are also, according
to our previous mtDNA analyses, more admixed
with sub-Saharan populations (Černý et al. 2007).
For some comparative purposes, previously published
data sets characterizing other populations
from the Arabian Peninsula and its neighborhood
were included in some of the analyses (see the
Appendix).
Laboratory and Statistical Analyzes
In total, 920 chromosomes (460 individuals) were
screened for the variants associated with LP. We
sequenced the 359-bp fragment located in intron 13
of the MCM6 gene where the four main LP-associated
mutations can be detected. We used the same
primers as reported in a previous study (Coelho
et al. 2009). PCR products were sequenced with
forward primers, and in cases of ambiguity, reverse
complements were generated. The variants were
identified by means of BioEdit software (Hall 1999),
and allele frequencies were then calculated. Chisquare
tests for the Hardy-Weinberg equilibrium,
heterozygosity, fixation indexes (F), analysis of
molecular variance (AMOVA), and principal coordinate
analysis (PCoA) were undertaken by means
of the GenAlEx statistical package (Peakall and
Smouse 2012). The spatial frequency distributions
of the main “Arabian” LP variant –13,915*G found in
Arabia and neighboring regions was visualized by
constructing interpolation maps using the “Spatial
Analyst Extension” of ArcView version 3.2 (www.
esri.com/software/arcgis/arcview/). The clinal pattern
of –13,915*G within the Arabian Peninsula
was further tested by correlogram autocorrelation
analysis (Moran 1950) as implemented in PASSaGE
software (Rosenberg and Anderson 2001); these
spatial analyses also included other previously
published data sets (see Appendix).
Table 1. Population Samples Used in This Study
Population Abbreviation N Sampling location Country Longitude Latitude Lifestyle
Yemeni 1 YAC 43 Al-Akhkum Yemen 44.18 13.32 Sedentary
Yemeni 2 YTI 66 Around Hudeida Yemen 43.00 14.82 Sedentary
Yemeni 3 YHG 34 Around Hajja Yemen 43.60 15.70 Sedentary
Yemeni 4 YHA 40 Wadi Hadramawt Yemen 48.74 15.93 Sedentary
Yemeni 5 YSO 65 Soqotra Yemen 53.85 12.50 Sedentary
Arabs Rashaayda RAS 52 Abu Talha Sudan 36.30 15.35 Nomadic
Arabs Sudan ARS 46 Along the Nile Sudan 30.55 19.88 Sedentary
Arabs Baggara ACH 27 Around Mao Chad 15.31 14.12 Nomadic
Arabs Shuwa ASW 53 Ngala and around Nigeria 14.19 12.34 Seminomadic
Arabs Egypt ELH 34 El Hayz Egypt 28.66 28.02 Sedentary

Table 2. Intrapopulation Variation of –13,915*G in the Yemeni Populations and African Arabs
Population TT TG GG T G Chi squared p-Value Ho He FI
YAC 6 18 19 0.349 0.651 0.265 0.606 0.419 0.454 0.079
YTI 14 26 26 0.409 0.591 2.263 0.132 0.394 0.483 0.185
YHG 5 16 13 0.382 0.618 0.000 0.983 0.471 0.472 0.004
YHA 20 19 1 0.738 0.263 2.057 0.151 0.475 0.387 –0.227
YSO 15 24 26 0.415 0.585 3.737 0.053 0.369 0.486 0.240
RAS 4 16 32 0.231 0.769 0.924 0.336 0.308 0.355 0.133
ARS 39 7 0 0.924 0.076 0.312 0.576 0.152 0.141 –0.082
ACH 8 13 6 0.537 0.463 0.027 0.869 0.481 0.497 0.032
ASW 47 5 1 0.934 0.066 2.932 0.087 0.094 0.123 0.235
ELH 33 1 0 0.985 0.015 0.008 0.931 0.029 0.029 –0.015
abbreviations: Ho, observed heterozygosity; He, expected heterozygosity; FI, fixation index. Chi-square tests are for Hardy-Weinberg equilibrium. The p-values
indicate probability for the chi-square tests—all are statistically nonsignificant at the 5% level.
|
|
|
|
Post by Admin on Oct 26, 2020 20:46:59 GMT
 FIGURE 1. PCoA plot based on the frequencies of –13,915*G, –13,910*T, and –14,009*G. Squares, Arabian samples; circles, African samples. For population abbreviations, see Table 1.
Results
Genotypes and allelic frequencies of –13,915*G, the
most frequently occurring LP variant in our populations,
are reported in Table 2, showing that it appears in all
analyzed Arabian (Arabian Peninsula)
and Arabic-speaking (Africa) groups, albeit with
varying frequency. While the Yemeni populations
display more or less similar frequencies (except
for the one from Hadramawt), Arabic-speaking
populations from Africa fall into one of two distinct
groups: one having a high and another having a low
population frequency of this variant. Interestingly,
this division correlates with lifestyle, supporting
the hypothesis of the recent introduction of this
variant from Arabia; both nomadic groups from
Sudan (the Rashaayda) and Chad (the Baggara) attain
relatively high –13,915*G frequencies, while the
seminomadic Shuwa from Nigeria and sedentary
Arabs from Sudan and Egypt show a much lower
frequency of this variant than do the Yemenis and
the Arabian nomads from Africa.
AMOVA provides an interpopulation insight
into the structure of the LP variants in our samples;
both –13,915*G and other, more frequently occurring variants,
such as –13,910*T and –14,009*G,
were considered in this analysis. The percentage of
whole molecular variance for all variants combined
was 60% within populations and 40% among
populations. When considering the –13,915*G
variant alone, 56% of the molecular variance was
within populations and 44% among populations;
for –13,910*T alone, 93% of the molecular variance
was within populations and 7% among populations; and for
–14,009*G alone, 87% of the molecular variance was
within populations and 13%
among populations. Most of the overall variance
between the combined populations is therefore
explained by variant –13,915*G.
The construction of the PCoA plots was carried out
on the PhiPT matrix values calculated
by the AMOVA. This analysis clearly separates
the analyzed samples into two different groups
(see Figure 1): one composed of populations with
higher frequencies of the 13,915*G variant (left),
and the other composed of populations with lower
frequencies of this variant (right). The populations
of the Hadramawt (YHA) and the Baggara Arabs
(ACH), both having intermediate distributions of
–13,915*G, lie between these groups
The chi-square test for the Hardy-Weinberg
equilibrium shows that the frequency of 13,915T/G
genotypes is in equilibrium in all 10 analyzed
populations (Table 2). This result is confirmed
by comparisons of observed versus expected
heterozygosities measured by fixation indexes;
only the Shuwa Arabs from Nigeria (ASW) and the
population from Soqotra Island (YSO) are characterized
by higher positive values, indicating a very
slight deviation toward an excess of homozygotes,
even if levels of significance were not exceeded.
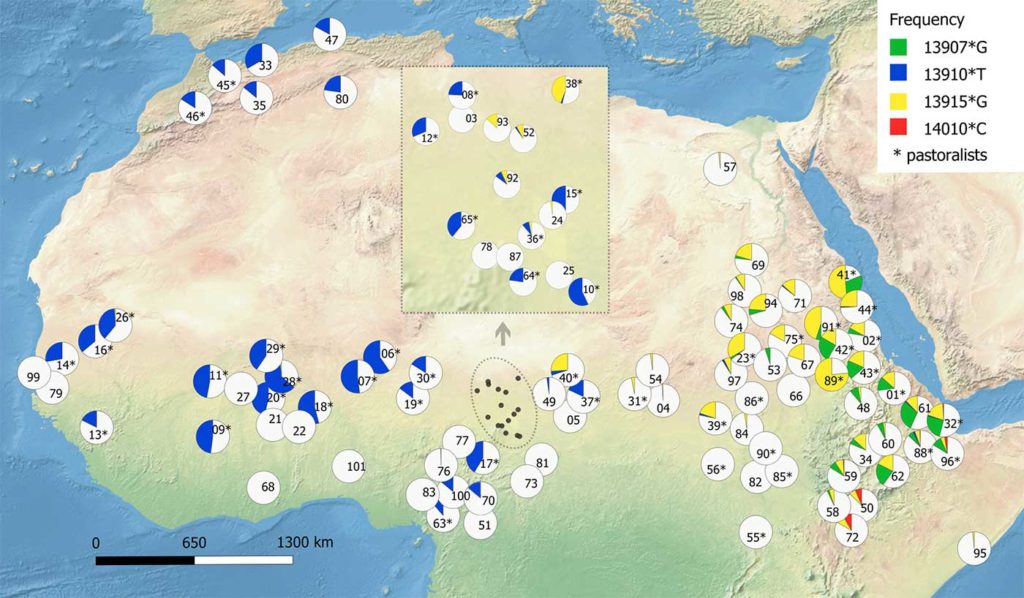
 FIGURE 2. Map for –13,915*G frequencies in Arabia and neighboring regions. For population data, see the Appendix. |
|
|
|
Post by Admin on Oct 26, 2020 22:37:25 GMT
 FIGURE 3. Spatial autocorrelation analyses for –13,915*G. Circles are statistically significant at the 5% level; x, statistically nonsignificant at the 5% level.
The geographical distribution of –13,915*G
is presented in Figure 2, where its geographical
dominance in Arabia is clearly visible. Only the
Hadramawt and most of the northern Omani populations
(ODA, ODH, OMU, and OBA; see Appendix)
have a lower frequency of this mutation. The diagram
clearly shows that there is a virtual absence
of –13,915*G eastward of Arabia in the Middle East
and India. On the other hand, Africa has a much
higher frequency of this variant. It occurs in the
Baggara and especially in the Rashaayda, both of
which, as evidenced by the mtDNA data, have a
relatively low African admixture; both groups are
also highly dependent on nomadic pastoralism and
milking. The correlogram analyses of the –13,915*G
population frequencies (Indian, Chad, and Nigerian
data excluded) show that a clinal pattern cannot
be rejected (Figure 3). In fact, there is a depression
signal of a cline that afffects only a part of the study
area (see significant autocorrelation coeffficients
present for both the highest and lowest Moran’s
I-values in Figure 3).
Aside from the –13,915*G variant, we have
detected other mutations within the analyzed
segment of the MCM6 gene (see Table 3). The
“European” –13,910*T was found in two eastern
Yemeni samples in Hadramawt and Soqotra, and
in the Baggara and Shuwa. On the other hand, in
Yemeni samples the “African” LP-associated variants
–13,907*G and –14,010*C were revealed to
come from the western part of the country, which is
geographically close to Africa. In Africa, –13,907*G
was found only in sedentary Arabs from Sudan.
The Shuwa Arabs show two additional mutations:
–13,965*G and –14,107*A. Moreover, –14,009*G was
observed quite frequently in all analyzed samples
of the African Arabs (except in the Rashaayda),
and in one case from the western part of Yemen.
Last but not least, one Egyptian from el Hayz carries
an additional –14,042*G mutation. All these
mutations were detected in heterozygote state
only (Table 3).
Interestingly, some of the variants just described
were present together in the same individual, showing
three combinations in total. The
combination of –13,915*G and –14,009*G was seen
twice in the population of the Baggara Arabs and
once in the population of the Sudanese Arabs.
A combination of the –13,910*T and –13,915*G
variants was seen in three populations: once in
the sample of Baggara Arabs, once in the Shuwa
Arabs, and once in the Yemeni 4 (YHA) group. One
individual from the Yemeni 1 (YAC) population also
revealed a case of the combination of –14,010*C
and –13,915*G.
Table 3. Counts (in Parentheses) and Frequencies of Mutations Found in the Analyzed Segment of MCM6 Gene Population –13,915*G –13,907*G –13,910*T –13,965*G –14,009*G –14,010*C –14,042*G –14,107*A YAC (56) 0.651 (1) 0.012 (1) 0.012 YTI (78) 0.591 (1) 0.015 (1) 0.008 YHG (42) 0.618 YHA (21) 0.263 (3) 0.038 YSO (76) 0.585 (5) 0.046 RAS (80) 0.769 ARS (7) 0.076 (1) 0.022 (11) 0.130 ACH (25) 0.463 (1) 0.019 (2) 0.037 ASW (7) 0.066 (9) 0.085 (1) 0.009 (1) 0.009 (1) 0.009 ELH (1) 0.015 (4) 0.059 (1) 0.015 |
|
|
|
Post by Admin on Oct 27, 2020 4:26:21 GMT
Discussion
It has been believed that the ancestors of the Yemeni
people were (in contrast to the Bedouins of
Saudi Arabia) sedentary cultivators (Chelhod 1984).
However, we have shown here that LP, which both
enables fresh milk consumption in larger quantity
and supports the hypothesis of the coevolution of
genes and culture (Gerbault et al. 2009; Holden and
Mace 2002), occurs with a relatively high frequency
throughout Yemeni territory (perhaps except in the
Hadramawt region). Although the original food production
system in southern Arabia is not yet
understood in full detail, there are clear archaeological
indications of the existence of cattle keepers
in Yemen at the beginning of the Neolithic. In fact,
a cattle-keeping population has been discovered
(Fedele 2009) at the Early Neolithic Yemeni settlement at
Chawlan, in the at-Tiyal area to the east of
Sana’a (de Maigret 2003).
In the eastern part of Yemen (Hadramawt),
the first traces of pastoralism are even more
pronounced, as documented by 6,400-year-old
cattle sacrifices found in Kheshiya (McCorriston
et al. 2012). Such findings underline the economic
and social importance of cattle, and likely also of
milking practices. Archaeological evidence also
reveals that, due to climatic deterioration in the
Middle Holocene and its associated degradation
of natural pastures, the original Hadramawt herders later
started to concentrate in a more limited
area and established the first irrigation systems to
maintain pastures, enabling and with time leading to the
cultivation of some plants (Harrower
2008). These changes subsequently led to a division within
the southern Arabian population into
nomadic pastoralists and settled farmers. In fact,
such archaeological findings match our genetic
data showing that LP-associated variants are found
throughout all Arabian populations, with the only
exception being those found in the Hadramawt.
This discrepancy can be explained by the repeated
waves of out-migration and back-immigration experienced by
this specific region of southern Arabia
during the last 500 years (Manger 2010); thus, it
is not surprising that the region today harbors an
uncommonly high level of sub-Saharan mtDNA
haplogroups (Černý et al. 2008).
The demographic history of the Arabian pastoralists is closely
linked with the rise of South Arabian caravan kingdoms
and the flourishing trade
with Mediterranean civilizations. Pastoralists took
an active part in this business, as domestication of
the camel (Breton 1999; Retsö 1991) allowed them
to export frankincense and other items across the
barren desert of central Arabia. After the collapse
of South Arabian civilization in the sixth century
AD, some of the Arabian herders lost their jobs and
were forced look for new opportunities outside
of Arabia. Their dispersal to Africa is linked with
the spread of Islam and is carefully recorded in
archaeological and historical sources (Levy and
Holl 2002; Zeltner 2002).
The most important migration of the Arabian
pastoralist tribes to Africa was associated with
the conquest of Egypt in seventh century AD
(Zeltner 2002), but deeper penetration into the
continent was prevented for several centuries by
the Christian kingdoms of Nubia. It was only after
the Mamluks had conquered the Nubian Dongola
in the beginning of fourteenth century that the
Arabian pastoralists could continue with their
further migration into the African interior. By the
beginning of the sixteenth century they had finally
dispersed along the Blue and White Nile, as well as
westward to the Lake Chad Basin. It is also known
that Arabic tribes appeared between Lake Fitri in
Chad and Bahr el Ghazal in Sudan in that century,
in the area once called Shuwa (Seignobos 2000).
Some tribes reached Baguirmi in the mid-sixteenth
century and the eastern shores of Lake Chad at
the beginning of the eighteenth century, crossing
the Shari River shortly thereafter. Immigration of
Arabic-speaking pastoralists to Africa was, however,
likely a continuous process, as is evidenced by the
Rashaayda Bedouins, who entered Africa only very
recently in the 1860s (Young 1996).
The above-described wandering of the Arabic
tribes through Africa has been revealed by both
archaeological findings and historical documents
and is consistent with our observed frequencies of
–13,915*G: its prevalence and partly clinal pattern
within the Arabian Peninsula and closer-lying parts
of Africa and patchy distribution within broader
Africa. Interestingly, while the recent Arabic
immigrants (the Rashaayda) bear only the –13,915*G
variant, groups arriving earlier have gained a more
varied repertoire of LP-associated mutations that
might have been introduced by other African nomads.
This is especially the case for the –14,009*G
variant, which might have been introduced into the
Arabic pastoralist population in Africa by Somali
camel herders (Ingram et al. 2009). The Shuwa,
who reached as far as the Lake Chad Basin, bear
–13,910*T; this variant might have been introduced
into their population by possible contacts with the
Fulani, the only sub-Saharan African population
where this “European” variant has been detected
in higher frequency (Lokki et al. 2011; Ranciaro et
al. 2014).
In conclusion, our data contribute to the hypothesis
that –13,915*G’s potential place of origin is
in Arabia (Enattah et al. 2008). The high frequency
of LP in Arabia, and even in the southern locations
where plant cultivation is more significant than
pastoralism, is consistent with archeological records
describing a Yemeni Early Neolithic mode of subsistence
(Fedele 2009; McCorriston and Martin 2009).
We show that the non-Arabic-speaking people on
Soqotra bear a frequency of the –13,915*G variant
similar to that found on the Arabian mainland,
which in fact suggests that this island had likely
been colonized by people already bearing this variant;
indeed, a relatively recent colonization of this
specific island around 6 kya has been suggested
by mtDNA analyses (Černý et al. 2009). Furthermore,
the decreasing gradient of the frequency of
–13,915*G among Arabic-speaking groups in African
Sahel and its virtual absence in South Africa (Breton
et al. 2014; Ranciaro et al. 2014) supports a model
of migration, sedentarization, and admixture with
local African populations, as is evidenced in the
Shuwa Arabs (Levy and Holl 2002).
Our study also presents the highest frequency
of the –13,915*G variant so far recorded in the
genetic literature, attaining 76.9% in the Rashaayda
Bedouins, who, while today living in Eastern Sudan,
have descended from Arabian ancestors that arrived in
Africa only some 150 years ago. The ancestors of the
African Rashaayda originally probably
lived in the region of Hejaz lying in western Saudi
Arabia close to Mecca. In fact, there are many tribes
in Arabia bearing the name Rashaayda, but all
claim to have originated in Hejaz. Interestingly,
further support of the Hejaz origin of the African
Rashaayda is provided by the similar features of
their female costumes (Young 1996).
|
|

