|
|
Post by Admin on May 28, 2022 17:51:24 GMT
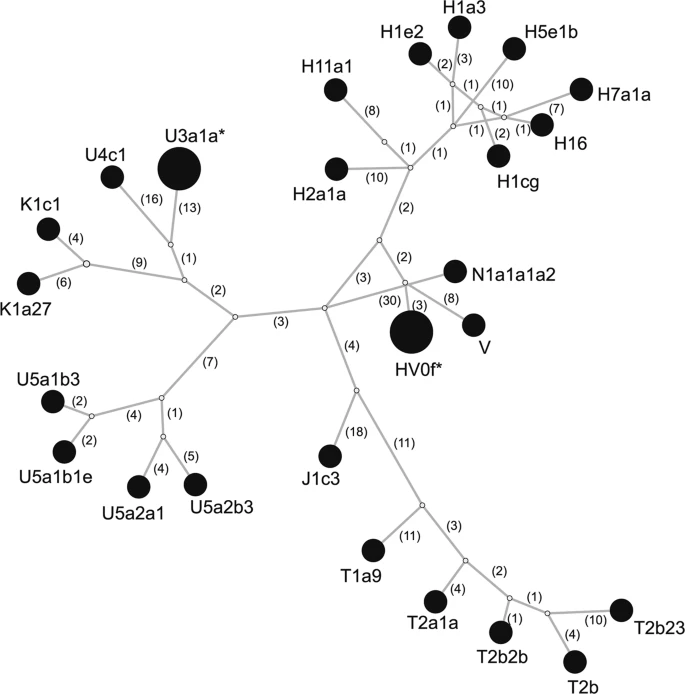
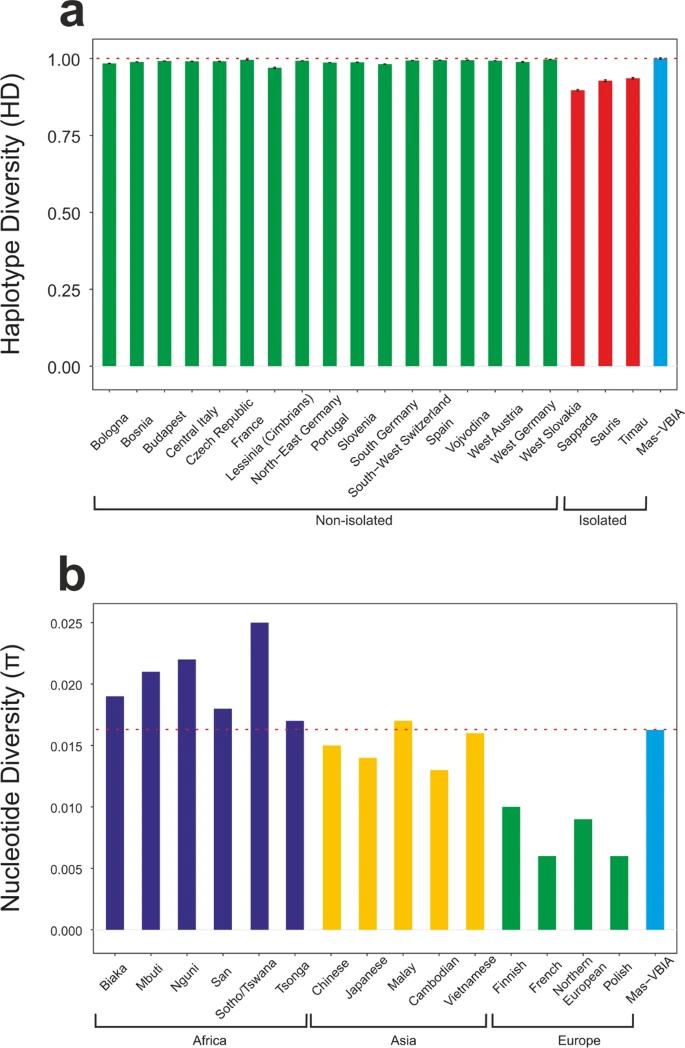
Genetic homogeneity of the Mas-VBIA group To assess whether the analyzed group of people formed a closed homogenous or opened diversified society, we determined the genetic diversity of the Mas-VBIA. To this end, we compared the full length mtDNA sequences obtained for all 27 individuals (Supplementary Table S4). We found 2 pairs of individuals who had identical mtDNA sequences (PCA0088, PCA0090; PCA0094, PCA0100). Interestingly, persons with the same mitochondrial genomes were buried far from each other (Supplementary Fig. 1). We visualized all mtDNA haplotypes from the MAS-VBIA population with the Median Joining Network (MJN) (Fig. 2). Figure 2  Median Joining Network of 27 individuals from Mas-VBIA based on full mtDNA sequences. Each node corresponds to a haplotype determined for a unique mtDNA sequence. Numbers in brackets show numbers of nucleotide differences between haplotypes. Stars mark haplotypes represented by two individuals with identical mtDNA sequence. Next, using Arlequin ver. 3.5.1 software27, we determined the levels of haplotype diversity (HD) based on two fragments of the HVS (hypervariable sequence) region of mitochondrial genome (regions: HVS-I between nucleotide position (np) 16033 and 16365 and HVS-II between np 73 and 340) (Fig. 3a, Supplementary Table S5) and nucleotide diversity (π) based on the fragment of HVS-I region (between np 16000 and 16410) (Fig. 3b, Supplementary Table S6). The HD level calculated for the Mas-VBIA (1.0000 +/− 0.0113) was in the range of high values currently observed for the contemporary, non-isolated European populations. The level of π determined for the Mas-VBIA (0.016263 +/− 0.008846) was high and outside the range of values reported for the present-day European populations (0.009) and in the range of the values reported for contemporary Asian populations28. Thus, the results of all three analyses of MJN, HD and π showed that the Mas-VBIA was a genetically highly diverse population. Figure 3  Intrapopulation genetic diversity estimates: (a) Haplotype Diversity; (b) Nucleotide Diversity. Red dotted line marks the estimate value of diversity of the Mas-VBIA. To exclude the possibility that the presence of two potentially maternally related individuals in the relatively small tested group will affect the results of our consecutive analyzes, we removed the two individuals from the tested group - one from each pair with identical mtDNA sequences. |
|
|
|
Post by Admin on May 29, 2022 17:47:10 GMT
Matrilineal ancestry of the Mas-VBIA and its contribution to the demographic history of Europe
mtDNA haplogroup frequency
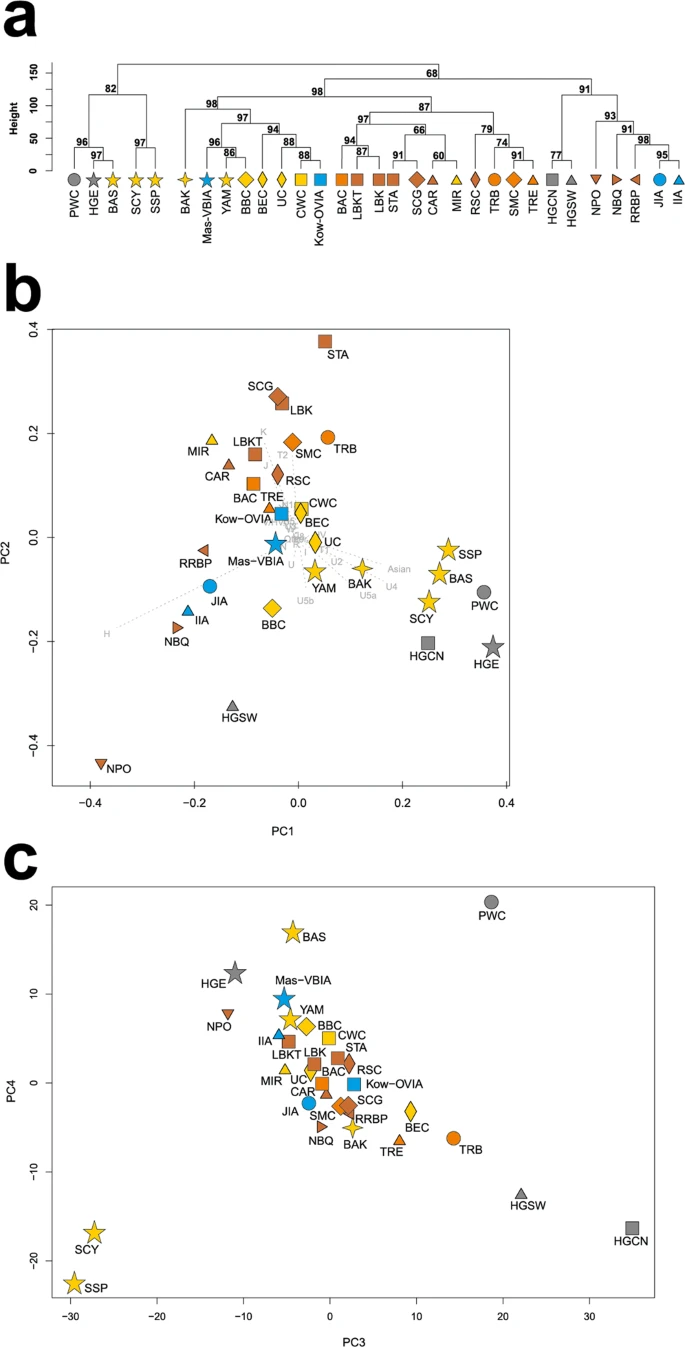
mtDNA haplogroup H was the most common in the Mas-VBIA (32%); T2 and U5a were the second most common (16% each). To place the Mas-VBIA in the Central European space-time, we compared mtDNA haplogroup frequencies within the set of populations that lived in this region from the Mesolithic until the present (Central European Population Transect (CEPT), for details, see Materials and methods, Tables 2 and S7–S8). The results of unsupervised hierarchical clustering (Ward’s method with Manhattan distance) of the CEPT (Fig. 4) were generally compatible with the known chronology of the formation of the genetic structure of the Central European population. The first to be separated from other populations were the Hunter Gatherers from Central and North Europe (HGCN). Next, we observed a divergence of the studied populations into 2 groups. The first one consisted of Early Neolithic (EN) populations [Starčevo culture (STA), Linearbandkeramik in Transdanubia (LBKT), Linearbandkeramik population from Central Europe (LBK), Rössen culture (RSC), Schöningen Group (SCG)] and MN populations [Baalberge culture (BAC), Salzmünde culture (SMC)]. The second group consisted of LN/EBA populations [BEC (Bernburg culture), CWC, Bell Beaker culture (BBC), Unetice culture (UC)] and post-EBA populations [Jutland peninsula population from IA (JIA), Kow-OVIA, Mas-VBIA and Central European Metapopulation (CEM)]. Within this group, the JIA and CEM formed a separate sub-clade (alpha = 0.93). In addition, the remaining LN/EBA populations split into the two sub-clades. The first one was formed by the Mas-VBIA and BBC and the second by the BEC, UC, CWC and Kow-OVIA.
Table 2 Published reference ancient mtDNA data and populations abbreviations.
Abbreviation Population Time period
HGCN Hunter Gatherers Central North Europe 15400–4300 BP
HGSW Hunter Gatherers South West Europe 12000–5000 BP
HGE Hunter Gatherers Eastern Europe 15000–4500 BP
STA Starčevo culture 8200–7450 BP
LBKT Linearbandkeramik culture in Transdanubia 7600–6900 BP
LBK Linearbandkeramik culture in Central Europe 7500–6900 BP
RSC Rössen culture 6600–6200 BP
SCG Schöningen group 6100–5900 BP
BAC Baalberge culture 5900–5400 BP
SMC Salzmünde culture 5400–5100 BP
BEC Bernburg culture 5100–4600 BP
CWC Corded Ware culture 4800–4200 BP
BBC Bell Beaker culture in Central Europe 4500–4200 BP
UC Unetice culture 4200–3150 BP
PWC Pitted Ware Culture 5200–4300 BP
CAR Cardial/Epicardial culture of the Iberian Penisula 7400–5700 BP
NPO Portuguese Neolithic population 7200–5000 BP
NBQ Neolithic population from Basque Country and Navarre 8100–7100 BP
TRB Funnel Beaker culture 6300–4800 BP
TRE Treilles culture 7000 BP
BAS Bronze Age Siberia 4400–2800 BP
BAK Bronze Age Kazakhstan 4000–2600 BP
RRBP Gurgy ‘Les Noisats’ group 7000–6000 BP
MIR Iberian Chalcolithic El Mirador Burgos individuals 4500–4050 BP
JIA Jutland Iron Age 2500 BP - 400 AD
IIA Iberian Iron Age population 2800 BP - 50 AD
SCY Iron Age Scythian samples 2300–2600 BP
SSP Scytho-Siberian Pazyryk Culture 2400–2300 BP
YAM Yamnaya culture 5300–4600 BP
Kow-OVIA Oder Vistula Iron Age 0–200 AD
Mas-VBIA Vistula Bug Iron Age 100–300 AD
|
|
|
|
Post by Admin on May 29, 2022 21:14:51 GMT
Figure 4  Unsupervised hierarchical clustering with Ward method and Manhattan distance of haplogroup frequencies for the CEPT populations. P-values of the clusters are given as the percent of reproduced clusters based on 10,000 bootstrap replicates. Symbols indicate populations from Central Europe (squares and diamonds), Southern Scandinavia and Jutland Peninsula (circles), and East Europe/Asia (stars). Color shading of data points denotes to Hunter-Gatherers (grey), Early Neolithic (brown), Middle Neolithic (orange), Late Neolithic/Early Bronze Age (yellow), Iron Age (blue), and the present-day Central Europe Metapopulation (CEM, green). Abbreviations: Central/North European Hunter-Gatherers (HGCN), Starčevo Culture population (STA), Linearbandkeramik in Transdanubia (LBKT), Linearbandkeramik population from Central Europe (LBK), Rössen Culture (RSC), Schöningen Group (SCG), Baalberge Culture (BAC), Salzmünde Culture (SMC), Bernburg Culture (BEC), Corded Ware Culture (CWC), Bell Beaker Culture (BBC), Unetice Culture (UC), Jutland Iron Age (JIA), Kowalewko Oder and Vistula Iron Age (Kow-OVIA), Masłomęcz Vistula and Bug Iron Age (Mas-VBIA). To look wider on the Mas-VBIA ancestry and its relationship with other contemporary populations, we assembled selected ancient populations in the European Population Transect dataset (EPT) (for details, see Materials and methods, Tables 2 and S7), which, as previously described, was subjected to hierarchical clustering and additionally to PCA of the mtDNA haplogroup frequencies (Fig. 5a–c, Supplementary Table S9). The results of EPT clustering were consistent with those obtained for the CEPT. The Mas-VBIA was placed within central European LN/EBA group and was related closely with the BBC and YAM. The Kow-OVIA was also placed within the central European LN/EBA group but formed a clade with the CWC, UC and BEC (Fig. 5a). First, the two principal components of the PCA plot (Fig. 5b) positioned the Mas-VBIA near the center of the graph, closest to the Kow-OVIA but also close to the CWC, BEC, UC and YAM. The 3rd and 4th principal components (Fig. 5c) placed the Mas-VBIA in close proximity to the YAM and BBC and revealed the Kow-OVIA’s higher affinity to the BEC, CWC and UC, as supported by the hierarchical clustering. Figure 5  (a) Unsupervised hierarchical clustering with Ward method and Manhattan distance of haplogroup frequencies for the EPT populations. P-values of the clusters are given as the percent of reproduced clusters based on 10,000 bootstrap replicates; (b) Principal components 1 and 2 of the PCA on the haplogroup frequencies of EPT populations. Symbols indicate populations from Central Europe (squares and diamonds), Southern Scandinavia and Jutland Peninsula (circles), Iberian Peninsula (triangles), and East Europe/Asia (stars). Color shading of data points denotes to Hunter-Gatherers (grey), Early Neolithic (brown), Middle Neolithic (orange), Late Neolithic/Early Bronze Age (yellow) and Iron Age (blue). The first two principal components of the PCA display 48.4% of the total genetic variation. Each haplogroup was superimposed as component loading vectors (grey dotted lines) proportionally to their contribution. Abbreviations: Central/North European Hunter-Gatherers (HGCN), Southwestern European Hunter-Gatherers (HGSW), East European Hunter-Gatherers (HGE), Starčevo Culture population (STA), Linearbandkeramik in Transdanubia (LBKT), Linearbandkeramik population from Central Europe (LBK), Rössen Culture (RSC), Schöningen Group (SCG), Baalberge Culture (BAC), Salzmünde Culture (SMC), Bernburg Culture (BEC), Corded Ware Culture (CWC), Bell Beaker Culture (BBC), Unetice Culture (UC), Pitted Ware culture (PWC), Funnel Beaker culture (TRB), Jutland Iron Age (JIA), Cardial/Epicardial culture of the Iberian Peninsula (CAR), Portuguese Neolithic population (NPO), Neolithic population from Basque Country and Navarre (NBQ), Iberian Chalcolithic El Mirador Cave individuals (MIR), individuals from Iberian Iron Age period (IIA), Treilles Culture (TRE), Gurgy ‘Les Noisats’ group (RRBP), Bronze Age Kurgan samples from South Siberia (BAS), Bronze Age Kazakhstan (BAK), Yamnaya (YAM), Iron Age Scythian (SCY), Scytho-Siberian Pazyryk Culture (SSP), Kowalewko Oder and Vistula Iron Age (Kow-OVIA), Masłomęcz Vistula Bug Iron Age (Mas-VBIA); (c) Principal components 3 and 4 of the PCA on the haplogroup frequencies of EPT populations. To visualize the relationships of the Mas-VBIA group with contemporary humans, we placed it on a map showing the matrilineal genetic structure of present-day populations. The PCA of haplogroup frequencies observed in the Mas-VBIA and 73 extant worldwide populations (Supplementary Fig. S3, Supplementary Table S10) showed that the Mas-VBIA was located within a range of European genetic diversity. |
|
|
|
Post by Admin on May 30, 2022 18:39:48 GMT
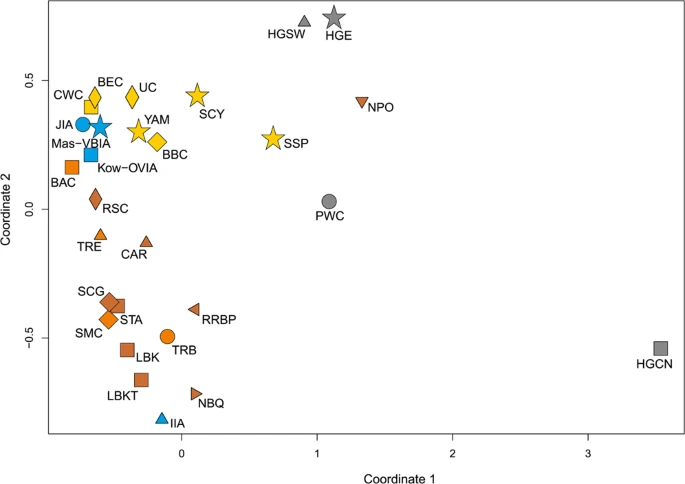
Genetic distances The relationships between the Mas-VBIA and the earlier and later European populations were also determined by measuring the genetic distances among them. Genetic distances were determined based on a fragment of the mtDNA HVS-I sequence (the region between np 16064 and 16400) (Supplementary Table S11). In the first step, we concentrated on the CEPT (populations from Central Europe from Mesolithic to present-day). The established fixation indexes (Fst) showed that the Mas-VBIA was most closely related to the BEC (Fst = 0, p = 0.7608) and RSC (Fst = 0, p = 0.6529). Both the BEC and RSC share a common archaeological history connected with the spread of the TRB culture. Similarly to the Mas-VBIA, the Kow-OVIA had small genetic distances to the BEC (Fst = 0, p = 0.748) and RSC (Fst = 0.0002, p = 0.567). Unlike the Kow-OVIA, which was closely linked with the JIA, the Mas-VBIA had smaller genetic distances to the LN CWC and BBC populations (Fst = 0, p = 0.5872; Fst = 0, p = 0.67342, respectively) than to the JIA (Fst = 0.00915, p = 0.3768). In the second step, we focused on the populations living in all of Europe from the Mesolithic to the IA. To this end, we selected 27 populations from the EPT, for which sequences of the mtDNA HVS-I region between np 16064 and 16400 (Table S12) were known for a considerable number of individuals. The calculated genetic distances (Supplementary Table S12) showed once again that the Mas-VBIA was the closest to the BEC (Fst = 0, p = 0.7418). Furthermore, the close connection to the Funnel Beaker cultural horizon was recapitulated with the low genetic distance between the Mas-VBIA and the TRB (Fst = 0, p = 0.6028). A small genetic distance was also found between the Mas-VBIA and the YAM (Fst = 0, p = 0.87892). At the same time, the genetic distance between the Mas-VBIA and the LBK was high (Fst = 0.02949, p = 0.0634). The results of the genetic distance analysis were visualized on the multidimensional scaling (MDS) plot (Fig. 6). In accordance with the established genetic distances, the MDS located the Mas-VBIA, CWC, BBC, BEC and YAM close together. Figure 6  MDS plot of Slatkin’s Fst values for EPT populations. Fst values were obtained for mtDNA HVS-I region (np 16064–16400). |
|
|
|
Post by Admin on May 31, 2022 17:49:04 GMT
The Mas-VBIA in the context of the processes shaping the genetic structure of the Central European population
In the next stage of our studies, we attempted to determine how the Mas-VBIA fits into the existing scheme describing the process of the formation of the genetic structure of the Central European population. For this purpose, we performed an Analysis of Molecular Variance (AMOVA). In the first step, we determined an optimal division of the populations from CEPT, excluding the HGCN and CEM. The division was considered to be optimal if the intragroup variability (Fsc) was minimal and intergroup variability (Fct) was maximal. Considering earlier observations made by other authors29,30, we allocated all EN/MN populations (STA, LBKT, LBK, RSC, SCG, BAC, SMC) to one group because of their high genetic homogeneity and analyzed 41 different combinations of populations’ groupings (Supplementary Table S13). We found that Fsc and Fct were optimal if the studied populations were divided into three groups: (STA, LBKT, LBK, RSC, SCG, BAC, SMC) + (CWC, UC, JIA) + (BEC, BBC, Mas-VBIA, Kow-OVIA). Importantly, we observed that the groupings were always better when the Mas-VBIA and Kow-OVIA were in the same group. This observation was not biased by the batch effect as samples from both cemeteries were sequenced separately. Moreover, particular samples were sequenced in multiple runs and in two independent laboratories. The obtained results suggest that the JIA had close relationships with the North-Central Europe populations (CWC and UC), whereas the Mas-VBIA was linked to the Funnel Beakers (e.g., BEC) and Bell Beakers.
Next, to determine to what extent particular populations contributed to the genetic structure of the contemporary Central European population, we performed an analogous analysis, but the studied group was extended by the CEM (CEPT with excluded HGCN). Once again, the populations of the EN/MN (STA, LBKT, LBK, RSC, SCG, BAC, SMC) were treated as one group, and we analyzed 91 combinations of the other fossil populations and the CEM (Supplementary Table S14). The combination of 3 groups (STA, LBKT, LBK, RSC, SCG, BAC, SMC) + (BEC, UC) + (CWC, BBC, Mas-VBIA, Kow-OVIA, JIA, CEM) showed the best optimization of Fsc and Fct values. Furthermore, clustering was always better if the CEM and IA populations did not form a separate group but were placed together with the CWC or BBC.
The results of the above analyses were consistent with our previous observations8 suggesting that the contribution of the particular populations to the genetic structure of present-day Europe is not fully consistent with the chronology according to which these populations inhabited Central Europe. For example, the Mas-VBIA, Kow-OVIA, JIA, BBC and CWC contributed more significantly to the genetic structure of present-day Europe than the UC.
mtDNA lineages
To get better insight into the processes that shaped the genetic structure of the studied population, we determined which populations gave rise to the haplotypes found in the Mas-VBIA (Supplementary Table S15). Our analysis showed that 44% of the mtDNA haplotypes came from EN populations. In this group, mtDNA haplogroups H and T2 were most frequent. Haplotypes that appeared in the LN and EBA were not frequently detected in the Mas-VBIA (12% and 6%, respectively).
A consecutive analysis of shared haplotypes31 (Supplementary Table S16) revealed that 78% of the haplotypes inherited by the Mas-VBIA from the LN/EBA or earlier populations were present in at least 1 LN/EBA population (BEC, CWC, BBC or UC), and 28% were present in all three CWC, BBC and UC populations. It was noteworthy that neither of the haplotypes inherited by the Mas-VBIA was uniquely shared only with the BEC. All haplotypes shared by the BEC and Mas-VBIA were also present in each of the remaining LN/EBA populations. Interestingly, though the Mas-VBIA showed a high genetic distance to the UC, it shared more haplotypes with the UC than with any other LN/EBA population. Additionally, the haplotypes shared uniquely with only one LN/EBA population were most frequently observed for the Mas-VBIA and UC. Here, however, it should be noticed that the UC is represented by a high number of individuals; thus, the chance of finding shared haplotypes was higher. Twenty-one percent of the haplotypes found in the Mas-VBIA were absent in any LN/EBA population.
|
|


