|
|
Post by Admin on May 16, 2023 17:41:50 GMT
 A new study by RCSI University of Medicine and Health Sciences, based in Dublin, Ireland, and Sequence Bio, a genomics and precision medicine company based in St. John's, Newfoundland and Labrador (NL), Canada, has produced the most detailed genetic analysis of people living in the Canadian province to date, demonstrating a unique founder population structure that could be used for the identification and study of health-related genetic variants. The study, titled "Newfoundland and Labrador: A mosaic founder population of an Irish and British diaspora from 300 years ago," has been published in Communications Biology. By studying the genetic profiles of 1,807 volunteering individuals from Sequence Bio's Newfoundland and Labrador Genome Project (NLGP), and comparing the resulting fine-scale genetic structure of NL to reference datasets for Ireland and England, scientists showed that a significant proportion of the European-derived population of NL can be traced back to settlers who primarily migrated from South-East Ireland and South-West England around three centuries ago. "In looking at the ways Newfoundlanders and Labradorians are genetically related to each other, and to present day Irish and English individuals, we were able to show that European ancestry in NL is mainly descended from Irish and English settlers in the time of the late 1700s to early 1800s," explains Dr. Edmund Gilbert, a Lecturer at the School of Pharmacy and Biomolecular Sciences in RCSI and FutureNeuro, the Science Foundation Ireland (SFI) Research Center for Chronic and Rare Neurological Diseases. Dr. Gilbert, the first author on the study, used well-characterized population reference datasets like the Irish DNA Atlas to link English and Irish ancestry in NL to specific regions in Ireland, and to track how social and geographical isolation influenced NL communities at the level of their DNA. Dr. Gerald Mugford, director of research at Sequence Bio commented on the study, "Through this expert collaboration with RCSI, we now have a much deeper understanding of the ancestry of the current NL population and the origins of genetic variants that could be meaningful for disease gene discovery in the province." Further analysis of the genetic data also shows multiple population bottlenecks, or reductions in population size, happening independently in the region around 300 years ago due to geographical isolation and tendency for people to settle with others from the same country of origin and religious affiliation. Professor Gianpiero Cavalleri, Professor of Human Genetics at RCSI School of Pharmacy and Biomolecular Science and Deputy Director of the SFI FutureNeuro Research Center, helped lead the comparative study of genomes from Canada, Ireland and England. He said, "The genetic analysis supports the historical accounts that around 25,000 European settlers came to NL in the 18th and 19th centuries, mainly from Ireland—predominantly Waterford, Wexford, south Kilkenny, southeast Tipperary, and southeast Cork—and from Dorset and Devon in England as well as fishing ports such as Dartmouth, Plymouth, or Southampton. "In the study, we could see that Catholic background in Newfoundland and Labrador is still today strongly associated with Irish genetic ancestry as is Protestant background with English genetic ancestry." Dr. Michael Phillips, the study's Senior Author commented, "Our findings support NL's population structure as a unique genetic landscape with founder effects." He also noted the potential clinical and health-related importance of these patterns. "Because NL resembles that of other isolated island populations, there may be an opportunity to study the genetic makeup of specific subpopulations in NL to identify rare genetic variants that contribute to the risk and severity of certain diseases." More information: Edmund Gilbert et al, The Newfoundland and Labrador mosaic founder population descends from an Irish and British diaspora from 300 years ago, Communications Biology (2023). DOI: 10.1038/s42003-023-04844-9 www.nature.com/articles/s42003-023-04844-9 |
|
|
|
Post by Admin on May 17, 2023 16:47:11 GMT
The Newfoundland and Labrador mosaic founder population descends from an Irish and British diaspora from 300 years ago
Abstract
The founder population of Newfoundland and Labrador (NL) is a unique genetic resource, in part due to its geographic and cultural isolation, where historical records describe a migration of European settlers, primarily from Ireland and England, to NL in the 18th and 19th centuries. Whilst its historical isolation, and increased prevalence of certain monogenic disorders are well appreciated, details of the fine-scale genetic structure and ancestry of the population are lacking. Understanding the genetic origins and background of functional, disease causing, genetic variants would aid genetic mapping efforts in the Province. Here, we leverage dense genome-wide SNP data on 1,807 NL individuals to reveal fine-scale genetic structure in NL that is clustered around coastal communities and correlated with Christian denomination. We show that the majority of NL European ancestry can be traced back to the south-east and south-west of Ireland and England, respectively. We date a substantial population size bottleneck approximately 10-15 generations ago in NL, associated with increased haplotype sharing and autozygosity. Our results reveal insights into the population history of NL and demonstrate evidence of a population conducive to further genetic studies and biomarker discovery.
Introduction
Newfoundland and Labrador (NL) is the most eastern Canadian province. It is comprised of Labrador on the Canadian mainland, and the island of Newfoundland located in the north Atlantic. The European-ancestry population is primarily derived from Irish and English settlers1 who came to NL in the 18th and 19th centuries2. This NL population was historically small, with a census reporting 74,094 individuals in 18362, but has expanded to approximately 520,000 (Statistics Canada) today. Historical records suggest that the Irish, predominantly Catholic settlers, came from communities in the southwestern Irish counties of Waterford, Wexford, south Kilkenny, southeast Tipperary, and southeast Cork3. In the case of the English, the mainly Protestant settlers can be traced back to the counties of Dorset and Devon as well as the fishing ports such as Dartmouth, Plymouth, and Southampton in southwestern England3,4. Prior to and after European settlement of the region several Indigenous Peoples including the maritime Archaic peoples, Mi’kmaq, the Innu and the Inuit, and Beothuk, inhabited areas within the modern Province5,6. The modern population of NL includes peoples of Indigenous ancestry, primarily the Inuit, Innu, and Mi’kmaq. The Inuit and Innu are mainly located within Labrador, and the Mi’kmaq are found within Newfoundland, both with some level of admixture with people of European ancestry4.
Migration of Catholic Irish and Protestant English settlers to NL peaked in the mid to late 18th century4. These migrants who settled into coastal communities (known as outports) were socially and geographically isolated from one another, rarely intermarrying and so experienced subsequent private or separate bottlenecks. This cultural and geographical isolation is mirrored in the genetic landscape of NL. Previous studies using blood antigen frequency or birth-record data found evidence of genetic isolation and elevated inbreeding coefficients5,7,8, though there is conflicting evidence of extended linkage disequilibrium1,9. These population characteristics have been successfully leveraged to identify both recessive and dominant Mendelian traits10,11,12,13,14. Recently, analysis of genome-wide SNP-array genotype data from 494 NL individuals confirmed evidence of genetic isolation in the NL population, and that the broad NL population structure could be described in terms of; (i) indigenous American ancestry and, (ii) Catholic versus Protestant background. However, with a set of 494 individuals, the extent of population structure within these three backgrounds was not explored in depth, nor the source of putative British and Irish ancestry examined.
NL is therefore a genetically understudied community, and potentially of great value to genetic mapping efforts. Isolated populations with a history of bottlenecks are valuable communities for genetic mapping efforts as founder effects increase the frequencies of rare clinically relevant variants15 as well as increasing average haplotype length and general homogeneity16. Such efforts have been realised in other genetically isolated populations16,17, including island communities such as Sardinia in Europe18, the Ryukyu Archipelago south of Japan19, or the Shetlands in northern Scotland15. As isolated populations are increasingly leveraged in the study of rare or ultra-rare genetic variation15, an appreciation of their fine-scale genetic landscape is needed to account for the increased stratification of rarer genetic variation20,21. Although haplotype-based methods have demonstrated fine-scale genetic structure in many populations including the ancestral source populations of Britain and Ireland22,23,24,25, such approaches are yet to be applied within the context of NL. Furthermore, applying haplotype-based approaches to the NL context could also reveal insights into the population’s demographic history and isolation26,27,28,29.
Given this context, we aimed to explore the non-Indigenous (European) settlement of the present NL population in unprecedented detail, studying a sample of 1807 individuals with NL ancestry from the Newfoundland and Labrador Genome Project (NLGP), together with ancestry source references from Britain and Ireland. We set out to; (i) characterise the fine-scale population structure in NL using haplotype-based methods and investigate how this structure relates to ancestry, religion, and geography, (ii) quantify the proportions of British and Irish ancestry in NL and map these to their regional sources in Britain and Ireland using ancestry references23,30,31, and finally (iii) characterise the extent that a history of bottlenecks has had on the haplotype diversity of NL compared to ancestral sources in Britain and Ireland.
|
|
|
|
Post by Admin on May 18, 2023 17:08:20 GMT
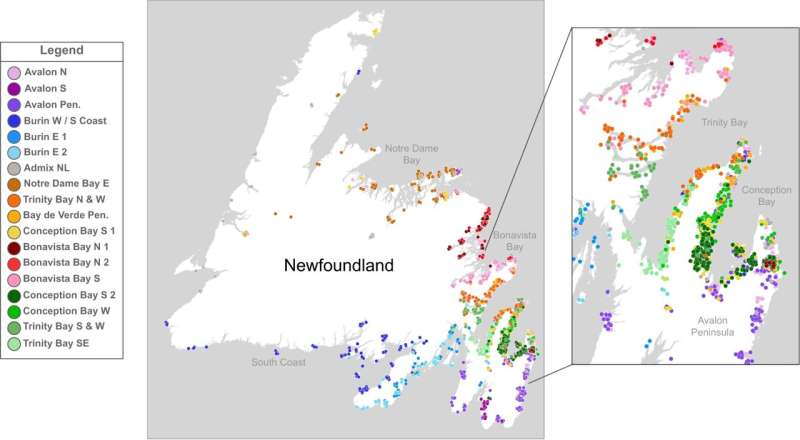
Results Newfoundland genetic structure To sample the genetic landscape of NL before modern economic migration in the latter 20th century onwards, we applied principal component analysis (PCA) to genotype data from 2446 participants from the Newfoundland and Labrador Genome Project (NLGP—Sequence Bioinformatics, Inc) and world-wide ancestry references from HGDP or KGP3 (see Supplementary Figs. 1–2). We identified and defined NLGP individuals of “NL ancestry” as individuals who occupied the same ancestry space as either European or Indigenous American ancestry. We further performed sample and marker QC (see Methods), leaving a core dataset of 1807 NL individuals (the “NL1,807” dataset) and 685,221 common SNPs for further analysis. To investigate the fine-scale genetic structure of NL, we performed haplotype-based clustering using fineSTRUCTURE32 to cluster individuals based on their haplotype sharing, as quantified by the ChromoPainter co-ancestry matrix. fineSTRUCTURE analysis identified 22 discrete clusters which summarise fineSTRUCTURE’s 74 clusters from its final maximum a posteriori (MAP) state. This k = 22 level of clustering combines smaller, difficult to interpret, clusters together to summarise the predominant fine-scale structure present in NL (Fig. 1a). The 22 clusters are further grouped in a dendrogram, organising clusters that share excess haplotypes together on shared branches. Most clusters show geographical stratification (Fig. 2 and Figs. S3-8 for individual plots) as well as religious stratification (Fig. 1b, Supp Data 1). The clusters exhibit comparatively high genetic differentiation, as measured by FST (average FST: 0.00206, min FST: 0. 00016, max FST: 0.00429; Supp Data 2), for example an order of magnitude higher than what is found between equivalent fineSTRUCTURE-cluster estimates from Ireland or England (FST: 0.0003, or 0.0003 respectively)23. Measuring connectivity with average sharing of IBD segments supports this differentiation with comparatively low sharing between clusters not on the same fineSTRUCTURE branch (Supp Fig. 8) We further measure connectivity by recording this sharing as a network and find additional support of wide sharing amongst northern Avalon, Trinity and Conception Bays with outlying regions less connected to this central region (Supplementary Fig. 9). Fig. 1: Genetic structure of Newfoundland and Labrador. 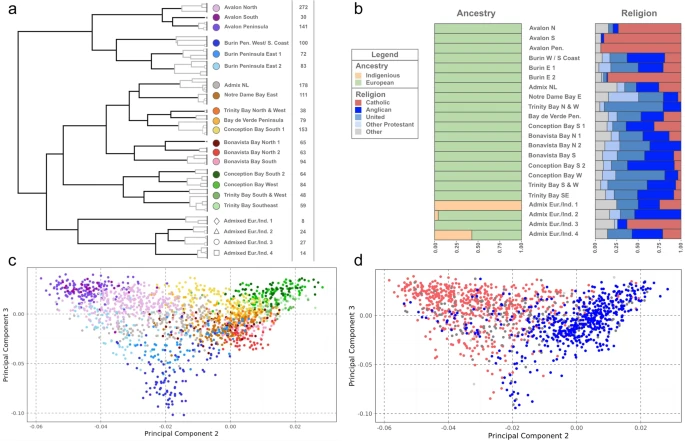 a Dendrogram of the fineSTRUCTURE final MAP state, showing 22 summarising clusters of NL membership. Solid branches indicate the 22 cluster branches, with grey branch-lines showing merged clusters within each of the 22 clusters. fineSTRUCTURE clusters are colour and shaped coded to reflect grouping on adjacent branches, with labels reflecting common geographic birthplace of members’ grandparents. Cluster sizes shown to the right of cluster labels. b The proportions of genetic ancestry groups and religious background in each of the 22 clusters, shown in the order of A. c The second versus the third principal components of the ChromoPainter co-ancestry matrix, with individual colour and shape coded according to fineSTRUCTURE cluster membership. d The second versus the third principal components of the ChromoPainter co-ancestry matrix, with individual points colour coded to religious background; red indicating Christian Catholic, blue indicating Christian Protestant, and grey indicating other or unknown. All panels were plotted using the statistical computing language R63 and the packages ggplot2 and rworldxtra. |
|
|
|
Post by Admin on May 29, 2023 18:03:24 GMT
Fig. 2: Genetic landscape of Newfoundland and Labrador. 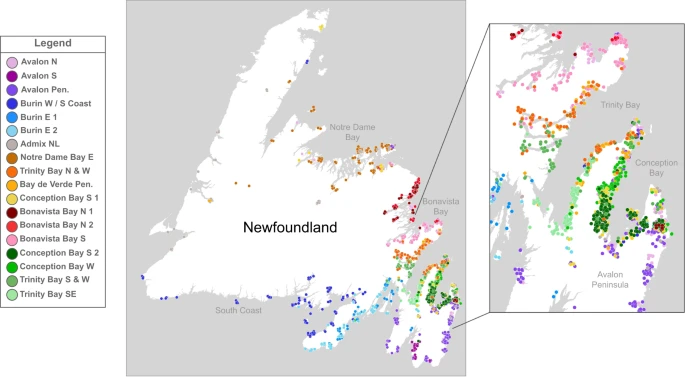 Map of the grandparental birthplaces of individuals with colour and shape coded according to fineSTRUCTURE cluster. A small jitter has been introduced to aid legibility and preserve anonymity. An insert shows individual details of the Trinity and Conception Bays. Panel was plotted within photoshop, with geography boundary data sourced from Tableau. We compared this structure to previous samples of NL ancestry reported by Zhai et al4. We found evidence that both datasets have the same individual four separate times (Supplementary Fig. 10) and found that our sample of NL-ancestry captures the variation in population structure (Supplementary Fig. 11) and haplotype diversity (Supplementary Fig. 12). Unfortunately due to genotyping platform differences, the common-marker-set was low (167,968 SNPs), therefore we decided not to incorporate the Zhai et al.4 data into the wider analysis. The first split in the fineSTRUCTURE dendrogram separates individuals in the south-east of NL with grandparents predominantly from either Burin or the Avalon peninsula into six clusters (Fig. 2). Indeed, individuals with ancestry from south-eastern NL appear to be genetically distinct from the rest of NL in PCA (Fig. 1c) as well as clustering (Fig. 1a). When we compared the proportion of individuals in each fineSTRUCTURE cluster associating with various Christian denominations, we found four out of the six clusters (Fig. 1b, d) show high proportions of Catholic background. There are significant differences of religious background between genetic NL clusters as measured by Χ2 test (p = 0.00049), in agreement with previous work4. These differences are largely driven by Catholic membership within the Avalon peninsula (the Avalon Pen. and Avalon N clusters), whose residuals contribute approximately 22% of the overall Χ2 statistic. Furthermore, PCA of the ChromoPainter co-ancestry matrix supported this observation by separating individuals with a Catholic or Protestant background along PC2, echoing previous observations4 (Fig. 1d, Supplementary Fig. 13). Evaluating median IBD-sharing versus median distance between grandparental birthplaces for each non-Indigenous-ancestry (see below) pair of NL cluster, we see evidence that IBD shared between clusters of the same Christian denomination (Catholic or Protestant) is higher than between different Christian background (Supplementary Fig. 14) at the same geographic distance—despite low sample size of clusters. This signal is repeated specifically in the Burin peninsula (Supplementary Fig. 15) where the Burin E 1 and Burin E 2 clusters are interspersed. The other major branch in the fineSTRUCTURE dendrogram separated out clusters of the remaining NL individuals and those with putative Indigenous ancestry (Fig. 1a, b). Individuals in this branch cluster with world-wide Indigenous American ancestry references in PCA (Supplementary Fig. 1), They further separate from other NL individuals along the first PC in NL-only PCA (Supplementary Fig. 16). Clusters Admix Eur./Indig. 1 and 4 specifically present higher proportions of American ancestry components in an supervised ADMIXTURE33 analysis using KGP3 ancestry references assuming k = 5 ancestry components (Supplementary Fig. 17). This ancestry component is highly correlated with the KGP3 projected PC three (Pearson r = 0.91, p = <2 × 10⁻¹⁶). The two remaining clusters do not exhibit elevated levels of this component, but are grouped with putatively Indigenous ancestry clusters, and therefore difficult to further interpret. As our focus was to characterise the genetic structure of NL arising from the non-indigenous European settlers and given the lack of appropriate North American Indigenous references in addition to the small number of participants in these clusters (4% of the cohort), we made no further effort to characterise indigenous ancestry in subsequent analyses and focussed analysis on the remaining European-descent 18 clusters. Beyond the south-eastern branch of the dendrogram, clusters demonstrate fine-scale structure among predominantly Protestant communities. These clusters align strikingly with the geographic features of individual NL bays. For example, the north-eastern Trinity and Conception Bays exhibit population structure not only between one another (Fig. 2) but also within the same bay (Supplementary Figs. 6 and 8). This picture is similar in the northern bays of Bonavista and Notre Dame as well. FST distances between these clusters show substantial differentiation between the neighbouring communities, consistent with genetic isolation (Supplementary Data 2). This fine-scale structure arranged within individual bays is echoed in supplemental analysis where we estimate migration surfaces from discrepancies between genetic and geographic distance using the EEMS program34 (Supplementary Note 3). Within most NL bays, this fine-scale structure is interpreted as wide areas of gene flow barriers, supportive of a landscape characterised by substantial genetic differentiation given the small geographic distances involved (see Supplemental Note 3 for further discussion). While most of these clusters are largely Protestant in religious background, there are subtle differences in denomination (Fig. 1b). The large cluster of individuals with grandparents from Trinity Bay, Trinity Bay N&W, show a high proportion (68%) of United Church of Canada background, as does the Conception Bay W cluster (57%), compared to an average of 24% elsewhere. Considering the United Church of Canada post-dates settlement, this could reflect specific communities preferentially favouring one denomination. Elsewhere, the Admix NL cluster contains individuals with recent genealogies from across the island, and whose average copying vectors from the ChromoPainter coancestry matrix suggests haplotype sharing with different clusters across NL (Supplementary Fig. 18). Further, using the dimension-reduction methods UMAP and t-SNE35, these individuals co-locate across the space of NL individuals (Supplementary Fig. 19-20). We infer, therefore, that the Admix NL cluster likely captures individuals with a mix of ancestors from across NL grouped together through fineSTRUCTURE’s clustering algorithm. This mixed cluster could be due to modern economic movement in the 20th century, where communities prior to the 20th century were typically isolated. We observe a similar copying profile in the Avalon N cluster (Supplementary Fig. 18), which could represent the urban admixture in the metropolitan area of St John’s, the province’s largest city which is located to the north of the Avalon peninsula. |
|
|
|
Post by Admin on May 30, 2023 18:49:51 GMT
Newfoundland settler ancestry The relative ancestry contributions from Irish and British source populations to different NL communities is largely unknown, but assumed to correlate with historical records of settlement3 and Catholic/Protestant religious background4,36. To elucidate this, we used IBD-segment sharing patterns (see Methods) on a combined dataset of 1807 individuals of NL ancestry and 4,408 ancestry reference individuals from Britain and Ireland, 1,808 of whom have geographic annotation (see Supplementary Fig. 25–26 for PCA-based decomposition of this dataset). Identity-by-descent (IBD) segments are identical tracts of an ancestral haplotype shared between two individuals, shared due to common descent from a common ancestor. Due to this descent, IBD-segments are informative of both population structure37,38 and history27,28,39. We first identified sub-communities within Ireland and Britain using IBD sharing network clustering (see “Methods”). We identified 26 IBD-clusters across Ireland and Britain that confirm previous fineSTRUCTURE-based clustering patterns (Fig. 3a). With this set of regional Irish and British reference clusters, we then leveraged an extension of a previously reported nnls-based approach22 to model the proportions of IBD sharing between target and source clusters as estimated ancestry profiles. Fig. 3: Irish and British ancestry in Newfoundland and Labrador. 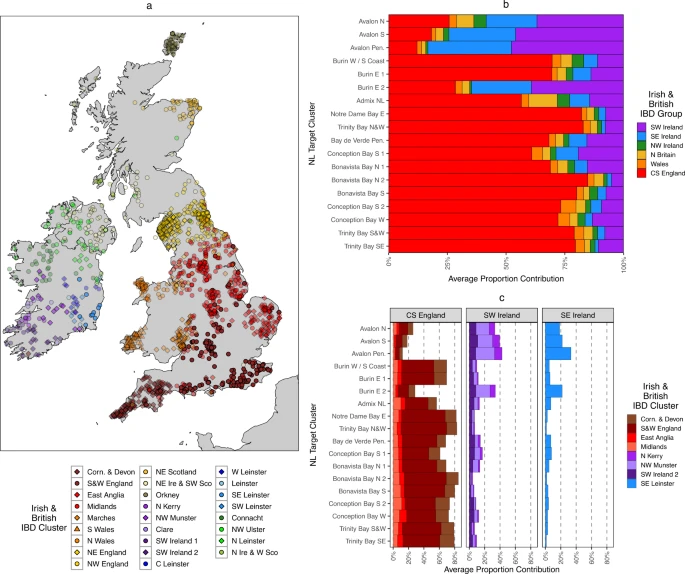 a Map of Irish23 and British22 individuals placed according to recent mean ancestral birthplace, colour and shape coded according to IBD-network clustering. Colours are used to group hierarchically related clusters together (see “Methods”). A slight transparency for individual points has been introduced proportional to the maximal proportion that each cluster contribute to any one NL cluster, with great contributors having less transparency. b The summed proportions of the estimated ancestry proportions calculated from Irish or British IBD-segments shared with NL. Contributions from individual IBD clusters are summed together in groups according to Irish or British region. c Individual Irish or British IBD cluster contributions to NL ancestry proportions, showing only clusters that contribute >5% to any one NL cluster. All panels were plotted using the statistical computing language R63 and the packages ggplot2 and rworldxtra. Historical records suggest that the European settlers of NL were predominantly from south-eastern Ireland and south-western England3. To formally assess this mixture, we only considered IBD-segment sharing between NL individuals and Irish or British reference individuals, further considering IBD segments >3 or <15 cM in length (thereby capturing recent genealogical relationships). Our rationale being that if different NL clusters carry different proportions of Irish or British ancestry, this will differentiate in the amount of IBD segments that they carry—thus creating different copying profiles. We estimated the average IBD contribution from each Irish or British source IBD-cluster to each NL fineSTRUCTURE-cluster target, as estimated by the nnls method. We first summed the contributions from general Irish or British regions, such as the south-west of England, or southern Ireland (Fig. 3b, Supplementary Data 3). The results showed substantially different profiles within NL, which are largely driven by either English or southern Irish ancestry contributions. The NL clusters with a high proportion of Catholic background (typically from the Avalon peninsula) are significantly associated with increasing Irish contribution (Welch Two-Sample test p = 0.009), and in general a high proportion of individuals with a Catholic background are associated with a high proportion of southern Irish ancestry (Pearson r2 = 0.95, p = 7e−12) (Supplementary Figs. 27–28). Next, we investigated if any specific IBD-cluster of Irish or British individuals were driving these English/Irish signals. Considering individual source clusters that contribute substantially to any one NL target cluster (i.e., >5%), we indeed find specific regional affinity within the English and Irish ancestry components (Fig. 3c). The English component is driven by the S&W England cluster, as well as Corn. & Devon. The Irish component is largely driven by clusters with individuals who have recent genealogical ancestry (i.e., from the 1850s) from the Wexford and Waterford regions of southern Ireland, primarily N&W Munster and SE Leinster. Both these English and Irish contributions to Irish-British IBD-segment sharing with NL are strikingly supportive of historical records which show the migrants who migrated to NL can be traced back to communities from these regions in Britain and Ireland3. Moreover, the contributions from each individual Irish/British cluster to the Irish or British ancestry profile in NL are in similar proportions across NL clusters. This is suggestive of a single source of the Irish and British ancestry in NL, i.e., that the Irish or British ancestry in NL is not from multiple waves from different regions in Ireland or Britain. The sharing signal in the southwest of NL of southeast Irish haplotypes is further supported in an unsupervised form of the nnls method where we consider each NL or Irish-British cluster as a mixture (Supplementary Fig. 29) of shared IBD (separately shown in Supplementary Fig. 30) from any other NL or Irish-British cluster. Results show that whilst most NL clusters predominantly share IBD-contributions from other NL clusters, reflective of their shared ancestry, some clusters such as Burin E 1 or Avalon Pen. still present substantial ancestry contributions from the N&W Munster and SE Leinster clusters. Furthermore, we evaluated this mixture of Irish and British haplotypes with the fastGLOBETROTTER algorithm, whose mixture model agrees with an Irish ancestry source best represented by N&W Munster and SE Leinster (see Supplementary Note 6). |
|

