Post by Admin on May 31, 2023 18:23:01 GMT
Evidence of population bottleneck and homogeneity
Existing literature from historical3, clinical1,10,11,12,13,14, and population genetic studies4 suggests evidence of a population bottleneck in the European settlement of NL. Furthermore, recent work has shown that island communities tend to experience stronger founder effects40. Therefore, we set out to characterise the magnitude of the NL founder effect using the NL1,807 dataset and comparing this with European source populations.
We first sought to estimate the historical effective population size (Ne) of NL to provide insight to past population bottlenecks. Using our IBD segment sharing data, we applied IBDNe27 to estimate historical Ne in NL clusters >100 individuals in membership, comparing to Irish and British regions (see Methods and Supplemental Note 7 for evaluation of segment accuracy). We observe (Fig. 4a, b, Supplementary Data 4–5) that both Ireland and Britain, and NL have experienced a period of exponential growth within the last 10 generations, consistent with previous estimates of other European ancestry populations41,42. Within Ireland and Britain, in general England has a higher Ne than Wales, Scotland, or Ireland, and Orkney. British estimates are consistent with previous estimations from the PoBI dataset42. Within NL we detect a consistent reduction of ancestral population size 15-10 generations ago across tested clusters. This population size reduction is several orders of magnitude lower to Irish or British equivalents at a comparable time-period. Ne estimates prior to this reduction are much larger than Irish or British estimates and have wide intervals, perhaps due to the impact of the settlement-bottleneck masking previous demographic profiles. NL regions associated with inter-regional admixture such as Avalon N or Admix NL have higher Ne estimates within the past 10 generations which would support evidence of an intra-NL admixture history.
Fig. 4: Evidence of bottleneck with Newfoundland and Labrador.
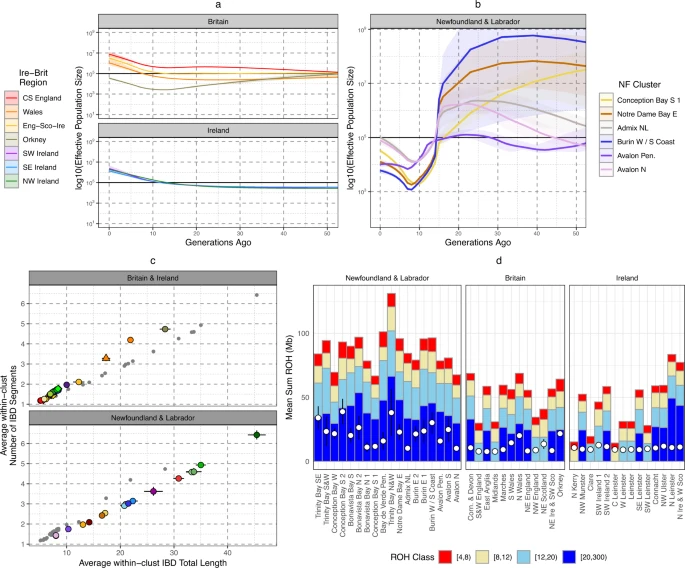
a The estimated historical Ne for Irish and British regions using IBD-segments and the IBDNe tool. Shading shows the 95% confidence intervals. b The estimated historical Ne for NL clusters >100 individuals in membership size. Shading indicates 95% confidence intervals. c The individual mean total length of Identity-by-Descent (IBD) segments shared with another individual placed in the same cluster, versus the mean number of IBD segments shared with individuals placed in the same cluster. Clusters are colour and shaped coded in the same system as Fig. 1. Irish and British clusters are plotted separately from NL clusters for legibility, and grey points indicate non-Irish and British (or non-NL) clusters. Error bars show the 95% confidence intervals. d The average total length of ROH within each NL or Irish and British cluster. The mean total length of ROH > 1.5 Mb for each cluster is shown by a hollow white circle (left y axis), or the proportion of the genome in ROH > 1.5 Mb in length (FROH—right y axis). Also shown are average total lengths of ROH in four length bins: (1) 4 cM ≤ROH < 8 cM, (2) 8 cM ≤ROH < 12 cM, (3) 12 cM ≤ROH < 20 cM, (4) 20 cM ≤ROH < 300 cM. Groups of clusters are coloured together, and error bars shows 95% confidence intervals. All panels were plotted using the statistical computing language R63 and the package ggplot2.
To complement this non-parametric modelling, we also recorded and compared sharing of IBD-segments (Fig. 4c, Supp Data 5) and Runs-of-Homozygosity (ROH) (Fig. 4d, Supplementary Data 6) within individual NL clusters and Irish or British clusters. We compared the relationship between average number of, and total length of, IBD-segments >3 cM and <15 cM shared between individuals placed in the same cluster (Fig. 4c) - this would reflect recent background community relationships and degree of isolation39. NL clusters consistently present higher levels of IBD sharing than British or Irish clusters, and in some cases (e.g., Trinity and Conception Bay clusters) higher than Orkney and Wales. When compared to Orkney or Wales, NL clusters share slightly fewer segments on average even though the total length shared is comparable. This suggests that the increase of relatedness in NL is more recent than Orkney or Wales, or that on average the Ne is overall higher in NL. Elevated IBD levels within NL are also supported by IBD sharing patterns between NL clusters compared to between Irish or British clusters (Supplementary Fig. 30–32), showing a general pattern of elevated haplotype sharing across the province as well as within specific genetic communities. Also supportive of a general elevation of haplotype sharing, ROH levels in NL are higher than the average in Ireland or Britain (Fig. 4d), with some NL clusters in Trinity Bay (for example) exhibiting particularly high levels. We also show the equivalent plots per-individual in Supplementary Figs. 62–64. This increase in ROH seems driven by longer ROH, consistent with relatively recent isolation. Some individuals show ROH levels consistent with recent consanguinity, i.e., more than 50 cM of genome covered by ROH > 20 cM in length. We show proportions of these individuals in each NL European-ancestry cluster in Supplementary Fig. 65, further demonstrating recent isolation.
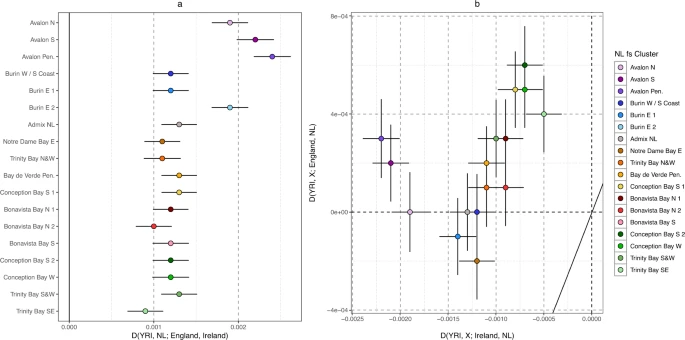
Finally, we further investigated the evidence of NL-specific genetic drift, to inform on the suitability of NL as an ideal study population for enrichment of rare functional variation. Utilising Patterson’s D statistic43, we first confirmed Irish-English comparative affinities in each NL fineSTRUCTURE cluster testing D (YRI, NL; Ireland, England) (Fig. 5a, Supplementary Data 7), and where an excess of Irish alleles would result in a negative test statistic. Whilst all clusters show a positive statistic, we find that the four NL clusters identified with Irish ancestry in our haplotype analysis (Fig. 3) are confirmed to present an excess of Irish alleles when compared to English references (Fig. 5a). Next, we tested for NL-specific drift by generating two D test statistics for each NL cluster which together would differentiate shared drift between NL clusters and; (i) Ireland/England, and (ii) other NL individuals (see “Methods”). An excess of NL allele sharing in both tests may indicate NL-specific drift independent of Ireland or England. We find that most NL clusters, but especially Conception Bay S 2 and Conception Bay W, present excess NL drift (Fig. 5b, Supp Data 8). In the case of Conception Bay S 2 and Conception Bay W this is associated with higher IBD sharing within those clusters, which would be consistent with an isolated community experiencing excess genetic drift.
Existing literature from historical3, clinical1,10,11,12,13,14, and population genetic studies4 suggests evidence of a population bottleneck in the European settlement of NL. Furthermore, recent work has shown that island communities tend to experience stronger founder effects40. Therefore, we set out to characterise the magnitude of the NL founder effect using the NL1,807 dataset and comparing this with European source populations.
We first sought to estimate the historical effective population size (Ne) of NL to provide insight to past population bottlenecks. Using our IBD segment sharing data, we applied IBDNe27 to estimate historical Ne in NL clusters >100 individuals in membership, comparing to Irish and British regions (see Methods and Supplemental Note 7 for evaluation of segment accuracy). We observe (Fig. 4a, b, Supplementary Data 4–5) that both Ireland and Britain, and NL have experienced a period of exponential growth within the last 10 generations, consistent with previous estimates of other European ancestry populations41,42. Within Ireland and Britain, in general England has a higher Ne than Wales, Scotland, or Ireland, and Orkney. British estimates are consistent with previous estimations from the PoBI dataset42. Within NL we detect a consistent reduction of ancestral population size 15-10 generations ago across tested clusters. This population size reduction is several orders of magnitude lower to Irish or British equivalents at a comparable time-period. Ne estimates prior to this reduction are much larger than Irish or British estimates and have wide intervals, perhaps due to the impact of the settlement-bottleneck masking previous demographic profiles. NL regions associated with inter-regional admixture such as Avalon N or Admix NL have higher Ne estimates within the past 10 generations which would support evidence of an intra-NL admixture history.
Fig. 4: Evidence of bottleneck with Newfoundland and Labrador.
a The estimated historical Ne for Irish and British regions using IBD-segments and the IBDNe tool. Shading shows the 95% confidence intervals. b The estimated historical Ne for NL clusters >100 individuals in membership size. Shading indicates 95% confidence intervals. c The individual mean total length of Identity-by-Descent (IBD) segments shared with another individual placed in the same cluster, versus the mean number of IBD segments shared with individuals placed in the same cluster. Clusters are colour and shaped coded in the same system as Fig. 1. Irish and British clusters are plotted separately from NL clusters for legibility, and grey points indicate non-Irish and British (or non-NL) clusters. Error bars show the 95% confidence intervals. d The average total length of ROH within each NL or Irish and British cluster. The mean total length of ROH > 1.5 Mb for each cluster is shown by a hollow white circle (left y axis), or the proportion of the genome in ROH > 1.5 Mb in length (FROH—right y axis). Also shown are average total lengths of ROH in four length bins: (1) 4 cM ≤ROH < 8 cM, (2) 8 cM ≤ROH < 12 cM, (3) 12 cM ≤ROH < 20 cM, (4) 20 cM ≤ROH < 300 cM. Groups of clusters are coloured together, and error bars shows 95% confidence intervals. All panels were plotted using the statistical computing language R63 and the package ggplot2.
To complement this non-parametric modelling, we also recorded and compared sharing of IBD-segments (Fig. 4c, Supp Data 5) and Runs-of-Homozygosity (ROH) (Fig. 4d, Supplementary Data 6) within individual NL clusters and Irish or British clusters. We compared the relationship between average number of, and total length of, IBD-segments >3 cM and <15 cM shared between individuals placed in the same cluster (Fig. 4c) - this would reflect recent background community relationships and degree of isolation39. NL clusters consistently present higher levels of IBD sharing than British or Irish clusters, and in some cases (e.g., Trinity and Conception Bay clusters) higher than Orkney and Wales. When compared to Orkney or Wales, NL clusters share slightly fewer segments on average even though the total length shared is comparable. This suggests that the increase of relatedness in NL is more recent than Orkney or Wales, or that on average the Ne is overall higher in NL. Elevated IBD levels within NL are also supported by IBD sharing patterns between NL clusters compared to between Irish or British clusters (Supplementary Fig. 30–32), showing a general pattern of elevated haplotype sharing across the province as well as within specific genetic communities. Also supportive of a general elevation of haplotype sharing, ROH levels in NL are higher than the average in Ireland or Britain (Fig. 4d), with some NL clusters in Trinity Bay (for example) exhibiting particularly high levels. We also show the equivalent plots per-individual in Supplementary Figs. 62–64. This increase in ROH seems driven by longer ROH, consistent with relatively recent isolation. Some individuals show ROH levels consistent with recent consanguinity, i.e., more than 50 cM of genome covered by ROH > 20 cM in length. We show proportions of these individuals in each NL European-ancestry cluster in Supplementary Fig. 65, further demonstrating recent isolation.
Finally, we further investigated the evidence of NL-specific genetic drift, to inform on the suitability of NL as an ideal study population for enrichment of rare functional variation. Utilising Patterson’s D statistic43, we first confirmed Irish-English comparative affinities in each NL fineSTRUCTURE cluster testing D (YRI, NL; Ireland, England) (Fig. 5a, Supplementary Data 7), and where an excess of Irish alleles would result in a negative test statistic. Whilst all clusters show a positive statistic, we find that the four NL clusters identified with Irish ancestry in our haplotype analysis (Fig. 3) are confirmed to present an excess of Irish alleles when compared to English references (Fig. 5a). Next, we tested for NL-specific drift by generating two D test statistics for each NL cluster which together would differentiate shared drift between NL clusters and; (i) Ireland/England, and (ii) other NL individuals (see “Methods”). An excess of NL allele sharing in both tests may indicate NL-specific drift independent of Ireland or England. We find that most NL clusters, but especially Conception Bay S 2 and Conception Bay W, present excess NL drift (Fig. 5b, Supp Data 8). In the case of Conception Bay S 2 and Conception Bay W this is associated with higher IBD sharing within those clusters, which would be consistent with an isolated community experiencing excess genetic drift.