|
|
Post by Admin on Jun 20, 2023 3:29:53 GMT
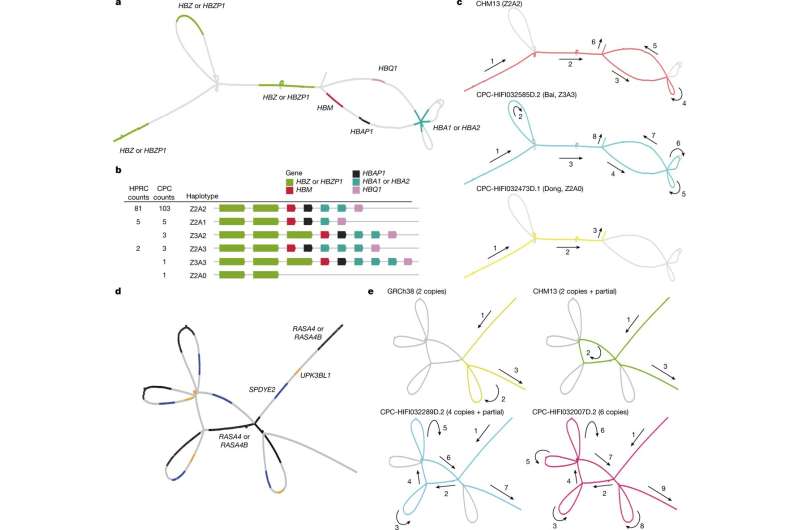 Visualization of novel and complex SVs in the CPC pangenome graph. a, The locations of α-globin genes on the CPC pangenome subgraph. b, Allele counts and linear structural visualization of all structural haplotypes from the Minigraph-Cactus graph among 116 CPC haploid assemblies and 94 HPRC haploid assemblies. The size and spacing of genes on the diagram do not represent the actual size of the chromosome. c, Paths of different α-globin gene haplotypes through the joint subgraph. The arrows indicate the direction of the paths. d, The locations of genes in the RASA4 region on the CPC subgraph. e, Paths of different structural haplotypes with diverse copy numbers of RASA4B. "partial" represents a 14.9-kb fragment of RASA4B. Credit: Nature (2023). DOI: 10.1038/s41586-023-06173-7 A large team of genetic engineers affiliated with institutions across China has completed the first phase of its initiative to create a pangenome reference of genome data for people of different ancestries in China. In their project, reported in the journal Nature, the group, which is part of The Chinese Pangenome Consortium (CPC), sought to sequence the genomes of minority groups across China. The editors at Nature have also published a Research Briefing outlining the work in the same journal issue. The CPC was created in China to address a concern that has arisen in the global medical community—most genomic sequencing has involved people from the major population groups. For example, in China, Hans are the dominant ethnic group, so most genetic research in China has been conducted using Han genomes. This is a problem because slight differences in genomes can result in treatments that fail to work or cause unexpected problems among people from minority ethnic groups. The consortium has divided its effort into several phases, the first of which was to choose a list of minority ethnic groups to study and then to conduct sequencing and genetic analysis on tissues collected from members of each group in that list. In its first phase, the team created a list of 36 minority ethnic groups (there are currently 55 known minority ethnic groups in China) and collected tissues samples from 58 people who were represented on the list. They then conducted sequencing on all the samples, resulting in 116 assemblies (two from each volunteer). They conducted haplotype phasing to sort the assemblies by parentage. The team added 189 million base pairs of packaged sequences that varied between individuals. They also found 1,367 protein-coding duplications. The research team also found what they describe as considerable variation between groups in certain sequences, which they suggest confirms the need for the CPC to continue its work. More information: Yang Gao et al, A pangenome reference of 36 Chinese populations, Nature (2023). DOI: 10.1038/s41586-023-06173-7 A pangenome reference representative of 36 minority Chinese ethnic groups, Nature (2023). DOI: 10.1038/d41586-023-01675-w www.nature.com/articles/s41586-023-06173-7 |
|
|
|
Post by Admin on Jun 28, 2023 20:13:59 GMT
 A pangenome reference of 36 Chinese populations Abstract Human genomics is witnessing an ongoing paradigm shift from a single reference sequence to a pangenome form, but populations of Asian ancestry are underrepresented. Here we present data from the first phase of the Chinese Pangenome Consortium, including a collection of 116 high-quality and haplotype-phased de novo assemblies based on 58 core samples representing 36 minority Chinese ethnic groups. With an average 30.65× high-fidelity long-read sequence coverage, an average contiguity N50 of more than 35.63 megabases and an average total size of 3.01 gigabases, the CPC core assemblies add 189 million base pairs of euchromatic polymorphic sequences and 1,367 protein-coding gene duplications to GRCh38. We identified 15.9 million small variants and 78,072 structural variants, of which 5.9 million small variants and 34,223 structural variants were not reported in a recently released pangenome reference1. The Chinese Pangenome Consortium data demonstrate a remarkable increase in the discovery of novel and missing sequences when individuals are included from underrepresented minority ethnic groups. The missing reference sequences were enriched with archaic-derived alleles and genes that confer essential functions related to keratinization, response to ultraviolet radiation, DNA repair, immunological responses and lifespan, implying great potential for shedding new light on human evolution and recovering missing heritability in complex disease mapping. Main Over the past two decades, the reference human genome sequence has served as the foundation for genetic and biomedical research and applications; however, there is a broad consensus that no single reference sequence can represent the genomic diversity of global populations. On one hand, high-quality population-specific and haplotype-resolved genome references are necessary for genetic and medical analysis2. On the other hand, there is a clear need to shift from a single reference to a pangenome form that better represents genomic diversity, or allelic variation, within and across human populations3. With the advancement of long-read sequencing technologies as well as computational methods, it is now feasible to enable pan-genomic construction to capture the missed variations from a large collection of diverse genomes4. The Human Pangenome Reference Consortium (HPRC) recently constructed a draft human pangenome reference based on 47 samples of worldwide populations, but with East Asian population samples underrepresented (n = 4)1. In particular, only three Southern Han Chinese (CHS) samples were included in the HPRC reference, too few to represent the genomic diversity of ethnic groups in a region such as China, which is populated by 1.44 billion people. We showed previously that the genetic diversity in Asia was not well covered by large-scale international collaborative projects such as the 1000 Genomes Project5,6. Although the need to improve the representation of diverse ancestral backgrounds in genomic research is well known7,8, substantially fewer genomic studies have been conducted in populations of Asian ancestry compared with populations of European ancestry. China harbours a great genetic diversity, with 55 officially recognized minority ethnic groups in addition to the Han Chinese majority and a considerable number of unrecognized ethnic groups. Despite advances in sequencing technologies leading to the achievement of the telomere-to-telomere haploid assembly T2T-CHM13 (ref. 9), only a limited number of Chinese genomes have been de novo assembled to high-quality haplotype sequences using long-read DNA sequencing technologies2,10,11,12,13,14. The only two published studies on the Chinese pangenome were limited to the short-read sequencing data of Han Chinese samples15,16. There is an urgent need to establish a high-quality pangenome reference that better represents the great genomic diversity of Chinese populations. We anticipate such an effort to broaden the reference to represent genomic diversity, resolve allelic and locus heterogeneity, support unbiased and comprehensive detection of structural variation within and across populations, and improve genotyping accuracy in genomic regions enriched with complex sequence variations, such as human leukocyte antigen genes, and ultimately facilitate genomic analysis for both evolutionary and medical research. The Chinese Pangenome Consortium (CPC) aims to de novo sequence at least 500 individuals to better detect and catalogue sequence variants of the Chinese populations using third-generation sequencing technologies. Here we present the draft Chinese pangenome reference based on the first sequencing effort (Phase I) of the CPC, reporting 116 high-quality de novo assemblies from 58 core samples representing 36 minority Chinese ethnic groups and 6 assemblies of the Han Chinese majority. |
|
|
|
Post by Admin on Jun 29, 2023 20:20:26 GMT
Assembly of diverse Chinese genomes The full set of CPC Phase I assemblies includes 68 samples sequenced to an average depth of 28.82× (14.29–60.67×) of PacBio high-fidelity (HiFi) long reads (Methods), 9 samples sequenced with linked reads, and 11 samples sequenced with Oxford Nanopore Technologies long reads and Hi-C Illumina short reads (Supplementary Table 1). After quality control (see below and Methods), we assembled 58 phased diploid assemblies with an average depth of 30.65× (21.43–60.67×) from CPC core samples representing 36 Chinese minority ethnic groups and 8 linguistic groups (Fig. 1a and Supplementary Fig. 1). We further incorporated five samples of high-coverage Oxford Nanopore Technologies long-read sequencing, five published assemblies of four Chinese populations2,10,11,12 and two Han Chinese samples from Central China with Oxford Nanopore Technologies long-read sequencing (Fig. 1a, Supplementary Fig. 1 and Supplementary Table 1). The CPC core samples showed substantial genetic diversity and covered most of the Chinese ethnic minority groups (Fig. 1a and Supplementary Fig. 2). Fig. 1: CPC panel with diploid assemblies of 58 core samples. 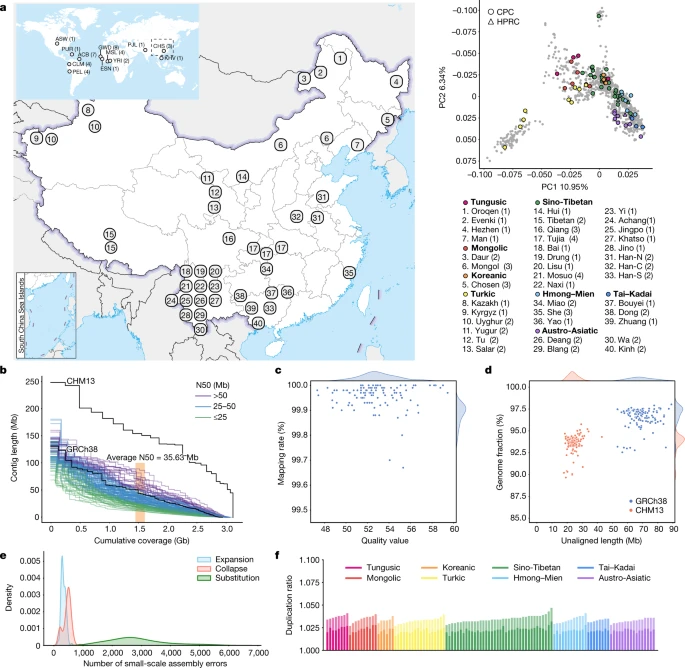 a, Left: the geographical locations and ethnic, linguistic and genetic affiliations of the samples sequenced by CPC (see Supplementary Table 1 for details). The geographical distribution of HPRC samples is shown in the top left. Han-N, Han Chinese from North China; Han-S, Han Chinese from South China; Han-C, Han Chinese from Central China. Top right: the results of principal component (PC) analysis based on whole-genome data of the CPC samples (coloured dots) in the context of East Asian populations (grey dots). The four East Asian samples in HPRC are indicated using triangles in the principal component plot. b, NGx plot showing the assembly contiguity of the 116 CPC core assemblies. The contigs of T2T-CHM13 and GRCh38 (N-masked) are included for comparison. c, Assembly quality of the 116 CPC core assemblies. The x axis shows the quality value of each assembly, and the y axis shows the rate at which the circular consensus sequencing reads were remapped to the assembly contigs. d, Completeness of the 116 CPC core assemblies. The x axis represents the total length of the genome that could not be aligned to the GRCh38 and T2T-CHM13 references, and the y axis shows the proportion of each assembly aligned to GRCh38 and T2T-CHM13. e, Density plot showing the small-scale assembly error distribution of the 116 CPC core assemblies. f, Duplication ratio of the 116 CPC core assemblies. The dark and light colours of each bar represent the duplication rate related to T2T-CHM13 and GRCh38, respectively. The map of China in a was obtained from a standard map service (GS[2020]4618) approved by the Ministry of National Resources of the People’s Republic of China (https://m.mnr.gov.cn). We developed an analysis pipeline to carry out genome assembly, quality control and assembly polishing of the newly sequenced PacBio HiFi samples (Methods and Extended Data Fig. 1a). We conducted both the primary assembly and diploid assembly of 68 PacBio HiFi samples using Hifiasm software and assessed the quality of each assembly (Methods). We removed three samples from the primary assemblies and seven samples from the diploid assemblies with relatively low quality (Extended Data Fig. 1b,c). Eventually, 58 samples or 116 high-quality assemblies were retained for further analysis (Supplementary Table 2). We further carried out assembly correction of the 116 haploid assemblies of the 58 samples, and the comparison of assembly quality before and after polishing showed that our assembly correction improved the data quality (Supplementary Fig. 3). We assessed the 116 assemblies with an average total genome length of 3.01 gigabases (Gb), ranging from 2.88 Gb to 3.12 Gb owing to the size difference between the sex chromosomes, and 93.1% of assemblies showed a larger genome length than the ungapped GRCh38 (2.94 Gb; Fig. 1b and Supplementary Table 2). The 116 assemblies contained an average of 690.5 contigs and ranged from 294 to 1,568 (Supplementary Table 2). The median contig length of genomic assembly (that is, contig N50) ranged from 11.66 Mb to 87.3 Mb across our 116 assemblies with an average of 35.63 Mb, and 8.62% of assemblies had contig N50 values greater than those of GRCh38 (57.88 Mb; Fig. 1b and Supplementary Table 2). We showed that more than 99.67% of circular consensus sequencing reads were remapped to the contigs in each assembly, and the average quality value of the 116 assemblies was 52.84, varying between 47.33 and 59.45 (Fig. 1c). On average, about 24.34 Mb (about 17.9–43.01 Mb) of contigs were not aligned to the T2T-CHM13 reference, and on average, about 69 Mb (about 53.32–89.05 Mb) of contigs were not aligned to the GRCh38 reference, indicating that the genome of the CPC samples was not fully covered by either of the two reference genomes (Fig. 1d). Our assembly covered 96.54% (92.55–98.03%) of the GRCh38 reference and 93.59% (89.66–95.77%) of the T2T-CHM13 reference (Fig. 1d), showing that some of the genomic regions of our assemblies were systematically unassembled or could not be reliably aligned, probably owing to highly repetitive regions. Furthermore, we annotated the unmapped regions of the contigs, and found that about 84% (about 39.7–75.1 Mb; 58.1 Mb on average) of the unmapped sequences were satellite repeats (Supplementary Table 3). We next applied Inspector to reveal that there was an average of 3,627 small-scale assembly errors (1,889–6,848) in each assembly, including 327 expansions (143–610), 454 collapses (154–898) and 2,846 substitutions (1,287–5,663), which decreased after assembly polishing (Fig. 1e and Supplementary Fig. 3). There was an average of 38 large-scale assembly errors (11–78) in each assembly (Supplementary Fig. 4). However, we found an interesting case in which the evaluation software is unable to determine the correct assembly when sequencing and assembly errors coexist (Supplementary Fig. 5), indicating the limitations of current evaluation tools when dealing with challenging situations. We finally assessed the duplication ratios relative to the GRCh38 and T2T-CHM13 references, respectively, which were approximately at the same level among the 116 assemblies of the 58 samples (Fig. 1f). |
|
|
|
Post by Admin on Jun 30, 2023 20:10:12 GMT
Genomic features of the CPC assemblies To investigate the genomic composition of our 58 CPC samples, we aligned the 116 assemblies to T2T-CHM13 and called the variants of each sample using Phased Assembly Variant caller17 (Methods). We observed an average of 11.22% (9.35–13.05%) small variants and 24.16% (19.72–29.3%) structural variants (SVs) per CPC sample were in the highly repetitive regions (Extended Data Fig. 2), and more than half of the SVs were singletons except for those on the Y chromosome (Supplementary Fig. 6). We further identified an average of 2,802 (2,265–3,187) novel sequences for each CPC sample by collecting insertions larger than 1 kb compared to the T2T-CHM13 reference (Methods and Extended Data Fig. 3a). These novel sequences were located at 63,243 regions across the genome, and they were particularly enriched in the highly repetitive sequences such as the centromeric and telomeric regions (Extended Data Fig. 3b). We determined 115 genomic regions as insertion hotspots based on the insertion frequency, covering a total length of 204.8 Mb. Considering that reference bias typically hinders the identification of novel SVs in both short- and long-read datasets, we further completed the analysis of complex structural variations (CSVs) using our CPC high-quality and phased haplotype sequences. On average, we identified 70 CSVs per sample with the newly developed method SVision18 (Supplementary Fig. 7). The most common CSV type was INS+tDUP with an average number of 44 (Supplementary Fig. 8). We merged the CSVs into a set of 706 non-redundant CSVs (Extended Data Fig. 4a) and classified them into four classes19: shared (all samples), major (≥50% of samples), polymorphic (<50% of samples) and singleton (only one sample). We found that the peak of the CSV length distribution was at 10 kb (Extended Data Fig. 4b). We found one shared CSV (chr11:66,245,313–66,246,097 with an INS+INV type), 34 major CSVs, 277 polymorphic CSVs and 394 singleton CSVs from the CPC assembly set (Extended Data Fig. 4c). We next annotated the copy number variations (CNVs) relative to the GRCh38 reference in each assembly (Methods). There were 1,367 protein-coding genes in the full set of assemblies that had a gain in copy number in at least one genome. An average of 53 (27–100) genes with a gain in copy number were observed in each assembly (Fig. 2a), 13.39% of CNV genes showed a frequency of more than 5% in the whole CPC assembly set, and 57.86% of CNV genes were found in only a single haplotype. We found there were 1,079 duplicated genes in the CPC assembly set that were not observed in HPRC assemblies (Fig. 2b and Supplementary Table 4). These genes were enriched significantly in olfactory-related functions (for example, GO:0007608, sensory perception of smell, odds ratio (OR) = 6.46, Benjamini–Hochberg (BH)-adjusted P = 2.22 × 10−36; and hsa04740, olfactory transduction, OR = 7.14, BH-adjusted P = 8.35 × 10−38), and at a marginal significance level in skin-related disease (for example, DOID:37, skin disease, OR = 2.33, BH-adjusted P = 0.086; and DOID:16, integumentary system disease, OR = 2.23, BH-adjusted P = 0.086; Supplementary Table 5). We found that 562 (52.1%) of the novel duplicated genes in the CPC assembly set were trait-associated according to the genome-wide association study (GWAS) catalogue, and 207 (19.2%) of these genes were related to at least one human disease annotated by the Disease Ontology, suggesting the remarkable potential for the CPC assembly set to contribute to disease and phenotype association studies. In particular, KCNJ18 and MTRNR2L6 showed considerably high frequency in the CPC assemblies (115 of 116) but were absent in the HPRC assemblies (Fig. 2c). KCNJ18 encodes a member of the inwardly rectifying potassium channel family (Kir2.6), which is expressed in skeletal muscle and is transcriptionally regulated by thyroid hormone20. Kir2.6 alterations were reported to be associated with thyrotoxic periodic paralysis, which is a well-known complication of thyrotoxicosis in Asian populations, but is rare in European populations21,22,23. The pseudogene MTRNR2L6 is predicted to be involved in the regulation of apoptosis (GO:1900118). Notably, this gene was reported to show signatures of positive selection across geographical Han Chinese populations24. A number of the CPC-specific CNV genes showed signatures of natural selection indicated by the estimates of Tajima’s D (Supplementary Fig. 9 and Supplementary Table 4). Outstanding examples include SPATA31D4 (nhaplotype = 6, Tajima’s D = −3.01, false-discovery rate (FDR)-adjusted P = 2.38 × 10⁻⁵) and PSAPL1 (nhaplotype = 7, Tajima’s D = 4.32, FDR-adjusted P = 0.006). In particular, SPATA31D4 belongs to the core duplicon families that are thought to have contributed significantly to hominoid evolution with a strong signal of positive selection in hominoids. Previous studies suggested that the gene family has a function in response to ultraviolet radiation and DNA repair, and may also influence human lifespan25. Fig. 2: CNVs identified from CPC assemblies. 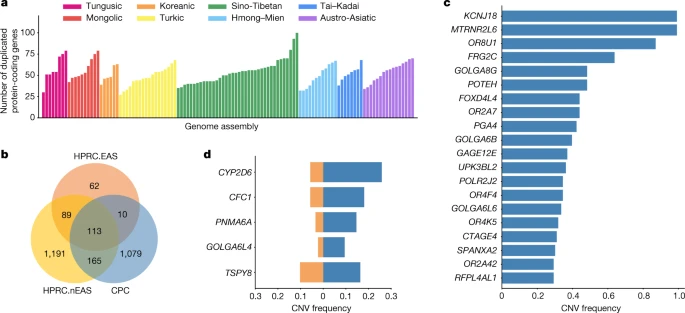 a, Number of duplicated protein-coding genes per CPC genome assembly compared with the GRCh38 reference. b, Venn diagram showing the number of duplicated genes in CPC, HPRC.EAS and HPRC.nEAS assemblies. c, The top 20 most common CPC-specific CNV-related genes compared with the HPRC assemblies. d, The five overlapped CNV genes showing a higher frequency (≥5%) in CPC assemblies (blue) than in HPRC assemblies (orange). HPRC.EAS, East Asian in HPRC; HPRC.nEAS, non-East Asian in HPRC. There were 288 duplicated genes from the CPC assemblies that were also observed in the HPRC assemblies, of which 123 genes were shared with 4 HPRC East Asian samples (HPRC.EAS), and 278 genes were shared with the remaining 40 non-East Asian HPRC (HPRC.nEAS) samples (Fig. 2b). Among these overlapped genes, we found several genes with a higher frequency (≥5%) in the CPC assembly set than in the HPRC assemblies (Fig. 2d and Supplementary Table 6). For example, the CNV frequency at CYP2D6 was higher in the CPC assembly set than those in the collective HPRC assemblies and in the separate sets of HPRC.EAS or HPRC.nEAS (Fig. 2d and Extended Data Fig. 5). CYP2D6 is well known for its remarkable polymorphism, which has been systematically surveyed in a wide variety of human populations26. We also found CFC1 with highly differentiated CNVs between the CPC and HPRC assemblies (frequency difference = 0.124). Several investigations reported associations between CFC1 and cardiovascular disease27, especially in Chinese populations28. In addition, CTAG1A and ZNF658 were identified with rare CNVs (around 1%) in the HPRC assembly but presented with common CNVs (≥5% and <95%) in the CPC assembly. CTAG1A is expressed at high levels in the normal ovary and testis. ZNF658 regulates the transcription of genes involved in zinc homoeostasis and affects ribosome biogenesis29, and is involved in infectious processes (hsa05168, herpes simplex virus 1 infection). |
|
|
|
Post by Admin on Jul 1, 2023 22:13:08 GMT
The variation graph of the CPC pangenome In a typical pangenome reference, genomic data from a population can be organized into an edge-based sequence variation graph. We applied the Minigraph-Cactus pipeline to construct the variation graph for the CPC pangenome, in which the haplotypic assemblies can be represented as different paths composed of sequence nodes (Fig. 3a). Using Minigraph, 122 haplotypic assemblies from 61 samples were added to the graph starting with the reference assemblies T2T-CHM13 and GRCh38. To extend the pangenome to the single nucleotide polymorphism level, assemblies were remapped afterwards to the graph using the Cactus genome aligner. We used dna-brnn to identify and mask the centromeric satellites of the input assemblies, and then clipped all paths longer than 100 kb that were not aligned to the underlying graph to avoid the effects of complicated regions on alignment. Finally, we constructed the Minigraph-Cactus graph, which had a length of 3,284,609,818 bp (measured as the sum of all nodes). Additionally, we measured the length of the sequences that were added to the pangenome graph from each of the 61 diploid genomes. A total of 194.67 Mb of non-reference sequences were added to the graph, of which 62.90 Mb were singletons. In addition, we discovered that 4.96 Mb of non-reference sequences presented in ≥95% of all haplotypes, representing the core genome in our sample populations, and 72.24 Mb of non-reference sequences in ≥5% and <95% of the haplotypes, representing the common genome (Fig. 3b). Fig. 3: CPC pangenome graph and CPC-specific variants compared to the HPRC assemblies. 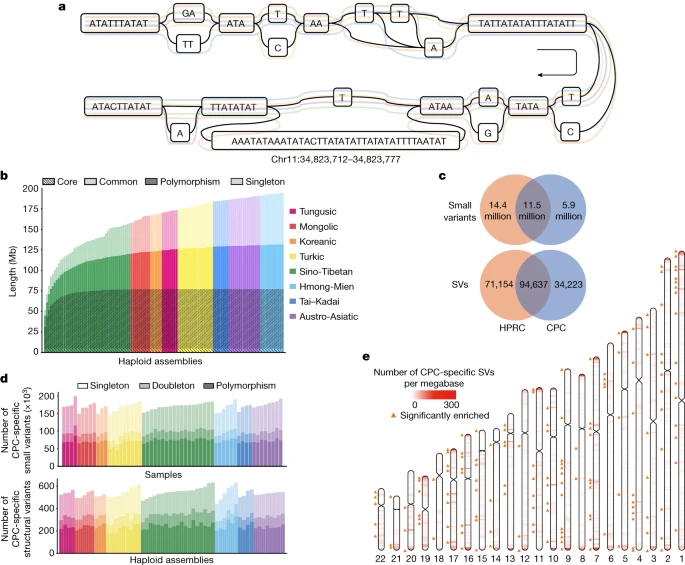 a, A variation graph representing CHM13.chr11:34,823,712–34,823,777 of the CPC pangenome. Coloured lines represent five haplotype assemblies. b, Pangenome cumulative growth curves for the CPC pangenome graph. Depth in bars measures how often a non-reference segment occurred in the assembled haplotypes. Non-reference sequences were classified into four categories according to the frequency of presence in the haplotypes: core (≥95%), common (≥5% and <95%), polymorphism (≥2 haplotypes but <5%) and singleton (only one haplotype). Different colours indicate a different ethnic group. c, The number of CPC-specific and common variants between CPC and HPRC assemblies from the joint pangenome graph. d, Number of identified CPC-specific small variants and SVs in different populations. e, The distribution of CPC-specific SVs from the joint pangenome graph on autosomes. The colour scale from white to red represents the density of SVs in 1-Mb regions. The orange triangle marks CPC-specific SVs that were significantly enriched in this 1-Mb window compared with HPRC-specific variants and common variants, on the basis of a one-tailed Fisher’s exact test (FDR-correlated P value < 0.05). As the underlying 122 haplotypic assemblies were encoded as the paths in the graph, we characterized the variants as well as the haplotypes of assemblies by graph decomposition (Methods). We further examined whether the longest allele presented at each site, and we identified 15,916,404 small-variant sites (<50 bp) and 78,072 SV sites (≥50 bp) from the graph. Each sample contained 4,397,706 (s.d. = 35,776) small variants, and each haplotype contained 14,557 (s.d. = 224) SVs (Supplementary Fig. 10). The number of SVs obtained from each sample based on HiFi data was far more than that based on next-generation sequencing (NGS) data (Supplementary Table 7). The average length of SVs was 3.2 kb in the CPC graph genome, and the median length was 178 bp, which was longer than the short reads in the NGS data. In addition, we observed a peak at about 300 bp for Alu, and at about 6 kb for LINE-1 (Extended Data Fig. 6), indicating the reliability of our CPC pangenome. The CPC core samples greatly covered the genetic diversity of China’s multi-ethnic population and showed more diverse genetic ancestry than the Han Chinese samples (Extended Data Fig. 7). To evaluate the contribution of multi-ethnic populations in the CPC pangenome, we compared the cumulative length of the non-reference sequence by using Han Chinese samples alone as well as using multi-ethnic populations. When the first haplotype was added, the length of the non-reference sequence generated by the Han Chinese samples and that of the other populations were roughly the same (Extended Data Fig. 8). The average non-reference sequence length was 49.71 Mb for the Han Chinese and 49.16 Mb for other populations. However, we obtained remarkably different results with the addition of haplotypes. In particular, the cumulative length grew much faster for the non-reference sequences detected in multi-ethnic populations than those detected in a single population, such as the Han Chinese (Extended Data Fig. 8). |
|

