

Post by Admin on Jul 5, 2023 18:33:32 GMT
Short-read mapping with the CPC reference
To evaluate the performance of the Giraffe mapper to process graph genomes with different complexities, we applied gradient filtering on the CPC reference according to the path depth of nodes (Methods). When a more stringent filter was applied, we observed a decrease in the number of nodes and edges in the graph reference (Supplementary Fig. 11a), the graph complexity (Supplementary Fig. 11b) and the diversity (Supplementary Fig. 11c). Next, ten samples from the East Asian population of the 1000 Genomes Project were aligned to these CPC references with different complexities through vg Giraffe. The results showed that the mapping rate increased and reached a peak value with a simplified version of the graph (Supplementary Fig. 12a), probably owing to the limitation of the current version of the Giraffe mapper in managing the locally complex regions. We also observed that the proportion of reads with perfect matching continued to decline with the simplification of the graph (Supplementary Fig. 12b), reflecting the decline in the diversity of the graph (Supplementary Fig. 13). Therefore, there was a trade-off between mapping rate and mapping quality, and a compromise is needed to determine the size of the graph reference.
Compared with the HPRC graph reference, the CPC graph reference had fewer nodes, edges and diversity, probably owing to only Chinese samples being included, compared with HPRC covering both African and European samples (Supplementary Table 8). However, using the CPC graph reference achieved better alignments than using the HPRC graph reference when aligning the East Asian genomes (Supplementary Fig. 14). By contrast, the HPRC graph performed better in processing African samples (Supplementary Fig. 14). These results indicate that using population-specific graph references improved the alignment quality of short reads.
To carry out variant calling, we mapped the GAM file in the graph reference coordinate to the BAM file in the linear reference coordinate. The results showed that the mapping rate of all samples decreased by an average of 0.58% (0.54–0.61%). We speculated that the advantages of the graph reference would be lost when using the traditional linear reference to carry out calling or record variation because the novel sequences in the graph reference were missing in the linear coordinate.
Comparison with the HPRC pangenome graph
To investigate the previously unidentified components contributed by the East Asian populations in the CPC pangenome graph, we constructed a merged Minigraph-Cactus graph including all 116 assemblies in CPC and 94 assemblies in HPRC1 (Methods). We identified 5,850,863 (18.4%) small variants and 34,223 (17.1%) SVs that were found only in the CPC assemblies (Fig. 3c), of which each sample included 170,307 (s.d. = 10,904) small variants and each haplotype carried 543 (s.d. = 39) SVs, and more than half of the CPC-specific variants were singletons or doubletons (Fig. 3d). In both ‘easy’ and ‘difficult’ regions of the GRCh38 reference defined in GIAB 3.0 (ref. 30), approximately 39% of the CPC-specific small variants could not be annotated in gnomAD v0.1.8 (ref. 31; Supplementary Table 9), suggesting that the East Asian-specific small variants identified with the long-reads-based methods remain a potent supplement to the current short-read-based genetic resources. We found that 16,898 (49.4%) of the CPC-specific SVs overlapped the nearby regions (100 kb upstream and downstream of the gene coding regions) of 6,426 protein-coding genes, in which 4,344 genes were disrupted by SVs spanning more than 1 kb and had the most frequent functional enrichments related to immunological functions, such as humoral immune response (GO:0002455, OR = 5.11, BH-adjusted P = 8.50 × 10⁻¹⁴; and GO:0006959, OR = 2.91, BH-adjusted P = 1.64 × 10⁻¹¹; Supplementary Table 10). These CPC-specific SVs also showed an overrepresentation of the laryngitis-related genes according to the disease ontology annotation (DOID:3437 and DOID:786, OR = 16.66, BH-adjusted P = 0.007).
Furthermore, we estimated the location distribution of CPC-specific SVs using a sliding-window-based analysis along the autosomes (Methods). Similar to HPRC-specific SVs and common SVs, most of the CPC-specific SVs were located at the centromeric and telomeric regions of chromosomes (Fig. 3e and Supplementary Fig. 15). We next applied a one-tailed Fisher’s exact test between the number of CPC-specific SVs and SVs that were also found in HPRC assemblies in different regions, and found 223 hotspots where CPC-specific SVs were significantly enriched compared with other SVs (FDR-adjusted P < 0.05), involving 807 protein-coding genes (Fig. 3e) overrepresenting biological functions such as oxygen transport (GO:0015671, OR = 22.66, BH-adjusted P = 0.008; and GO:0005344, OR = 24.91, BH-adjusted P = 0.001) and haemoglobin structure (GO:0031838, OR = 28.58, BH-adjusted P = 0.003; GO:0005833, OR = 24.21, BH-adjusted P = 0.003; and GO:0031720, OR = 33.15, BH-adjusted P = 0.002; Supplementary Table 11).
Long-read sequencing technologies and pangenome graph-based analysis methods allow us to explore large and complex SVs that were previously difficult to locate in NGS data, thus providing the genetic basis for association studies of these complex loci with physiological function or disease. We found that some of the CPC-specific enriched SVs mentioned above were closely related to the prevalent diseases in East Asia. A remarkable example is the α-globin gene cluster located near the telomere of the short arm of chromosome 16, including five functional genes and two pseudogenes32, 5′-zeta–pseudozeta–mu–pseudoalpha-1–alpha-2–alpha-1–theta-3′ (Fig. 4a). We identified six major haplotypes based on the copy number variations of α-globin genes (HBA1 or HBA2) and ζ-globin (HBZ or pseudogene HBZP1; Fig. 4b) genes from the pangenome graph (Supplementary Table 12). In addition to a deletion (Z2A1) and duplication (Z2A3) involving a copy number change of α-globin found in both CPC and HPRC, we also identified two CPC-specific large SVs: a 20-kb deletion (Z2A0) involving five globin genes and a 10-kb duplication (Z3A2 and Z3A3) involving ζ-globin genes (Fig. 4c). The long deletion in which both α-globins are lost has been widely reported as the Southeast Asian deletion (--SEA, A0 in our haplotype)33, and is mainly distributed in southern China and Southeast Asia. As previously reported34, the heterozygote SEA deletion (A2/A0) as well as the loss of one copy of the α-globin gene (A2/A1) is phenotypically silent. The homozygous loss of one α-globin gene (A1/A1) leads to mild anaemia; losing three copies (A1/A0) leads to haemoglobin H disease, and homozygous SEA deletion leads to severe hydrops fetalis. The precise localization of the complex SVs on the α-globin gene cluster in the CPC pangenome graph could provide a potential reference for future anaemia-related studies. Another example is the RASA4 gene located on chromosome 7 (Fig. 4d). As compared to the two copies of the reference genome, a high diversity of copy numbers in East Asian populations (Supplementary Table 13), including a six-copy variant that is not found in HPRC samples, was discovered (Fig. 4e). CNVs of this gene have not yet been described. The aberrant expression of RAS p21 protein activator 4, encoded by RASA4, has been widely reported to be closely associated with the development of a variety of human cancers35, and we observed differences in the dosage frequency distribution among populations (Supplementary Tables 14 and 15), which may contribute to the variation of disease incidence.
Fig. 4: Visualization of novel and complex SVs in the CPC pangenome graph.
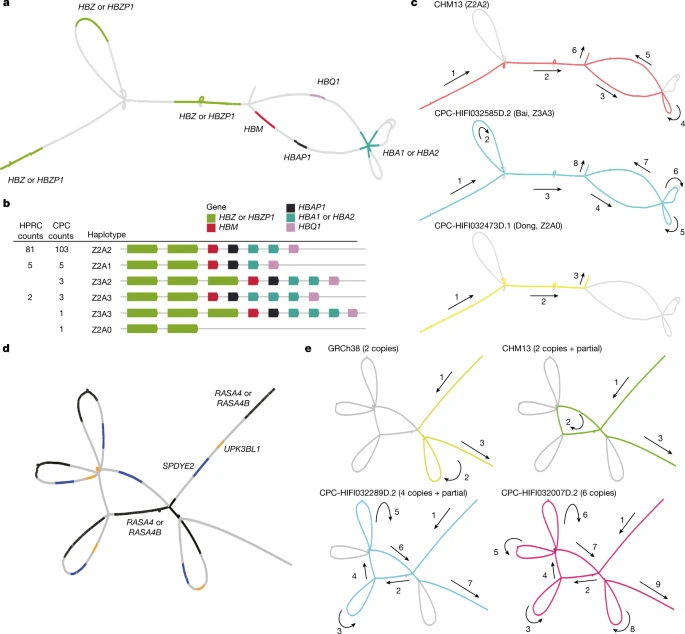
a, The locations of α-globin genes on the CPC pangenome subgraph. b, Allele counts and linear structural visualization of all structural haplotypes from the Minigraph-Cactus graph among 116 CPC haploid assemblies and 94 HPRC haploid assemblies. The size and spacing of genes on the diagram do not represent the actual size of the chromosome. c, Paths of different α-globin gene haplotypes through the joint subgraph. The arrows indicate the direction of the paths. d, The locations of genes in the RASA4 region on the CPC subgraph. e, Paths of different structural haplotypes with diverse copy numbers of RASA4B. ‘partial’ represents a 14.9-kb fragment of RASA4B.
We next investigated to what extent the novel SVs identified in the CPC assemblies may increase our insights into disease genetics. On the basis of the 243,465 phenotype-associated variants collected from the latest release of the GWAS catalogue, in which 62,393 variants were reported or replicated in the East Asian populations, we found that 75.95% of the novel SVs >1 kb in size (spanning 83.17% of the total novel sequence length) were located <50 kb from the GWAS loci, and in particular, 55.49% (spanning 72.95% of the total novel sequence length) were around the variants associated with East Asian phenotypes. We observed that, when comparing reported variants across traits, height-associated variants were more likely to be associated with larger proportions of essentially independent novel loci (50.7% and 47.7% for the height-associated variants reported in global and East Asian populations, respectively) than other traits, possibly owing to the remarkable polygenicity of height (Extended Data Fig. 9 and Supplementary Table 16). Moreover, these novel SVs were significantly enriched at disease-associated variants identified in East Asians, including urolithiasis, nephrolithiasis and goitre (BH-adjusted P value = 0.043 for each), which are highly prevalent in some Asian areas36 (Extended Data Fig. 9).
Despite the fact that all of the novel SVs detected in the CPC assemblies collectively showed a similar level of nucleotide diversity measured by Tajima’s D to the rest of the genome, the CPC-specific novel SVs absent in the HPRC assemblies exhibited a significantly higher Tajima’s D than the latter (P = 4.65 × 10⁻⁹, one-tailed Wilcoxon rank-sum test; Supplementary Fig. 16a). The most outstanding signals encompassed two protein-coding genes, STARD7 and ITPRIPL1, in chromosome 2 (Tajima’s D = −3.06, FDR-adjusted P = 7.54 × 10⁻¹²; Supplementary Fig. 16b). Again, we highlight the SPATA31 genes as they could confer evolutionary significance in hominoids not only with the copy number variables (Supplementary Fig. 9) but also with the underrepresented sequence variants (Tajima’s D = −3.01, FDR-adjusted P = 2.38 × 10⁻⁵). All of these results imply a great potential for the novel SVs in the CPC assemblies to provide new insights into the human adaptive evolution in East Asia.
To evaluate the performance of the Giraffe mapper to process graph genomes with different complexities, we applied gradient filtering on the CPC reference according to the path depth of nodes (Methods). When a more stringent filter was applied, we observed a decrease in the number of nodes and edges in the graph reference (Supplementary Fig. 11a), the graph complexity (Supplementary Fig. 11b) and the diversity (Supplementary Fig. 11c). Next, ten samples from the East Asian population of the 1000 Genomes Project were aligned to these CPC references with different complexities through vg Giraffe. The results showed that the mapping rate increased and reached a peak value with a simplified version of the graph (Supplementary Fig. 12a), probably owing to the limitation of the current version of the Giraffe mapper in managing the locally complex regions. We also observed that the proportion of reads with perfect matching continued to decline with the simplification of the graph (Supplementary Fig. 12b), reflecting the decline in the diversity of the graph (Supplementary Fig. 13). Therefore, there was a trade-off between mapping rate and mapping quality, and a compromise is needed to determine the size of the graph reference.
Compared with the HPRC graph reference, the CPC graph reference had fewer nodes, edges and diversity, probably owing to only Chinese samples being included, compared with HPRC covering both African and European samples (Supplementary Table 8). However, using the CPC graph reference achieved better alignments than using the HPRC graph reference when aligning the East Asian genomes (Supplementary Fig. 14). By contrast, the HPRC graph performed better in processing African samples (Supplementary Fig. 14). These results indicate that using population-specific graph references improved the alignment quality of short reads.
To carry out variant calling, we mapped the GAM file in the graph reference coordinate to the BAM file in the linear reference coordinate. The results showed that the mapping rate of all samples decreased by an average of 0.58% (0.54–0.61%). We speculated that the advantages of the graph reference would be lost when using the traditional linear reference to carry out calling or record variation because the novel sequences in the graph reference were missing in the linear coordinate.
Comparison with the HPRC pangenome graph
To investigate the previously unidentified components contributed by the East Asian populations in the CPC pangenome graph, we constructed a merged Minigraph-Cactus graph including all 116 assemblies in CPC and 94 assemblies in HPRC1 (Methods). We identified 5,850,863 (18.4%) small variants and 34,223 (17.1%) SVs that were found only in the CPC assemblies (Fig. 3c), of which each sample included 170,307 (s.d. = 10,904) small variants and each haplotype carried 543 (s.d. = 39) SVs, and more than half of the CPC-specific variants were singletons or doubletons (Fig. 3d). In both ‘easy’ and ‘difficult’ regions of the GRCh38 reference defined in GIAB 3.0 (ref. 30), approximately 39% of the CPC-specific small variants could not be annotated in gnomAD v0.1.8 (ref. 31; Supplementary Table 9), suggesting that the East Asian-specific small variants identified with the long-reads-based methods remain a potent supplement to the current short-read-based genetic resources. We found that 16,898 (49.4%) of the CPC-specific SVs overlapped the nearby regions (100 kb upstream and downstream of the gene coding regions) of 6,426 protein-coding genes, in which 4,344 genes were disrupted by SVs spanning more than 1 kb and had the most frequent functional enrichments related to immunological functions, such as humoral immune response (GO:0002455, OR = 5.11, BH-adjusted P = 8.50 × 10⁻¹⁴; and GO:0006959, OR = 2.91, BH-adjusted P = 1.64 × 10⁻¹¹; Supplementary Table 10). These CPC-specific SVs also showed an overrepresentation of the laryngitis-related genes according to the disease ontology annotation (DOID:3437 and DOID:786, OR = 16.66, BH-adjusted P = 0.007).
Furthermore, we estimated the location distribution of CPC-specific SVs using a sliding-window-based analysis along the autosomes (Methods). Similar to HPRC-specific SVs and common SVs, most of the CPC-specific SVs were located at the centromeric and telomeric regions of chromosomes (Fig. 3e and Supplementary Fig. 15). We next applied a one-tailed Fisher’s exact test between the number of CPC-specific SVs and SVs that were also found in HPRC assemblies in different regions, and found 223 hotspots where CPC-specific SVs were significantly enriched compared with other SVs (FDR-adjusted P < 0.05), involving 807 protein-coding genes (Fig. 3e) overrepresenting biological functions such as oxygen transport (GO:0015671, OR = 22.66, BH-adjusted P = 0.008; and GO:0005344, OR = 24.91, BH-adjusted P = 0.001) and haemoglobin structure (GO:0031838, OR = 28.58, BH-adjusted P = 0.003; GO:0005833, OR = 24.21, BH-adjusted P = 0.003; and GO:0031720, OR = 33.15, BH-adjusted P = 0.002; Supplementary Table 11).
Long-read sequencing technologies and pangenome graph-based analysis methods allow us to explore large and complex SVs that were previously difficult to locate in NGS data, thus providing the genetic basis for association studies of these complex loci with physiological function or disease. We found that some of the CPC-specific enriched SVs mentioned above were closely related to the prevalent diseases in East Asia. A remarkable example is the α-globin gene cluster located near the telomere of the short arm of chromosome 16, including five functional genes and two pseudogenes32, 5′-zeta–pseudozeta–mu–pseudoalpha-1–alpha-2–alpha-1–theta-3′ (Fig. 4a). We identified six major haplotypes based on the copy number variations of α-globin genes (HBA1 or HBA2) and ζ-globin (HBZ or pseudogene HBZP1; Fig. 4b) genes from the pangenome graph (Supplementary Table 12). In addition to a deletion (Z2A1) and duplication (Z2A3) involving a copy number change of α-globin found in both CPC and HPRC, we also identified two CPC-specific large SVs: a 20-kb deletion (Z2A0) involving five globin genes and a 10-kb duplication (Z3A2 and Z3A3) involving ζ-globin genes (Fig. 4c). The long deletion in which both α-globins are lost has been widely reported as the Southeast Asian deletion (--SEA, A0 in our haplotype)33, and is mainly distributed in southern China and Southeast Asia. As previously reported34, the heterozygote SEA deletion (A2/A0) as well as the loss of one copy of the α-globin gene (A2/A1) is phenotypically silent. The homozygous loss of one α-globin gene (A1/A1) leads to mild anaemia; losing three copies (A1/A0) leads to haemoglobin H disease, and homozygous SEA deletion leads to severe hydrops fetalis. The precise localization of the complex SVs on the α-globin gene cluster in the CPC pangenome graph could provide a potential reference for future anaemia-related studies. Another example is the RASA4 gene located on chromosome 7 (Fig. 4d). As compared to the two copies of the reference genome, a high diversity of copy numbers in East Asian populations (Supplementary Table 13), including a six-copy variant that is not found in HPRC samples, was discovered (Fig. 4e). CNVs of this gene have not yet been described. The aberrant expression of RAS p21 protein activator 4, encoded by RASA4, has been widely reported to be closely associated with the development of a variety of human cancers35, and we observed differences in the dosage frequency distribution among populations (Supplementary Tables 14 and 15), which may contribute to the variation of disease incidence.
Fig. 4: Visualization of novel and complex SVs in the CPC pangenome graph.
a, The locations of α-globin genes on the CPC pangenome subgraph. b, Allele counts and linear structural visualization of all structural haplotypes from the Minigraph-Cactus graph among 116 CPC haploid assemblies and 94 HPRC haploid assemblies. The size and spacing of genes on the diagram do not represent the actual size of the chromosome. c, Paths of different α-globin gene haplotypes through the joint subgraph. The arrows indicate the direction of the paths. d, The locations of genes in the RASA4 region on the CPC subgraph. e, Paths of different structural haplotypes with diverse copy numbers of RASA4B. ‘partial’ represents a 14.9-kb fragment of RASA4B.
We next investigated to what extent the novel SVs identified in the CPC assemblies may increase our insights into disease genetics. On the basis of the 243,465 phenotype-associated variants collected from the latest release of the GWAS catalogue, in which 62,393 variants were reported or replicated in the East Asian populations, we found that 75.95% of the novel SVs >1 kb in size (spanning 83.17% of the total novel sequence length) were located <50 kb from the GWAS loci, and in particular, 55.49% (spanning 72.95% of the total novel sequence length) were around the variants associated with East Asian phenotypes. We observed that, when comparing reported variants across traits, height-associated variants were more likely to be associated with larger proportions of essentially independent novel loci (50.7% and 47.7% for the height-associated variants reported in global and East Asian populations, respectively) than other traits, possibly owing to the remarkable polygenicity of height (Extended Data Fig. 9 and Supplementary Table 16). Moreover, these novel SVs were significantly enriched at disease-associated variants identified in East Asians, including urolithiasis, nephrolithiasis and goitre (BH-adjusted P value = 0.043 for each), which are highly prevalent in some Asian areas36 (Extended Data Fig. 9).
Despite the fact that all of the novel SVs detected in the CPC assemblies collectively showed a similar level of nucleotide diversity measured by Tajima’s D to the rest of the genome, the CPC-specific novel SVs absent in the HPRC assemblies exhibited a significantly higher Tajima’s D than the latter (P = 4.65 × 10⁻⁹, one-tailed Wilcoxon rank-sum test; Supplementary Fig. 16a). The most outstanding signals encompassed two protein-coding genes, STARD7 and ITPRIPL1, in chromosome 2 (Tajima’s D = −3.06, FDR-adjusted P = 7.54 × 10⁻¹²; Supplementary Fig. 16b). Again, we highlight the SPATA31 genes as they could confer evolutionary significance in hominoids not only with the copy number variables (Supplementary Fig. 9) but also with the underrepresented sequence variants (Tajima’s D = −3.01, FDR-adjusted P = 2.38 × 10⁻⁵). All of these results imply a great potential for the novel SVs in the CPC assemblies to provide new insights into the human adaptive evolution in East Asia.