|
|
Post by Admin on Apr 20, 2024 12:29:27 GMT
 A multi-institutional team of geneticists and genomic and genotyping specialists in Japan has sequenced the genomes of thousands of Japanese people from across the country, looking to settle the debate surrounding the ancestry of the Japanese people. In their study, published in the journal Science Advances, the group sequenced the genes of so many people that they were able to decode the tri-ancestral origins of the Japanese population—and also to identify gene variants that may make some Japanese people more likely to develop certain illnesses. The research team began by noting that most large-scale genetic sequencing research efforts have been conducted on people of European descent, which, they point out, leaves gaps in knowledge surrounding Asian ancestral roots. So they embarked on one of the largest non-European sequencing research efforts to date. They sequenced the genomes of more than 3,200 people living in seven regions in Japan and Okinawa to create the new Japanese Encyclopedia of Whole-Genome/Exome Sequencing Library (JEWEL). The researchers found that modern Japanese people are descended from only three main ancestral groups: Jomon hunter-gatherers of the Neolithic, predecessors of the Han Chinese, and a yet-to-be identified group of people from Northeast Asia. Their findings contradict theories that the Japanese people are descendants of the Jomon and later migrants from continental Asia. The research team also found modern Japanese people have genes from both the Denisovans and Neanderthals, some of which have been associated with the development of certain diseases, such as diabetes type II, prostate cancer, coronary heart disease and rheumatoid arthritis. They note that the identification of such variants could lead to better health care for Japanese people. The team's efforts lay the groundwork for future genomic studies of people of Asian ancestry by providing a centralized database (JEWEL) that can grow and be used by researchers all across the region. More information: Xiaoxi Liu et al, Decoding triancestral origins, archaic introgression, and natural selection in the Japanese population by whole-genome sequencing, Science Advances (2024). DOI: 10.1126/sciadv.adi8419 Journal information: Science Advances www.science.org/doi/10.1126/sciadv.adi8419 |
|
|
|
Post by Admin on Apr 21, 2024 2:26:59 GMT
Decoding triancestral origins, archaic introgression, and natural selection in the Japanese population by whole-genome sequencing
Abstract
We generated Japanese Encyclopedia of Whole-Genome/Exome Sequencing Library (JEWEL), a high-depth whole-genome sequencing dataset comprising 3256 individuals from across Japan. Analysis of JEWEL revealed genetic characteristics of the Japanese population that were not discernible using microarray data. First, rare variant–based analysis revealed an unprecedented fine-scale genetic structure. Together with population genetics analysis, the present-day Japanese can be decomposed into three ancestral components. Second, we identified unreported loss-of-function (LoF) variants and observed that for specific genes, LoF variants appeared to be restricted to a more limited set of transcripts than would be expected by chance, with PTPRD as a notable example. Third, we identified 44 archaic segments linked to complex traits, including a Denisovan-derived segment at NKX6-1 associated with type 2 diabetes. Most of these segments are specific to East Asians. Fourth, we identified candidate genetic loci under recent natural selection. Overall, our work provided insights into genetic characteristics of the Japanese population.
|
|
|
|
Post by Admin on Apr 22, 2024 21:01:08 GMT
INTRODUCTION
Whole-genome sequencing (WGS) datasets are invaluable resources for human genetic and biomedical research (1). Through comprehensive profiling of genetic variants, WGS data have enabled various in-depth analyses. These analyses have yielded insights into the characteristics of human genome variation (2), unveiled complex histories of human populations (3, 4), and shed light on the processes of evolutionary adaptation and positive selection (5, 6). In terms of application in genetics, WGS datasets are indispensable for imputation analysis. Large-scale WGS datasets have made it possible to construct multiethnic or population-specific reference panels (7, 8). By accurately inferring ungenotyped variants from microarray data, imputation analysis effectively boosts the power of genome-wide association studies (GWASs), enables fine-mapping, and facilitates transethnic meta-analysis (9). Furthermore, WGS datasets provide a rich source of variants, including those that are rare, specific to certain populations, or predicted to be deleterious or loss of function (LoF) (10). These variants can be investigated not only for associations with various diseases but also for the effects of human knockouts, providing opportunities to identify their functional roles in both physiological and pathological processes and hence to explore the possibilities as targets for drug development (11, 12). Accordingly, WGS datasets are essential to precise genetic analysis and the development of personalized medicine.
Currently, large-scale population-wide WGS data have been disproportionately represented by individuals of European descent, and substantial contributions have been made by projects such as U.K. Biobank (13), FinnGen (14), deCODE (15), among others. The Eurocentric imbalance in genomic data could result in unequal benefits of precision medicine and raise health disparity concerns (16). For example, polygenic risk scores often showed several times greater accuracy for individuals with European ancestry compared to other ancestries (17). Recognizing the importance of capturing the broader spectrum of human genetic variation to implement personalized medicine tailored for a specific population, concerted efforts have been made to sequence samples in more diverse ethnic groups such as in Trans-Omics for Precision Medicine and in All of Us project (18, 19). In this context, noteworthy progress has also been made in generating WGS data from East Asian (EA) populations. Key initiatives such as GenomeAsia 100K (20), SG10K consortium (21), ChinaMap project (22), and Westlake BioBank for Chinese have been established (23). These efforts collectively uncover a wider range of genetic variants in EA populations, thereby enriching our understanding of this region’s genetic diversity. Regarding WGS data from the Japanese population, notable efforts have been made by the Tohoku Medical Megabank (ToMMo) project (24). Nagasaki et al. (25) conducted a WGS of 1070 Japanese individuals recruited from the northeastern area of Japan. This study identified rare genetic variants and structural variants (SVs) and generated a Japanese-specific reference panel. Subsequent sequencing efforts from ToMMo and others have continued, and summary-level allele frequencies (AFs) based on WGS of 3500 and 8300 Japanese individuals have been reported (26, 27). In addition, AF data based on a continually increasing number of individuals are available in the Japanese Multi-Omics Reference Panel database and the TogoVar database (27, 28). These datasets offer valuable information as a catalog of genetic variations in the Japanese population and are important for variant interpretation in the context of genetic counseling. Recently, the National Center Biobank Network has released WGS data from 9287 individuals to aim primarily for use as common control samples, further enriching the Japanese genetic data resource (29).
Here, we generated Japanese Encyclopedia of Whole-Genome/Exome Sequencing Library (JEWEL), a comprehensive WGS using samples from Biobank Japan (BBJ)—one of Japan’s largest biobanks and a leading entity in biobank research across Asia (note S1) (30, 31). Differing from ToMMo, which is based on the general population in the northeastern area of Japan, BBJ was established as a nationwide patient-based biobank to advance the genomic medicine research (32). JEWEL, by sampling from diverse geographic regions, aims to better capture the genetic diversity of the Japanese. Principal components analysis (PCA) has identified a dual population structure of Japanese consisting of the main-island cluster and Ryukyu cluster, and recent studies have highlighted substantial genetic heterogeneity within main-island Japanese (33–35). Using WGS, JEWEL offers an opportunity to further explore the fine-scale population structure. In addition, extensive efforts have been made to collect and curate deep phenotypes through a review of medical records, follow-up surveys, and examinations in BBJ. These include primary and secondary disease diagnoses, longitudinal clinical test results, past medical history, family history, and survival information. As a result, JEWEL is enriched with potentially pathogenic variants associated with diseases, and detailed clinical information permits targeted examination of carriers of particular interest. In this study, we present in-depth analyses that includes a reexamination of the genetic structure using both common and rare variants, characterization of LoF variants and human knockouts, and identification of archaic segments likely introgressed from Neanderthals or Denisovans. Last, we attempted to identify genetic loci potentially targeted by selection in the Japanese population.
|
|
|
|
Post by Admin on Apr 24, 2024 20:10:22 GMT
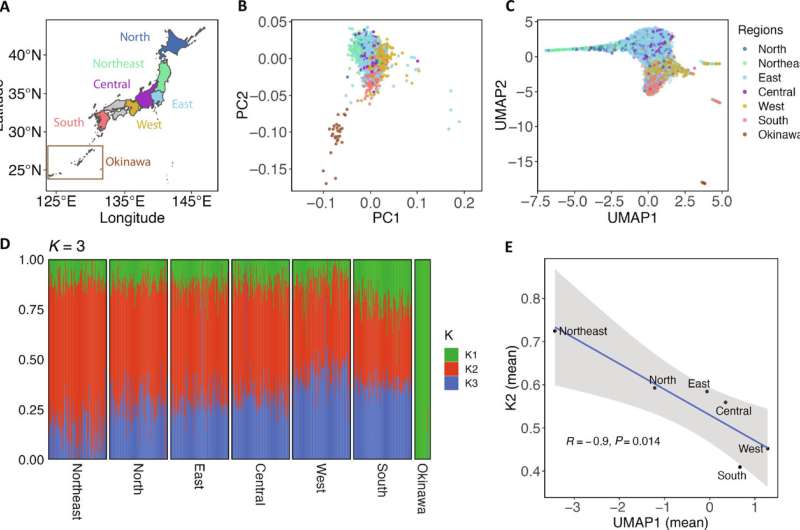
RESULTS Characteristics of the JEWEL WGS dataset A total of 3256 individuals, enrolled from medical institutes in seven geographic regions across Japan, were sequenced to generate JEWEL. These regions include Hokkaido, Tohoku, Kanto, Chubu, Kansai, Kyushu, and Okinawa, which are hereafter referred to as North, Northeast, East, Central, West, South, and Okinawa (see Materials and Methods and Fig. 1A). All regions except for Okinawa are located on the main islands of the Japanese Archipelago, commonly known as Hondo, while the term Okinawa in this study indicates the Ryukyu islands. The relative sample size proportionally reflects the population sizes of these regions in Japan (table S1). Sequencing was performed according to standard Illumina protocols, and an average WGS coverage depth of 25.6× was achieved. Variant calling was conducted according to established Genome Analysis Toolkit (GATK) best practices (see Materials and Methods and note S2 for details). The final dataset consisted of 45,586,919 single-nucleotide variants and 9,113,420 insertions or deletions (indels) from 23 chromosomes. We observed that 61 and 40% of variants were not registered in the Genome Aggregation Database (gnomAD) and ToMMo, respectively (26, 36) (table S2); 15,410,953 (32.7%) variants were only observed in JEWEL. Compared to microarray genotyping data, a high genotype concordance rate of 99.971% was obtained (see Materials and Methods). Using 42,389,421 biallelic autosomal single-nucleotide variants, we estimated the ratio of transition to transversion (Ti/Tv) to be 2.11, which was in line with recent large-scale WGS analyses (21, 22) (tables S2 and S3). These results confirmed that JEWEL dataset is of high quality in various aspects, allowing for a deeper analysis of the genetic characteristics of this population.  Fig. 1. Fine-scale genetic structure of the modern Japanese and its three ancestry origins. (A) Geographic regions in Japan from which the samples were recruited are described. These regions include the Japan archipelago, commonly known as Hondo, and the Ryukyu archipelago, which is termed as Okinawa in this study. The number of individuals from each region is provided in table S1. (B) PCA analysis based on common variants with a minor AF (MAF) ≥ 0.01. Individuals are colored according to their recruitment regions. (C) Rare variant–based PCA-UMAP analysis (0.001 ≤ MAF < 0.01) is displayed. (D) ADMIXTURE analysis with K set to 3. For regions other than Okinawa, 100 individuals were randomly selected and plotted. All 28 individuals from Okinawa were included in the plot. K1 represents Okinawa, while K2 and K3 are the highest in the Northeast and West, respectively. (E) UMAP1 is negatively correlated with the fraction of K2 ancestry. The correlations between each combination of UMAP and K are presented in fig. S5. |
|
|
|
Post by Admin on Apr 26, 2024 2:56:32 GMT
Triancestral origins of the Japanese population
We first conducted a conventional PCA based on 184,036 independent pruned common variants (see Materials and Methods). Consistent with previous studies, the analysis replicated the classic “dual-cluster” structure consisting of Okinawa and the Hondo clusters (Fig. 1B) (33, 35, 37). We hypothesized that rare variants might be more informative in revealing the population structure, and we conducted a PCA–Uniform Manifold Approximation and Projection (PCA-UMAP) analysis, which exclusively used 1,835,116 independent pruned rare variants (see Materials and Methods). The analysis uncovered an unprecedentedly fine structure of the Japanese population (Fig. 1C). This structure, resembling a “hummingbird,” not only recapitulated patterns obtained from PCA based on common variants but also highlighted several notable features. Specifically, we observed (i) a clearer separation among subregions of Hondo and a clearer distinction of Okinawa cluster from Hondo cluster, (ii) Northeast individuals clustered in a thin, narrow area, and (iii) additional subclusters of individuals from West and South (figs. S1 and S2 and note S3).
To gain a deeper insight into the population structure, we performed an unsupervised ADMIXTURE analysis based on common variants (see Materials and Methods and note S4). To determine the optimal K value, we used Structure Selector, a method demonstrated to exhibit superior performance compared to other estimators (38). In this analysis, all four metrics support the K value of three as the optimal number of ancestral components (fig. S3). In addition, we used badMIXTURE to evaluate the goodness of fit and observed no systematic pattern of large residuals, indicating an overall good fit at K = 3 (fig. S4) (39). Therefore, our data suggested that the Japanese population could be best modeled by admixtures of three ancestral components (hereafter K1 to K3). K1 to K3 were the highest in Okinawa, Northeast, and West, respectively (Fig. 1D and table S4). K1 (Okinawa) component maintains a relatively stable fraction of around 12% in Hondo subgroups, except for South (which is a region adjacent to Okinawa), with a higher proportion of 22%. K2 (Northeast) and K3 (West) components showed a cline from West to East. We also conducted the ADMIXTURE analysis using both common and rare variants and observed consistent results, with additional detail from Okinawa (note S4).
We observed significant correlations between K values and PCA-UMAP values, despite the former obtained from the analysis of common variants and the latter from rare variant analysis. This finding seemed to offer additional support for K = 3. Specifically, UMAP1 is significantly correlated with K2/K3 (Pearson coefficient = −0.69 with K2 and 0.60 with K3, P < 2.2 × 10⁻¹⁶ for both). This correlation pattern can also be clearly visualized by aggregating samples according to their respective regions (Fig. 1E and fig. S5). We additionally analyzed K values in the context of geography and found that the proportions of Okinawa (K1) and Northeast (K2) ancestries are correlated with geographic longitude. In contrast, the correlation with West (K3) is less pronounced and not statistically significant (fig. S6).
We attempted to gain hints about the potential ancestral origins of K1 to K3. Previous studies have suggested that Japanese carry Jomon and EA ancestry (represented by Han Chinese) (34, 40). Recently, the presence of Northeast Asian (NEA) ancestry has been proposed on the basis of analyses of ancient genomes (41, 42). In this context, we analyzed our data together with modern and ancient genetic data of Jomon, EA, and NEA. Using f4 ratio statistic, we estimated that Okinawa had the highest Jomon ancestry (28.5%), followed by Northeast (18.9%), and the lowest in West (13.4%) (see Materials and Methods and table S5). These results align with prior studies demonstrating a high genetic affinity between Jomon and Okinawa people (43, 44). Next, on the basis of outgroup f3 statistic, we observed that individuals from West had the highest shared genetic drift with Han Chinese (table S6). We then used f4 statistic in the form of f4 (Mbuti, ancient genome; Northeast, West) to evaluate differential genetic affinities between Northeast and West, in relation to ancient genomes reported from China, Korea, and Japan (41, 44–47). Our results indicated a significantly closer relationship between West and ancient Chinese groups around the Yellow River (YR) or upper YR region, specifically in the Middle Neolithic (MN) and Late Neolithic periods (table S7). In contrast, individuals of Northeast showed significantly higher genetic affinities with Jomon and ancient Japanese genome from Miyako Island in Okinawa (which had a high Jomon proportion) and ancient Koreans from the Three Kingdoms (TK) period (Korea-TK_2) (fourth to fifth century CE) (table S7). These results align with reports indicating that ancient Japanese in the Yayoi period and certain ancient Korean groups had a high proportion of Jomon ancestry (42, 47).
We subsequently used qpAdm to estimate contributions of NEA, EA, and Jomon ancestries in each subgroup, following the approach described in prior studies (41, 48) (see Materials and Methods). For this analysis, the Chinese Han was designated as representative of EA, while China_WLR_BA_o and China_HMMH_MN were grouped to represent NEA. The results revealed a generally good fit of the tripartite model to our dataset (table S8). The proportions and trends of Jomon ancestry estimated through qpAdm align with the findings from the f4 ratio test, revealing the highest proportion in Okinawa (25%) and the lowest in the West (7.5%). Likely because of the low Jomon ancestry in West, we observed that EA ancestry is the highest in South rather than West. However, the fitting of this model for Northeast was rejected, indicated by an extreme P value (P = 6.5 × 10⁻⁴). Exploring additional models, we found that Northeast could be alternatively modeled as a two-way admixture of Korea-TK_2 (68%) and Han (32%) (tables S8 and S9). Notably, among Hondo groups, Northeast showed the highest proportion of Korea-TK_2. For West, the initial three-way model that includes NEA, EA, and Jomon showed a better fit, as indicated by a lower chi-square value (9.14 compared to 11.8). Furthermore, the two-way admixture modeling involving combinations of Jomon, EA, and NEA proved to be unsuccessful (table S9). These multiple lines of evidence suggest that K1 and K3 may be linked to Jomon and EA ancestries. Although less clear, the ancestral origins of K2 could potentially be connected to ancient populations in Japan and the Korean Peninsula, such as Korea-TK_2.
Motivated by the above findings, we investigated whether this triancestral framework could offer insights into the likely origins of Japanese founder mutations. We focused on two high-frequency pathogenic mutations associated with hereditary breast cancer among Japanese patients—the BRCA1 Leu63Ter and the BRCA2 c.5576_5579delTTAA frameshift mutation. The former is specific to the Japanese population and has a significantly higher frequency in Eastern Japan than in Western Japan (49). In contrast, the latter has a high frequency in Western Japan and has been reported in other Asian populations, including Chinese (50) and Korean (51). Plotting BRCA1 Leu63Ter carriers in the PCA-UMAP showed that this mutation predominantly occurred in individuals with likely Northeastern ancestry, and its occurrence is significantly associated with UMAP1 (P = 9.04 × 10⁻⁶, logistic regression) (fig. S7). This pattern was not apparent when considering enrollment locations, as most carriers were recruited from East (seven of nine carriers were recruited from East, with the remaining two from North and Northeast). On the other hand, the BRCA2 c.5576_5579delTTAA mutation was predominantly observed in individuals of West ancestry (fig. S7). Our data align with a recent study based on ~100,000 Japanese samples, showing that BRCA1 Leu63Ter has the highest frequency in Northeast, while the BRCA2 frameshift mutation is most frequent in West (52). Despite our much smaller sample size, the rare variant–based fine structure sheds insights into the likely origins of the two mutations in Japanese. The data suggested that the BRCA1 Leu63Ter mutation likely originated in Northeast ancestry and spread to other regions. Since Japanese in West had a higher genetic affinity with Han Chinese, we speculate that this mutation may have been introduced to Japan from continental Asia. In addition, we explored whether K values are associated with quantitative phenotypes in JEWEL individuals based on linear regression. We found significant associations, particularly for total cholesterol (P = 2.69 × 10⁻¹³) and prothrombin time (PT; P = 1.33 × 10⁻¹²) with K1. Comparable P values of these traits with K2 were also observed (table S10).
|
|

