|
|
Post by Admin on Nov 6, 2013 0:20:03 GMT
 Recent immigrants to Britain are better educated, pay more taxes and draw less state benefits than native Britons. The findings, taken from official government data, came in a heavyweight report into the fiscal consequences of immigration to the UK, published on Monday by the Centre for Research and Analysis of Migration (CReAM) at University College London. The authors of the report concluded that fears that "benefit tourists" were coming to the UK with no intention of working were "disconnected from reality". David Cameron previously suggested immigration was a "constant strain" on public services. According to the report, immigrants who arrived after 1999 in Britain, and made up a third of the overall immigrant population in the UK in 2011, were 45% less likely to receive state benefits than native Brits. They were also 3% less likely to live in social housing. They were also better educated than native Britons. In 2011, 32% of those from the European Economic Area (EEA) and 43% of those from outside of the region had a university degree, whereas for native Brits it was less than one in five (21%). The contribution of recent immigrants (i.e. those who arrived after 1999) to the UK fiscal system, however, has been consistently positive and remarkably strong. Between 2001 and 2011 recent EEA immigrants contributed to the fiscal system 34% more than they took out, with a net fiscal contribution of about 22.1 billion GBP. In contrast, over the same period, natives’ fiscal payments amounted to 89% of the amount of transfers they received, or an overall negative fiscal contribution of 624.1 billion GBP. At the same time recent immigrants from non-EEA countries made a net fiscal contribution of 2.9 billion GBP, thus paying in the system about 2% more than they took out. The net fiscal balance of overall immigration to the UK between 2001 and 2011 amounts therefore to a positive net contribution of about 25 billion GBP, over a period over which the UK has run an overall budget deficit. Our analysis thus suggests that – rather than being a drain on the UK’s fiscal system – immigrants arriving since the early 2000s have made substantial net contributions to its public finances, a reality that contrasts starkly with the view often maintained in public debate. This conclusion is further supported by our evidence on the degree to which immigrants receive tax credits and benefits compared to natives. Recent immigrants are 45% (18 percentage points) less likely to receive state benefits or tax credits. These differences are partly explainable by immigrants’ more favourable age-gender composition. However, even when compared to natives with the same age, gender composition, and education, recent immigrants are still 21% less likely than natives to receive benefits. There are differences between EEA and non-EEA immigrants: recent EEA immigrants are more than 50% less likely than natives to receive state benefits or tax credits compared to a 43% lower likelihood for recent non-EEA immigrants. www.cream-migration.org/publ_uploads/CDP_22_13.pdf |
|
|
|
Post by Admin on Jan 7, 2014 14:48:07 GMT
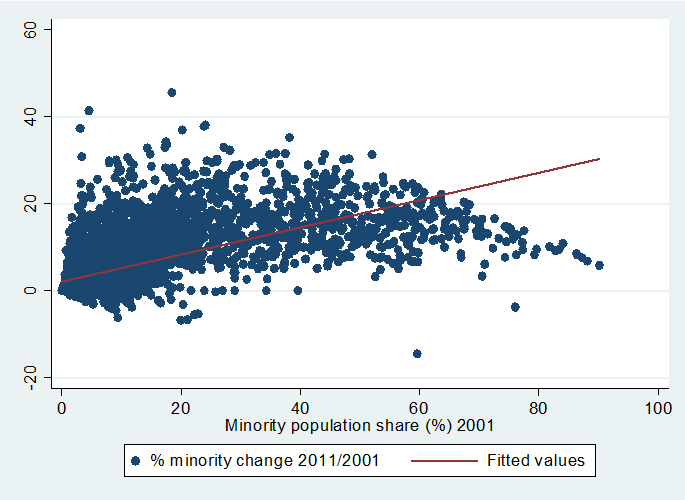 Figure 1: Minority growth in ward 2001-11, by ward minority share in 2001 The upward slope of the red fitted line shows that those which had higher shares of ethnic minorities in 2001 (horizontal axis) experienced a larger point increase in their minority shares (vertical axis) over 2001-11. This is perplexing since the lower the share of minorities in a ward, the greater the room to increase percentage share. Counterurbanists see this as a function of income: minorities are poorer and hence less able to leave undesirable areas, which happen to be more heavily minority to begin with. Proponents of white flight suggest white discomfort, or racism, repels them from diversity toward white areas. But what would both make of the plot in figure 2, of the change in the Bangladeshi share of a ward’s population over 2001-11 (vertical) against that of initial Bangladeshi share in 2001. 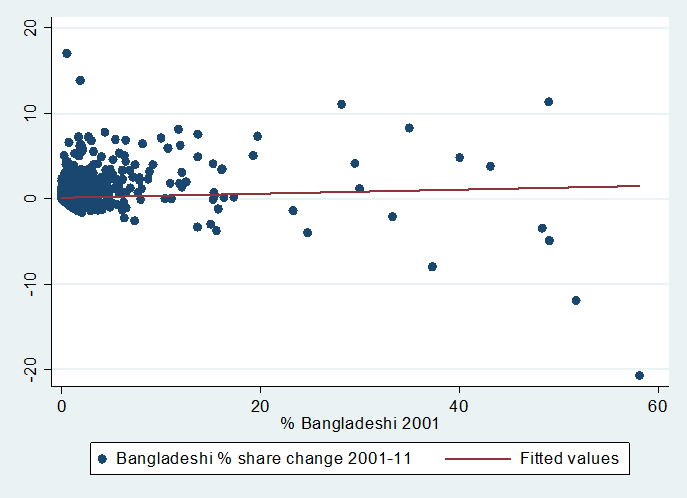 Figure 2: Bangladeshi growth in ward 2001-11, by ward Bangladeshi share in 2001 Now the line is virtually flat. This means Bangladeshis are barely more attracted to Bangladeshi wards than non-Bangladeshis are. The slope of the Pakistani line is positive, but much less so than for minorities as a whole, while the line for Afro-Caribbeans is strongly negative suggesting outright dispersal. All told, the story is that minorities, when treated as a single category, are attracted to minority areas and whites to white areas, yet individual minority groups are not sticking together. Indeed, in a study of aggregate patterns, Ron Johnston and his colleagues show that the main ethnic minority groups are dispersing from their areas of concentration. This is clearly evident in maps of the location of ethnic groups in London between 1991 and 2011 prepared by Gareth Harris. Yet obtaining a clearer picture of whether age, class, ethnicity or some other factor drives ethnic movement requires information on individuals, not just areas. And we need longitudinal data that tracks people over time. Accordingly we use two world-leading datasets, the ONS Longitudinal Survey (ONS LS) and British Household Panel Survey (BHPS)/Understanding Society (UKHLS). Both are under scrutiny and the ONS LS in particular needs to be defended from government proposals to shelve it in the name of short-termism. These show that while minorities are dispersing from their concentration areas, they are also – relative to whites – avoiding the heavily white wards which comprise 80 percent of England and Wales. Thus for minorities the big destinations are ‘superdiverse’ mixed-minority areas such as much of Newham in East London. Britain’s minorities generally live in different parts of the country, and in different sections of London – Indians around Leicester, Pakistanis in the West Midlands and Bangladeshis in Tower Hamlets, for instance. Yet these groups are drawing closer together: segregation has fallen fastest between minorities, such as Pakistanis and Bangladeshis. Whites and individual minority groups such as Bangladeshis are also less segregated however segregation between white British and minorities as a whole shows little decline. Keen to explore determinants of movement with racial attitude questions, we commissioned a YouGov survey in August 2013 which asked people whether they moved ward in the past ten years, and if so, from a ward with more, less or similar diversity. We netted around 1700 white British respondents of whom about 200 said they had moved to a more or less diverse ward over the past decade. Whether the question asked about comfort with a boss of a different race or a Prime Minister of a different race, anti-immigration views or neighbourhood minority comfort thresholds, the result was the same. Namely, that racial and immigration attitudes had almost no effect on white mobility. Only at the conservative extremes did attitudes affect behaviour, but this was a marginal effect operating on 1 or 2 percent of the sample. Commenting on our results in the Guardian after hearing our seminar at the National Institute for Economic and Social Research (NIESR), Hugh Muir suggests the evidence points to culture rather than race or income. We controlled for the urbanity and affluence of wards but not for their cultural capital. Karl Deutsch’s concept of the prestige direction of assimilation and Pierre Bourdieu’s notion of cultural capital suggest wards exert an ethnically-specific allure, regardless of physical amenities. White areas have some appeal for minorities provided they are not – like most of England and Wales – so white as to be intimidating; but diverse areas attract white British people only when they are in their twenties. The prestige direction of assimilation is toward the white British core, which accounts for why whites tend to choose whiter places when they move. White attraction rather than repulsion seems therefore to be the story. |
|

