|
|
Post by Admin on Mar 16, 2022 20:53:48 GMT
Inter- and intraregional relationships Next, we modelled the ancestry of the ancient foragers in an admixture graph framework to test additional hypotheses concerning their relationships, aided by a new methodology to increase available information from low-coverage data (Figs. 2 and 3, Methods, Supplementary Notes 6 and 7 and Extended Data Figs. 2–5). In model 1, along with other populations, we included three geographically and genetically diverse ancient eastern and south-central African individuals with high sequencing coverage: I4426 (Fingira, about 2.5 ka), I8821 (Kisese II) and I8808 (Jawuoyo). On the basis of the results in the previous section, we hypothesized that they could be fit with mixtures of three ancestry components: one related to the Mota individual (representing an ancient group of foragers from the northern part of eastern Africa), one related to central African foragers (represented by present-day Mbuti) and one related to southern African foragers (represented by four ancient individuals from South Africa). Indeed, we obtained a good fit to the data in model 1 (max residual Z = 2.0), even when specifying identical sources for all three individuals, and the relative ancestry proportions were as expected: Mota-related ancestry decreased from north to south, and Jawuoyo (I8808) had the highest ratio of central-African-related ancestry to southern-African-related ancestry. Omitting any of the three components for any of the individuals results in a poor fit (Z ≥ 4.0) (Supplementary Note 6). As in ref. 16, we also estimated around 30% of a separate and deeply diverged ‘ghost’ ancestry component in the Mota individual (replicated here using new higher-coverage diploid whole-genome data). Fig. 2: Schematic of admixture graph results. 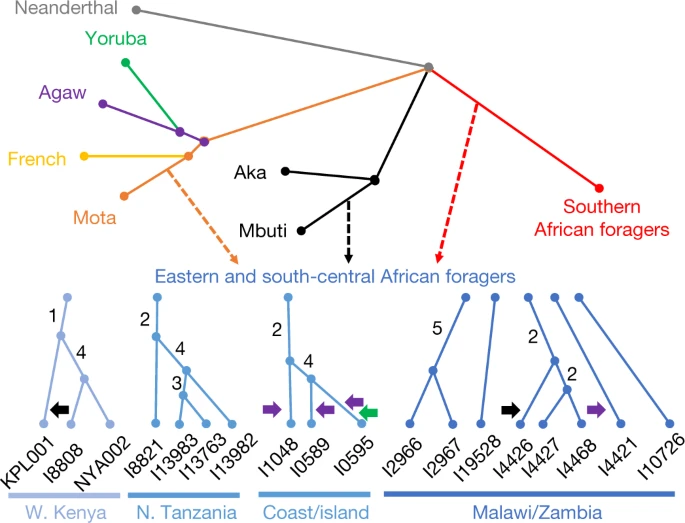 Branch lengths are not to scale. The arrows denote admixture events, with the three primary components of ancestry shown as dashed arrows, and other inferred gene flow as small solid arrows (with colours corresponding to related groups). Subclusters of ancient eastern and south-central African foragers reflect the inferred instances of excess relatedness among individuals, with internal branch lengths shown in genetic-drift units. Mixture proportions are shown in Fig. 3 and Supplementary Table 9 and the full results are shown in Extended Data Fig. 4. Individual laboratory numbers are shown at the bottom (Extended Data Table 1). N., north; W., west. |
|
|
|
Post by Admin on Mar 16, 2022 21:28:12 GMT
Fig. 3: Distribution of main ancestry components. 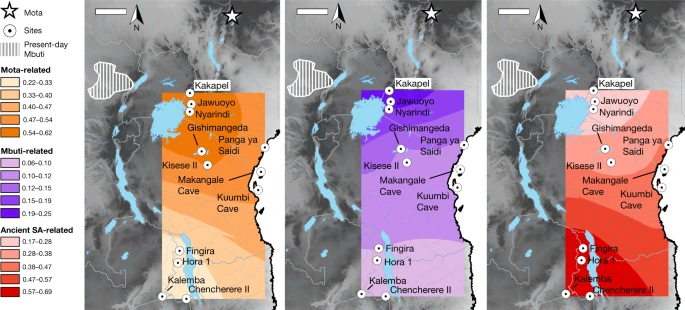 Kriged distribution of the proportions of each of the three main ancestry components (summing to 1) found in ancient eastern and south-central African foragers analysed in this study (details are provided in Supplementary Table 9). The approximate present-day Mbuti home region is from ref. 41. Individuals from the same site were included using locations that differed by 0.000001 decimal degrees latitude to ensure representation in the interpolation. Scale bars, 250 km. Topographical data are from the Shuttle Radar Topography Mission (SRTM)42. SA, southern African. When we added more individuals to create models 2 and 3 (max residuals Z = 3.0 and Z = 3.7), we found that the overall inferred structure and parameters were similar to those of model 1 (Supplementary Tables 9 and 10; see below for specific individuals and regions). The Mota-related and southern-African-related ancestry sources are inferred to split deeply along their respective lineages, meaning that, in some sense, they represent ‘ghost’ populations (without closely related sampled representatives). The central-African-related component is inferred to be closer to Mbuti (including an ancestral admixture event; Supplementary Note 6) than to Aka, and therefore to not split as deeply relative to the initial divergence of the central African forager lineage. Almost all of the additional significant allele-sharing signals that we observed beyond those in model 1 can be attributed to one of the three following causes (Supplementary Table 11): (1) excess relatedness at short-distance scales (see below); (2) admixture from pastoralists and/or farmers more recent than our period of focus (four individuals); or (3) contamination (two individuals). In these cases, we adjusted our final model by (1) allowing shared history (that is, genetic drift) between the relevant individuals; (2) adding the inferred admixture events; or (3) incorporating extra admixture to represent the contamination source (Supplementary Note 6). For sites in western Kenya, we found that all three individuals in model 3 have excess relatedness beyond the baseline expectation (Fig. 2). The individuals from Jawuoyo (I8808) and Nyarindi (NYA002/NYA003) are the closest, and they can be modelled with Mota-related, central-African-related and southern-African-related ancestry in respective proportions of about 62%, 19% and 19%, while the individual from Kakapel (KPL001) is inferred to have around 12% additional central-African-related ancestry (s.e. of approximately 2–4% with some assumptions) (Fig. 3 and Supplementary Note 6). For north-central Tanzanian sites, again all four individuals have signals of mutual excess allele sharing, with the three individuals from Gishimangeda (I13763, I13982 and I13983) being the closest. One of the three (I13763) shows excess relatedness to non-African individuals, which we interpret as evidence of a small proportion of contamination (Supplementary Notes 5 and 6); otherwise, all four can be fit as a clade with 54%, 12% and 34% Mota-related, central-African-related and southern-African-related ancestry, respectively. Similarly, the three island and coastal individuals (Makangale Cave I1048, Kuumbi Cave I10589, Panga ya Saidi I0595) display excess relatedness, with those from Kuumbi Cave and Panga ya Saidi closest to one another, and with 49% Mota-related, 12% central-African-related and 39% southern-African-related ancestry. These individuals also have ancestry admixed from populations that are associated with food production: Agaw-related for all three, plus western-African-related for Panga ya Saidi (I0595) (Supplementary Note 6). In contrast to Kenya and Tanzania, we did not observe widespread signals of excess relatedness in Malawi and Zambia. After adjusting for ancestry proportions, most individuals within this geographical cluster are no more related to one another than they are to individuals from Kenya and Tanzania. The only notable exceptions that we found among those in model 3 (Supplementary Note 6) were as follows: (1) among individuals from Fingira (I4426, I4427 and I4468), in particular, two dating to about 6.1 ka; and (2) between the individuals from 9–8 ka from Hora 1 (I2966 and I2967). However, other individuals separated by as little as 100–150 km (Fingira-Hora 1 and Chencherere II-Kalemba) can be fit well with independent mixtures of the same ancestry sources used across the entire study region, including some individuals around 700–1,500 km away. At the same time, the inferred ancestry proportions for the individuals from Malawi and Zambia are quite similar (about 20–30% Mota-related, 5–10% central-African-related and 60–70% southern-African-related), with significant (but small) differences observed for I4426 from Fingira (approximately 11% additional central-African-related ancestry), I4421 from Chencherere (approximately 4% ancestry related to pastoralists), I10726 from Kalemba (approximately 5% less Mota-related ancestry than in Malawi) and I2966 from Hora 1 (a small amount of contamination). We also built an alternative version of our model in which we specified the Malawi individuals as forming a clade descended from a shared three-way admixture event (plus small proportions of additional admixture for the aforementioned individuals) that had only a slightly worsefit—confirming the very similar ancestry proportions among the individuals—but that featured zero shared drift at the base of the clade and almost none on the internal branches (Supplementary Note 6 and Extended Data Fig. 6). We examined the relationship between geographical distance and genetic relatedness using a new approach based on the residuals of a model assuming that there is no excess shared genetic drift—that is, we observed the similarity of genotypes within pairs of individuals relative to that predicted solely by differential proportions of the three ancestry sources (Methods). Using pairs of individuals from either Kenya and Tanzania, or Malawi and Zambia, together with inter-region pairs to plot the residuals as a function of distance, we found greater relatedness at short distances, but with different length scales for the decay of the fitted curves (about 60 km and about 3 km, respectively) (Extended Data Fig. 7a). Similar patterns are also observed if we omit pairs of individuals that were buried at the same site (Extended Data Fig. 7b). Thus, with the caveats that our sampling is not uniform and that not all of the individuals lived contemporaneously, we found on average that (1) individuals from the same or nearby sites are more closely related than predicted solely on the basis of the broad regional genetic structure, but (2) this relatedness extends only over short distances, particularly within Malawi and Zambia. For a comparative perspective from contemporaneous ancient foragers in temperate environments, where there are more extensive available data, we performed similar analyses for individuals from Mesolithic Europe (n = 36, about 12–7 ka) (Methods, Supplementary Table 12 and Extended Data Fig. 7c, d). Both western and eastern/northern Europe also show a pattern of greater relatedness at shorter distances; western Europe is similar to Malawi and Zambia in that almost all of the signal comes from same-site pairs, but eastern/northern Europe has a substantially longer geographical decay scale. Finally, we compared the ancient individuals to the present-day Sandawe and Hadza groups in Tanzania, who historically or recently practiced foraging lifeways. Previous studies have shown that the Hadza and Sandawe have distinctive ancestry from their neighbours, with unusually high proportions of ancestry related to ancient African foragers11,13,14,22. We built an extended version of model 2 including both groups (Extended Data Fig. 8 and Supplementary Note 6). In contrast to the general pattern for ancient individuals, we could not fit Hadza and Sandawe into a simple regional clade, even after accounting for recent admixture that is probably related to incoming pastoralists and farmers (contributing a total of about 41% and about 62% ancestry for these Hadza and Sandawe individuals, respectively). In particular, both were inferred to share a lineage closest to ancient foragers from north-central Tanzania, but the Hadza had excess allele sharing with the Mota individual, while the Sandawe had excess allele sharing with southern African foragers. |
|
|
|
Post by Admin on Mar 17, 2022 1:13:27 GMT
Effective population sizes We inferred recent (up to about 500 years before the individual’s birth) ancestral effective population sizes (Ne) for the higher-coverage ancient individuals by scanning for long runs of homozygosity (ROH), which are expected to be present in the genomes of individuals either from populations with small sizes or whose parents have familial relatedness (the latter resulting in especially long ROH) (Methods and Extended Data Fig. 9). The calculation of Ne depends on several factors in addition to census population size; in particular, Ne is a function of both population density and the distance scale of those social interactions that lead to reproduction. All of the ancient individuals are inferred to have at least one long ROH (> 4 centimorgans (cM)), consistent with broad worldwide trends towards smaller population sizes in more ancient societies23. However, the Ne estimates vary by an order of magnitude, from individuals with minimal ROH, suggesting relatively larger population sizes (I5950 (Mota): Ne = 5,470, 95% confidence interval (CI) = 1,237 to unbounded; I8821 (Kisese II): Ne = 2,640, 95% CI = 881–16,424) to those with an ROH of longer than 100 cM, indicative of much smaller population sizes (for example, I8808 (Jawuoyo): Ne = 377, 95% CI = 229–678). Overall, the range is similar to many African forager groups today (Ne, around 500–1,500)24 and towards the low end when compared with present-day population sizes worldwide23. 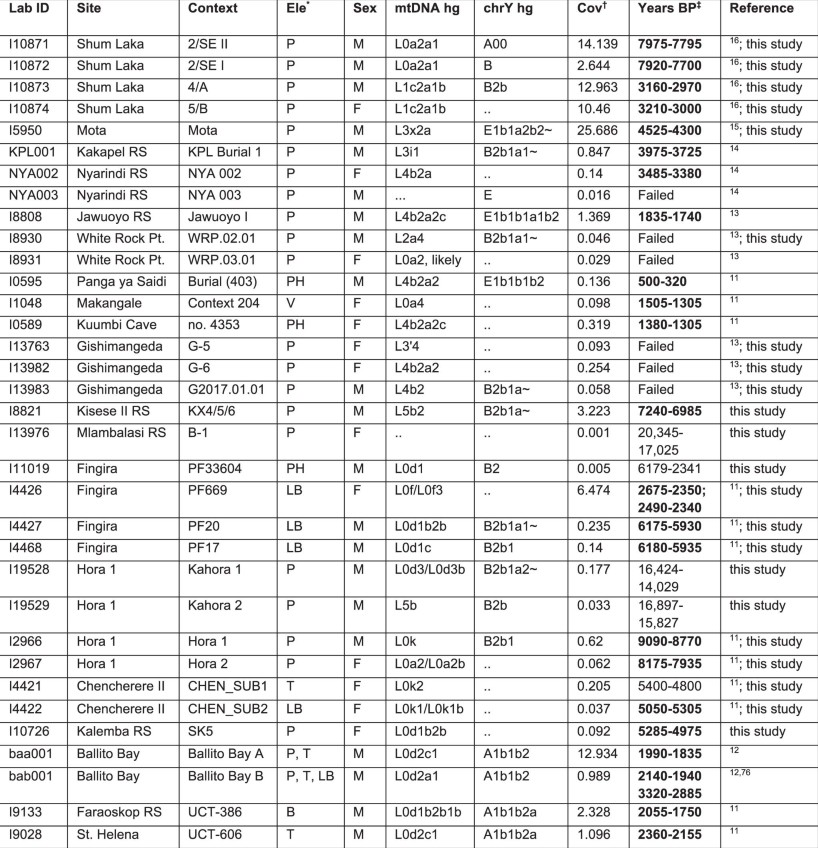 Extended Data Table 1 Ancient individuals analysed in this study Discussion In contrast to previous studies, our results show that a two-way clinal model extending latitudinally from eastern to southern Africa is insufficient to explain observed patterns of genetic variation in ancient sub-Saharan African foragers. Here we demonstrate that central-African-related ancestry (closest to present-day Mbuti among sampled populations), along with Mota-related and southern African-related ancestry, was ubiquitous (in varying proportions) from southwestern Kenya to southeastern Zambia (Fig. 3), with all three components present by at least about 7 ka in Tanzania and about 16 ka in Malawi. Furthermore, when considering ancient African foragers from a wide range of time periods, ecological contexts and archaeological associations, geographical proximity remains the strongest predictor of genetic similarity5,11. Such a pattern may indicate that long-range migrations were rare in the terminal Pleistocene and Holocene, when these individuals lived. This hypothesis is supported by the signals in our admixture graphs of excess genetic relatedness at subregional scales but not at longer-distance scales. Although it is not possible at present to estimate when and how quickly this three-way cline emerged, it must have post-dated both the emergence of the Mota-related lineage around 80–60 ka12,16 and, with respect to the central-African-related ancestry, the split between Aka and Mbuti less than around 50 ka25,26. Although the observed cline of ancestry remained stable for thousands of years, we propose that it initially arose closer to this split time than to the terminal Pleistocene, and under qualitatively different patterns of mobility and admixture than after it was established. Dispersals, interactions and extensive admixture across eastern and south-central Africa before around 16 ka are evidenced by substantial proportions of ancestry related to the Mota (Ethiopia) individual as far south as Zambia, and ancestry related to southern African foragers as far north as Kenya, in combination with a high degree of homogeneity of ancestry in each subregion after that time. If patterns of mobility and social interactions had remained consistent throughout the Late Pleistocene and Holocene, we would expect to find broad evidence of longer-range ancestry connections within eastern and south-central Africa and beyond, but we observed only two significant plausible instances among our sampled individuals (involving extra central-African-related ancestry in one individual each from Kenya and Malawi). However, within the three-way population structure, we observed distinct regional trajectories. Individuals from Kenya and Tanzania form three clusters (western Kenya, north-central Tanzania and coastal/island), with individuals in the same cluster showing excess allele sharing even beyond what would be expected from having similar ancestry proportions. This suggests that there is elevated gene flow within each subregion, on a distance scale estimated as approximately 0–100 km. By contrast, the only signals of elevated relatedness detected for individuals from Malawi and Zambia involve those buried at the same site, and can span 1,000–3,600 years (for example, at Fingira). This pattern is best explained by low average human dispersal/interaction distances during much of the Late Pleistocene and Holocene, with the establishment of the broad-scale ancestry cline followed by, on average, more local interactions that differed by region. We observed a similar pattern in ancient foragers from western Europe, whereas those from northern and eastern Europe show longer distance scales of relatedness. This provides genetic evidence that the average distances between where people lived and where their ancestors lived (and therefore the average distances of human movement, especially with respect to reproductive partners) differed among foragers in different regions. Our genetic findings offer new insights on demographic processes of the Late Pleistocene to Holocene that were previously studied using bioarchaeological, archaeological and linguistic evidence. Beginning approximately 300 ka, archaeological evidence attests to the long-distance movement of materials such as obsidian, presumably facilitated by social networks27. Exchange intensified through the Late Pleistocene to become a hallmark of the LSA, culminating in elaborate transport networks and shared material culture traditions by the Early Holocene1,4,28,29. However, the extent to which people were moving with objects remains an open question. Our genetic results support a scenario in which human mobility and longer-range gene flow occurred with the development and elaboration of long-distance networks approximately 80–20 ka, contributing to the formation of a population structure that persisted over tens of thousands of years during a period when people were living locally. Genetic evidence also adds weight to arguments for changing Late Pleistocene interaction spheres, with limited gene flow accompanying changes in behaviour and possibly linguistic boundaries. However, at this juncture, we are unable to assess hypothesized population density shifts, based on heightened evidence for symbolic expression at LSA sites and the appearance and disappearance of specific artefact types8,9,30,31,32. Our genetic estimates of recent effective population size are consistent with those of at least some present-day African foragers24, but they are not good comparators due to demographic pressures recently placed on such groups33. Furthermore, small subpopulations with limited gene flow could result in low ancestral effective population sizes even if the region’s total population is high. Preservation of genetic diversity through the existence of many subpopulations over long time scales could also be a contributor to the high levels of genetic diversity observed in most present-day sub-Saharan African groups. The LSA archaeological record testifies to the appearance of well-defined, temporally and spatially bounded material culture traditions34,35, a phenomenon that is sometimes referred to as regionalization. Faunal data indicate subsistence intensification after around 20 ka36,37, and linguistic data also suggest shifts toward local interactions, reflected in the fact that, today, communities that are presently or historically associated with foraging in central, eastern and southern Africa speak languages of different families (in central Africa, adopted from recent arrivals). At the same time, past regional connectivity and borrowing was such that linguists previously characterized ‘click’ languages as a single family, and the proposed grouping of Khoe–Kwadi–Sandawe strengthens evidence for longer-distance ties between eastern and southern Africa38,39. Our genetic results confirm that trends toward regionalization extended to human population structure, suggesting that decreasing gene flow accompanied changes in behaviour and possibly language. Conclusions Demographic transformations in the past approximately 5,000 years have fundamentally altered regional population structures and largely erased what was, by the Late Pleistocene, a well-established three-way cline of eastern-, southern- and central-African-related ancestry that extended across eastern and south-central Africa. Groups who historically forage have frequently been pushed to marginal environments and have experienced transformative demographic changes, making it difficult to learn about deep history from present-day DNA. Today, Africa houses the greatest human genetic diversity, but undersampling of both living and ancient individuals obscures the origins of this diversity40. We show that aDNA from tropical Africa can survive from the Pleistocene and reveal patterns that could not be inferred from populations that lived even a few millennia later, underscoring the breadth of African genetic diversity and the importance of eastern and south-central Africa as long-term reservoirs of human interaction and innovation. |
|
|
|
Post by Admin on Apr 17, 2022 20:14:49 GMT
Human Y chromosome haplogroup R-V88: a paternal genetic record of early mid Holocene trans-Saharan connections and the spread of Chadic languages
Fulvio Cruciani, Beniamino Trombetta, Daniele Sellitto, Andrea Massaia, Giovanni Destro-Bisol, Elizabeth Watson, Eliane Beraud Colomb, Jean-Michel Dugoujon, Pedro Moral & Rosaria Scozzari
European Journal of Human Genetics volume 18, 800–807 (2010)
Abstract
Although human Y chromosomes belonging to haplogroup R1b are quite rare in Africa, being found mainly in Asia and Europe, a group of chromosomes within the paragroup R-P25* are found concentrated in the central-western part of the African continent, where they can be detected at frequencies as high as 95%. Phylogenetic evidence and coalescence time estimates suggest that R-P25* chromosomes (or their phylogenetic ancestor) may have been carried to Africa by an Asia-to-Africa back migration in prehistoric times. Here, we describe six new mutations that define the relationships among the African R-P25* Y chromosomes and between these African chromosomes and earlier reported R-P25 Eurasian sub-lineages. The incorporation of these new mutations into a phylogeny of the R1b haplogroup led to the identification of a new clade (R1b1a or R-V88) encompassing all the African R-P25* and about half of the few European/west Asian R-P25* chromosomes. A worldwide phylogeographic analysis of the R1b haplogroup provided strong support to the Asia-to-Africa back-migration hypothesis. The analysis of the distribution of the R-V88 haplogroup in >1800 males from 69 African populations revealed a striking genetic contiguity between the Chadic-speaking peoples from the central Sahel and several other Afroasiatic-speaking groups from North Africa. The R-V88 coalescence time was estimated at 9200–5600 kya, in the early mid Holocene. We suggest that R-V88 is a paternal genetic record of the proposed mid-Holocene migration of proto-Chadic Afroasiatic speakers through the Central Sahara into the Lake Chad Basin, and geomorphological evidence is consistent with this view.
Introduction
The Sahara, covering about one third of the African continent from the Atlantic Ocean to the Red Sea, is the earth's most extensive desert. Over the past thousands of years, the Sahara has undergone dramatic climatic oscillations including arid phases, during which it was largely uninhabitable, and humid episodes, which transformed the desert into a fertile landscape.1 After a hyper-arid period about 23–14.5 kya, the Saharan region experienced a monsoonal moist climate, characterized by increased rainfall.2, 3 During the Holocene Climatic Optimum (about 10–5 kya), a few thousand years after the beginning of the humid period, flora and fauna repopulated the desert, and a mosaic of savannah and woodland became well established throughout much of the Sahara.3 At the same time, the Sahara was home to giant lakes,4 the largest of which, the paleolake Megachad, may have possibly covered an area of at least 400 000 km2, more than the Caspian Sea, the biggest lake on earth today.5 This greening scenario was interrupted by a number of arid episodes, and at about 5–6 kya, the region experienced a rapid onset of dryer conditions. These marked the beginning of a shift towards permanent aridity, with variations in the distribution and timing of these changes between the eastern and central/western Sahara.3 Human–environment interactions in the Sahara have been greatly influenced by these climate fluctuations.1
Close links between climatic variations and prehistoric human occupation of the Sahara during the early mid Holocene (10–5 kya) are documented by archeological6, 7, 8 and paleoanthropological9, 10 evidence. However, genetic studies have been limited and mainly focused on uniparental markers and the role of the Nile basin as a corridor for human movements between northeastern and eastern Africa.11, 12, 13, 14
There have only been a few high-resolution analyses to date regarding the distribution of Y-specific haplogroups in the African continent. The emerging picture indicates a clear differentiation between central/western sub-Saharan and northern African populations. Haplogroup E-DYS271, which accounts for >70% of the Y chromosomes in most of the populations south of the Sahara, is found on an average at a frequency of 2–3% in Northern Africa, whereas haplogroups J-M304, E-M81, and E-M78, which on the whole account for 50–90% of the northern African male-specific region of the Y chromosome (MSY) gene pool, have been only rarely observed in west/central sub-Saharan Africa.12, 13, 14, 15, 16, 17, 18, 19, 20, 21, 22, 23, 24, 25
A group of chromosomes of potential interest to past trans-Saharan connections is the paragroup R1b1* (R-P25*). Cruciani et al18 found this paragroup (at that time defined as haplogroup 117, or R-M173*(xSRY10831, M18, M73, M269)) to be present at high frequencies (up to 95%) in populations from northern Cameroon. The same paragroup was only rarely observed in other sub-Saharan African regions, and not observed at all in western Eurasia.18 Subsequent studies dealing with the MSY diversity in Africa have confirmed the presence of R-P25*(xM269) in northern Cameroon at high frequencies23 and, at lower frequencies (mean 5%, range 0–20%), of R-P25* immediately south of Cameroon, in several populations from Gabon.25 Interestingly, chromosomes of haplogroup R-P25/R-M173, ancestral for M269 as well as for other ‘Eurasian’ downstream markers, have been found to be present in northern Africa (1% in Algeria, 4% in Tunisia, and 2–4% in Egypt).20, 23, 26 The presence of R-P25 Y chromosomes has also been reported in population groups from the Sudan;27 however, as no internal markers were typed, the sub-haplogroup affiliation of these chromosomes remains undefined.
To shed some light on the past demographic processes that determined the present distribution of R-P25* in Africa, we searched for new MSY mutations refining the phylogeny of haplogroup R1b, and surveyed a wide range of African populations (>1800 males from 69 populations) for the presence of the R1b haplogroup. More than 3500 subjects from Europe and Asia were also analyzed for the same haplogroup to obtain a better insight into the Asia-to-Africa back migration associated with this haplogroup.
|
|
|
|
Post by Admin on Apr 17, 2022 20:33:53 GMT
Materials and methods
Subjects
In all, 5326 Y chromosomes from Africa and Eurasia (Table 1) were analyzed for the haplogroup R1b internal markers (Ref. 18 and this study). For all subjects, an appropriate informed consent was obtained. Four R1b subjects (two Africans R-P25* and two Europeans of haplogroup R-M269 and R-P25*) were selected to identify new mutations. Samples were obtained from peripheral blood, cultured cells, hair roots, or buccal swabs, and DNA was extracted using appropriate procedures (either phenol–chloroform extraction followed by ethanol precipitation or purification by QIAamp kit from Qiagen, Milan, Italy).
Table 1 Frequencies (%) of Y chromosome R1b subhaplogroups in Africa and Eurasia
From: Human Y chromosome haplogroup R-V88: a paternal genetic record of early mid Holocene trans-Saharan connections and the spread of Chadic languages

 	 	 	 	 	Haplogroup
 	 	 	 	 	R1b1a	R1b1a*	R1b1a1	R1b1a2	R1b1a3*	R1b1a3a	R1b1a4	R1b1b1	R1b1b2
 	Region and population	Country	Linguistic affiliation a	N	R-V88	R-V88*	R-M18	R-V8	R-V35*	R-V7	R-V69	R-M73	R-M269	Y(xR1b)*	Reference
Northern Africa
 1	Moroccan Arabs	Morocco	AA/Semitic	55	 	 	 	 	 	 	 	 	1.8	98.2	b , c
 2	Asni Berbers	Morocco	AA/Berber	54	 	 	 	 	 	 	 	 	1.9	98.1	b
 3	Bohuria Berbers	Morocco	AA/Berber	67	 	 	 	 	 	 	 	 	 	100.0	b
 4	Moyen Atlas Berbers	Morocco	AA/Berber	69	 	 	 	 	 	 	 	 	 	100.0	b , c
 5	Marrakech Berbers	Morocco	AA/Berber	27	 	 	 	 	 	 	 	 	 	100.0	b
 6	Souss Berbers	Morocco	AA/Berber	34	 	 	 	 	 	 	 	 	 	100.0	b
 7	Ouarzazate Berbers	Morocco	AA/Berber	32	3.1	3.1	 	 	 	 	 	 	 	96.9	b
 8	Mozabite Berbers	Algeria	AA/Berber	67	3.0	3.0	 	 	 	 	 	 	 	97.0	b
 9	Northern Egyptians	Egypt	AA/Semitic	49	4.1	4.1	 	 	 	 	 	 	2.0	93.9	b
10	Egyptian Berbers from Siwa	Egypt	AA/Berber	93	26.9	23.7	 	 	 	 	3.2	 	1.1	72.0	b
11	Egyptians from Baharia	Egypt	AA/Semitic	41	4.9	 	 	 	 	 	4.9	 	2.4	92.7	b
12	Egyptians from Gurna Oasis	Egypt	AA/Semitic	34	 	 	 	 	 	 	 	 	 	100.0	b
13	Southern Egyptians	Egypt	AA/Semitic	69	5.8	2.9	 	 	 	 	2.9	 	 	94.2	b
Western Africa
14	Mandenkad	Senegal	NC/Mande	16	 	 	 	 	 	 	 	 	 	100.0	b
15	Mossi	Burkina Faso	NC/Gur	49	 	 	 	 	 	 	 	 	 	100.0	c
16	Rimaibe	Burkina Faso	NC/Atlantic	37	 	 	 	 	 	 	 	 	 	100.0	c
17	Fulbe from Burkina Faso	Burkina Faso	NC/Atlantic	21	 	 	 	 	 	 	 	 	 	100.0	c
Central Africa
18	Songhai	Niger	NS/Songhai	10	 	 	 	 	 	 	 	 	 	100.0	b
19	Fulbe from Niger	Niger	NC/Atlantic	7	14.3	14.3	 	 	 	 	 	 	 	85.7	b
20	Tuareg	Niger	AA/Berber	22	4.5	4.5	 	 	 	 	 	 	 	95.5	b
21	Ngambai	Chad	NS/Sudanic	11	9.1	9.1	 	 	 	 	 	 	 	90.9	b
22	Hausa	Nigeria (North)	AA/Chadic	10	20.0	20.0	 	 	 	 	 	 	 	80.0	b
23	Fulbe from Nigeria	Nigeria (North)	NC/Atlantic	32	 	 	 	 	 	 	 	 	 	100.0	b
24	Yorubad	Nigeria (South)	NC/Defoid	21	4.8	4.8	 	 	 	 	 	 	 	95.2	b
25	Ouldeme	Cameroon (North)	AA/Chadic	22	95.5	95.5	 	 	 	 	 	 	 	4.5	b
26	Mada	Cameroon (North)	AA/Chadic	17	82.4	76.5	 	 	 	 	5.9	 	 	17.6	b
27	Mafa	Cameroon (North)	AA/Chadic	8	87.5	25.0	 	 	 	 	62.5	 	 	12.5	b
28	Guiziga	Cameroon (North)	AA/Chadic	9	77.8	22.2	 	 	 	 	55.6	 	 	22.2	b
29	Daba	Cameroon (North)	AA/Chadic	19	42.1	36.8	 	 	 	 	5.3	 	 	57.9	b
30	Guidar	Cameroon (North)	AA/Chadic	9	66.7	22.2	 	 	 	 	44.4	 	 	33.3	b
31	Massa	Cameroon (North)	AA/Chadic	7	28.6	14.3	 	 	 	 	14.3	 	 	71.4	b
32	Other Chadic	Cameroon (North)	AA/Chadic	4	75.0	25.0	 	 	 	 	50.0	 	 	25.0	b
33	Shuwa Arabs	Cameroon (North)	AA/Semitic	5	40.0	40.0	 	 	 	 	 	 	 	60.0	b
34	Kanuri	Cameroon (North)	NS/Saharan	7	14.3	14.3	 	 	 	 	 	 	 	85.7	b
35	Foulbe from Cameroon	Cameroon (North)	NC/Atlantic	18	11.1	5.6	 	 	 	 	5.6	 	 	88.9	b
36	Moundang	Cameroon (North)	NC/Adamawa	21	66.7	14.3	 	 	 	 	52.4	 	 	33.3	b
37	Fali	Cameroon (North)	NC/Adamawa	48	20.8	10.4	 	 	 	 	10.4	 	 	79.2	b
38	Tali	Cameroon (North)	NC/Adamawa	22	9.1	 	 	4.5	 	 	4.5	 	 	90.9	b
39	Mboum	Cameroon (North)	NC/Adamawa	9	 	 	 	 	 	 	 	 	 	100.0	b
40	Bamileke	Cameroon (South)	NC/Bantu	48	 	 	 	 	 	 	 	 	 	100.0	c
41	Bakaka	Cameroon (South)	NC/Bantu	12	 	 	 	 	 	 	 	 	 	100.0	c
42	Ewondo	Cameroon (South)	NC/Bantu	30	3.3	3.3	 	 	 	 	 	 	 	96.7	b , c
43	Biaka Pygmiesd	CAR	NC/Bantu	33	 	 	 	 	 	 	 	 	 	100.0	b , c
Eastern Africa
44	Mbuti Pygmiesd	DRC	NS/Sudanic	13	 	 	 	 	 	 	 	 	 	100.0	b , c
45	Twa Pygmies	Burundi	NC/Bantu	7	 	 	 	 	 	 	 	 	 	100.0	b
46	Tutsi	Burundi	NC/Bantu	9	 	 	 	 	 	 	 	 	 	100.0	b
47	Hutu	Burundi	NC/Bantu	14	 	 	 	 	 	 	 	 	 	100.0	b
48	Cunama	Eritrea	NS/Cunama	20	 	 	 	 	 	 	 	 	 	100.0	b
49	Nara	Eritrea	NS/Sudanic	15	 	 	 	 	 	 	 	 	 	100.0	b
50	Tigrai	Eritrea	AA/Semitic	28	 	 	 	 	 	 	 	 	 	100.0	b
51	Tigre	Eritrea	AA/Semitic	5	 	 	 	 	 	 	 	 	 	100.0	b
52	Afar Djibuti	Djibuti	AA/Cushitic	25	 	 	 	 	 	 	 	 	 	100.0	b
53	Somali Djibuti	Djibuti	AA/Cushitic	40	 	 	 	 	 	 	 	 	 	100.0	b
54	Somali Somalia	Somalia	AA/Cushitic	23	 	 	 	 	 	 	 	 	 	100.0	b
55	Tigrai	Ethiopia	AA/Semitic	5	 	 	 	 	 	 	 	 	 	100.0	b
56	Amhara	Ethiopia	AA/Semitic	83	 	 	 	 	 	 	 	 	1.2	98.8	b
57	Gurage	Ethiopia	AA/Semitic	7	 	 	 	 	 	 	 	 	 	100.0	b
58	Ethiopian Jews	Ethiopia	AA/Cushitic	22	 	 	 	 	 	 	 	 	 	100.0	c
59	Oromo	Ethiopia	AA/Cushitic	62	 	 	 	 	 	 	 	 	 	100.0	b
60	Wolayta	Ethiopia	AA/Omotic	12	 	 	 	 	 	 	 	 	 	100.0	b
61	Borana	Kenya	AA/Cushitic	8	 	 	 	 	 	 	 	 	 	100.0	b
62	Nilotic	Kenya	NS/Sudanic	18	 	 	 	 	 	 	 	 	 	100.0	b
63	Kikuyu	Kenya	NC/Bantu	8	 	 	 	 	 	 	 	 	 	100.0	b
64	Luhya	Kenya	NC/Bantu	7	 	 	 	 	 	 	 	 	 	100.0	b
65	Other Bantud	Kenya	NC/Bantu	11	 	 	 	 	 	 	 	 	 	100.0	b
Southern Africa
66	Kung	Angola	KS	64	 	 	 	 	 	 	 	 	 	100.0	c
67	Khwe	Namibia	KS	26	 	 	 	 	 	 	 	 	 	100.0	c
68	Sand	Namibia	KS	7	 	 	 	 	 	 	 	 	 	100.0	b
69	Bantud	Southern Africa	NC/Bantu	8	 	 	 	 	 	 	 	 	 	100.0	b
Europe
70	Western Europeansd	Composite sample	—	465	 	 	 	 	 	 	 	 	57.8	42.2	b
71	North western Europeansd	Composite sample	—	43	 	 	 	 	 	 	 	 	55.8	44.2	b
72	Central Europeans	Composite sample	—	77	 	 	 	 	 	 	 	 	42.9	57.1	b
73	Italiansd,e	Italy	IE	1173	0.2	 	 	 	0.1	0.1	 	 	26.4	73.1	b
74	Corsicans	France	IE	141	0.7	 	0.7	 	 	 	 	 	48.2	51.1	b
75	North Eastern Europeans	Composite sample	—	74	 	 	 	 	 	 	 	 	1.4	98.6	b
76	Russiansd	Russia	IE	60	 	 	 	 	 	 	 	 	6.7	93.3	b
77	Eastern Europeans	Composite sample	—	149	 	 	 	 	 	 	 	 	20.8	79.2	b
78	Balkanians	Composite sample	—	510	0.2	0.2	 	 	 	 	 	 	12.9	86.9	b
Asia
79	Western Asiansf	Composite sample	—	328	0.3	0.3	 	 	 	 	 	 	5.5	93.9	b
80	Southern Asiansd	Composite sample	—	288	 	 	 	 	 	 	 	3.1	1.7	95.1	b
81	South eastern Asians	Composite sample	—	10	 	 	 	 	 	 	 	 	 	100.0	b
82	North eastern Asians	Composite sample	—	30	 	 	 	 	 	 	 	 	 	100.0	b
83	Eastern Asiansd,f	Composite sample	—	156	 	 	 	 	 	 	 	 	0.6	98.7	b
aAA, Afroasiatic; NC, Niger-Congo; NS, Nilo-Saharan; KS, Khoisan; IE, Indo-European.
bThis study.
cCruciani et al.18
dSample (or a subset of it) from the Human Genome Diversity Project/CEPH DNA panel.29
eThree R-P25* chromosomes were also observed.
fOne R-P25* chromosome was also observed.
|
|

