|
|
Post by Admin on Jun 15, 2022 22:03:14 GMT
Population continuity and admixture in the Levant To determine the relationship of the Levant_ChL population to other ancient Near Eastern populations, we used f-statistics35 (see Supplementary Note 2 for more details). We first evaluated whether the Levant_ChL population is consistent with descending directly from a population related to the earlier Levant_N. If this was the case, we would expect that the Levant_N population would be consistent with being more closely related to the Levant_ChL population than it is to any other population, and indeed we confirm this by observing positive statistics of the form f4 (Levant_ChL, A; Levant_N, Chimpanzee) for all ancient test populations, A (Fig. 4a). However, Levant_ChL and Levant_N population do not form a clade, as when we compute symmetry statistics of the form f4 (Levant_N, Levant_ChL; A, Chimpanzee), we find that the statistic is often negative, with Near Eastern populations outside the Levant sharing more alleles with Levant_ChL than with Levant_N (Fig. 4b). We conclude that while the Levant_N and Levant_ChL populations are clearly related, the Levant_ChL population cannot be modeled as descending directly from the Levant_N population without additional admixture related to ancient Iranian agriculturalists. Direct evidence that Levant_ChL is admixed comes from the statistic f3 (Levant_ChL; Levant_N, A), which for some populations, A, is significantly negative indicating that allele frequencies in Levant_ChL tend to be intermediate between those in Levant_N and A—a pattern that can only arise if Levant_ChL is the product of admixture between groups related, perhaps distantly, to Levant_N and A35. The most negative f3- and f4-statistics are produced when A is a population from Iran or the Caucasus. This suggests that the Levant_ChL population is descended from a population related to Levant_N, but also harbors ancestry from non-Levantine populations related to those of Iran or the Caucasus that Levant_N does not share (or at least share to the same extent). Fig. 4 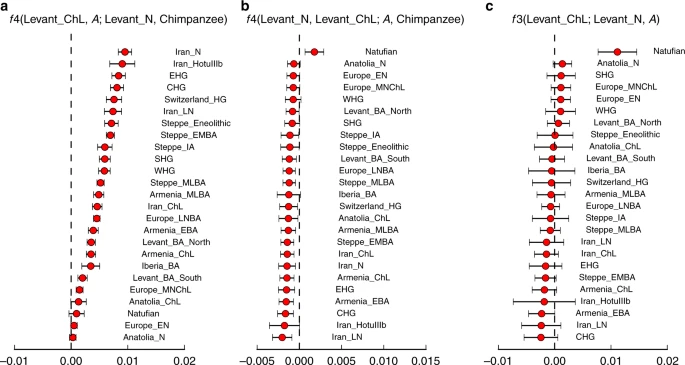 Genetic characteristics of the Levant_ChL. a The statistic f4(Levant_ChL, A; Levant_N, Chimpanzee) demonstrates a close relationship between the Neolithic and Chalcolithic Levant populations, as the Levant Neolithic shares more alleles with the Levant Chalcolithic than with any other populations. b The statistic f4(Levant_N, Levant_ChL; A, Chimpanzee) shows an asymmetrical relationship between Levant_N and Levant_ChL and other ancient West Eurasian populations. The statistic is most negative for populations from Iran and the Caucasus, indicating that Levant_ChL shares more alleles with them than does Levant_N. c The statistic f3(Levant_ChL; Levant_N, A) tests for signals of admixture in Levant_ChL. Negative f3-statistics indicate that the Levant_ChL population is admixed. Populations from Iran and the Caucasus produce the most negative statistics. The estimated statistic ± 3 standard errors is indicated |
|
|
|
Post by Admin on Jun 17, 2022 17:08:12 GMT
The ancestry of the Levant Chalcolithic people
We used qpAdm as our main tool for identifying plausible admixture models for the ancient populations for which we have data (see Supplementary Note 3 for more details)36.
The qpAdm method evaluates whether a tested set of N “Left” populations—including a “target” population (the population whose ancestry is being modeled) and a set of N − 1 additional populations—are consistent with being derived from mixtures in various proportions of N − 1 ancestral populations related differentially to a set of outgroup populations, referred to as “Right” populations. For all our analyses, we use a base set of 11 “Right” outgroups referred to collectively as “09NW”—Ust_Ishim, Kostenki14, MA1, Han, Papuan, Onge, Chukchi, Karitiana, Mbuti, Natufian, and WHG—whose value for disentangling divergent strains of ancestry present in ancient Near Easterners has been documented in Lazaridis et al.24 (for some analyses we supplement this set with additional outgroups). To evaluate whether the “Left” populations are consistent with a hypothesis of being derived from N − 1 sources, qpAdm effectively computes all possible statistics of the form f4(Lefti, Leftj; Rightk, Rightl), for all possible pairs of populations in the proposed “Left” and “Right” sets. It then determines whether all the statistics can be written as a linear combination of f4-statistics corresponding to the differentiation patterns between the proposed N − 1 ancestral populations, appropriately accounting for the covariance of these statistics and computing a single p value for fit based on a Hotelling T-squared distribution36. For models that are consistent with the data (p > 0.05), qpAdm estimates proportions of admixture for the target population from sources related to the N − 1 ancestral populations (with standard errors). Crucially, qpAdm does not require specifying an explicit model for how the “Right” outgroup populations are related.
We first examined all possible “Left” population sets that consisted of Levant_ChL along with one other ancient population from the analysis dataset. Testing a wide range of ancient populations, we found that p values for all possible Left populations were below 0.05 (Supplementary Data 2), showing that Levant_ChL is not consistent with being a clade with any of them relative to the “Right” 09NW outgroups. We then considered models with “Left” population sets containing Levant_ChL along with two additional ancient populations, which corresponds to modeling the Levant_ChL as the result of a two-way admixture between populations related to these two other ancient populations. To reduce the number of hypotheses tested, we restricted the models to pairs of source populations that contain at least one of the six populations that we consider to be the most likely admixture sources based on geographical and temporal proximity: Anatolia_N, Anatolia_ChL, Armenia_ChL, Iran_ChL, Iran_N, and Levant_N. Again, we find no plausible two-way admixture models using a p > 0.05 threshold (Supplementary Figure 2 and Supplementary Data 3). Finally, we tested possible three-way admixture events, restricting to triplets that contain at least two of the six most likely admixture sources. Plausible solutions at p > 0.05 are listed in Table 1 (full results are reported in Supplementary Figure 3 and Supplementary Data 4).
Target A B C Outgroup right pops p Value rank = 2 A B C A B C
Levant_ChL Levant_N Anatolia_N Iran_ChL 09NW 6.82E-02 0.580 0.259 0.161 0.035 0.048 0.030
Levant_ChL Levant_N Anatolia_N Iran_ChL 09NWL 6.69E−02 0.561 0.291 0.148 0.030 0.037 0.027
Levant_ChL Levant_N Anatolia_N Iran_ChL 09NWLY 9.15E−02 0.561 0.301 0.138 0.030 0.032 0.020
Levant_ChL Levant_N Anatolia_N Iran_ChL 09NWSGEITMLY 1.14E−01 0.571 0.264 0.166 0.030 0.028 0.015
Levant_ChL Levant_N Anatolia_N Iran_LN 09NW 1.14E−01 0.562 0.281 0.157 0.035 0.044 0.028
Levant_ChL Levant_N Anatolia_N Iran_LN 09NWL 4.62E−02 0.534 0.335 0.131 0.030 0.032 0.025
Levant_ChL Levant_N Anatolia_N Iran_HotuIIIb 09NW 8.22E−02 0.484 0.217 0.299 0.033 0.043 0.045
Levant_ChL Levant_N Anatolia_N Iran_HotuIIIb 09NWL 6.11E−03 0.476 0.305 0.219 0.036 0.035 0.048
Levant_ChL Levant_N Anatolia_N Iran_N 09NW 1.09E−01 0.579 0.308 0.113 0.035 0.041 0.020
Levant_ChL Levant_N Anatolia_N Iran_N 09NWL 4.74E−02 0.551 0.356 0.094 0.030 0.031 0.018
Levant_ChL Levant_N Anatolia_N Levant_BA_North 09NW 2.16E−01 0.494 0.233 0.273 0.035 0.047 0.046
Levant_ChL Levant_N Anatolia_N Levant_BA_North 09NWL 1.13E−01 0.478 0.286 0.236 0.034 0.036 0.478
Levant_ChL Levant_N Anatolia_N Levant_BA_North 09NWLY 3.36E−02 0.481 0.254 0.265 0.034 0.034 0.040
Levant_ChL Levant_N Europe_EN Iran_ChL 09NW 6.80E−02 0.633 0.172 0.195 0.029 0.033 0.027
Levant_ChL Levant_N Europe_EN Iran_ChL 09NWL 6.38E−03 0.613 0.207 0.180 0.028 0.030 0.027
Levant_ChL Levant_N Europe_EN Iran_N 09NW 6.89E−02 0.647 0.213 0.140 0.029 0.031 0.020
Levant_ChL Levant_N Europe_EN Iran_N 09NWL 1.88E−03 0.628 0.262 0.109 0.029 0.027 0.200
Note: Populations that produce p values greater than 0.05 with plausible admixture proportions (0–1) are highlighted in italics. The model with the lowest standard errors is indicated in bold
|
|
|
|
Post by Admin on Jun 18, 2022 18:09:42 GMT
We found multiple candidates for three-way admixture models, always including (1) Levant_N (2) either Anatolia_N or Europe_EN and (3) either Iran_ChL, Iran_N, Iran_LN, Iran_HotuIIIb or Levant_BA_North. These are all very similar models, as Europe_EN (early European agriculturalists) are known to be genetically primarily derived from Anatolian agriculturalists (Anatolia_N)31, and Levant_BA_North has ancestry related to Levant_N and Iran_ChL26. To distinguish between models involving Anatolian Neolithic (Anatolia_N) and European Early Neolithic (Europe_EN), we repeated the analysis including additional outgroup populations in the “Right” set that are sensitive to the European hunter-gatherer-related admixture present to a greater extent in Europe_EN than in Anatolia_N (Supplementary Figure 4a)31 (thus, we added Switzerland_HG, SHG, EHG, Iberia_BA, Steppe_Eneolithic, Europe_MNChL, Europe_LNBA to the “Right” outgroups; abbreviations in Supplementary Table 2). We found that only models involving Levant_N, Anatolia_N, and either Iran_ChL or Levant_BA_North passed at p > 0.05 (Table 1). To distinguish between Iran_ChL and Levant_BA_North, we added Iran_N to the outgroup set (for a total of 19 = 11 + 8 outgroups) (Supplementary Figure 4b). Only the model involving Iran_ChL remained plausible. Based on this uniquely fitting qpAdm model we infer the ancestry of Levant_ChL to be the result of a three-way admixture of populations related to Levant_N (57%), Iran_ChL (17%), and Anatolia_N (26%).
The ancestry of late Levantine Bronze Age populations
It was striking to us that previously published Bronze Age Levantine samples from the sites of 'Ain Ghazal in present-day Jordan (Levant_BA_South) and Sidon in present-day Lebanon (Levant_BA_North) can be modeled as two-way admixtures, without the Anatolia_N contribution that is required to model the Levant_ChL population24,26. This suggests that the Levant_ChL population may not be directly ancestral to these later Bronze Age Levantine populations, because if it were, we would also expect to detect an Anatolia_N component of ancestry. In what follows, we treat Levant_BA_South and Levant_BA_North as separate populations for analysis, since the symmetry statistic f4(Levant_BA_North, Levant_BA_South; A, Chimp) is significant for a number test populations A (|Z| ≥ 3) (Supplementary Data 5), consistent with the different estimated proportions of Levant_N and Iran_ChL ancestry reported in24,26.
To test the hypothesis that Levant_ChL may be directly ancestral to the Bronze Age Levantine populations, we attempted to model both Levant_BA_South and Levant_BA_North as two-way admixtures between Levant_ChL and every other ancient population in our dataset, using the base 09NW set of populations as the “Right” outgroups. We also compared these models to the previously published models that used the Levant_N and Iran_ChL populations as sources (Table 2; Supplementary Figure 5; Supplementary Data 6). In the case of Levant_BA_South from 'Ain Ghazal, Jordan, multiple models were plausible, and thus we returned to the strategy of adding additional “Right” population outgroups that are differentially related to one or more of the “Left” populations (specifically, we added various combinations of Armenia_EBA, Steppe_EMBA, Switzerland_HG, Iran_LN, and Iran_N). Only the model including Levant_N and Iran_ChL remains plausible under all conditions. Thus, we can conclude that groups related to Levant_ChL contributed little ancestry to Levant_BA_South.
Table 2 Modeling Levant_BA_South and Levant_BA_North as a mixture of Levant_ChL and an ancient population, A
Target A B Outgroup right pops p Value rank = 2 A B Standard error
Levant_BA_South Levant_N Iran_ChL 09NW 9.88E−01 0.549 0.451 0.031
Levant_BA_South Levant_N Iran_ChL 09NWFPY 5.14E−01 0.571 0.429 0.026
Levant_BA_South Levant_N Iran_ChL 09NWFPSD 1.95E−01 0.582 0.418 0.025
Levant_BA_South Levant_N Iran_ChL 09NWA 9.94E−01 0.55 0.45 0.027
Levant_BA_South Levant_N Iran_ChL 09NWAZ 1.39E−02 0.601 0.399 0.026
Levant_BA_South Levant_ChL CHG 09NW 5.97E−02 0.788 0.212 0.032
Levant_BA_South Levant_ChL CHG 09NWFPY 1.82E−03 0.812 0.188 0.024
Levant_BA_South Levant_ChL Iran_ChL 09NW 2.00E−01 0.714 0.286 0.04
Levant_BA_South Levant_ChL Iran_ChL 09NWFPY 3.06E−02 0.723 0.277 0.033
Levant_BA_South Levant_ChL Iran_LN 09NW 3.53E−01 0.717 0.283 0.039
Levant_BA_South Levant_ChL Iran_LN 09NWFPY 1.22E−02 0.779 0.221 0.026
Levant_BA_South Levant_ChL Iran_HotuIIIb 09NW 2.43E−01 0.556 0.444 0.051
Levant_BA_South Levant_ChL Iran_HotuIIIb 09NWFPSD 3.79E−02 0.585 0.415 0.047
Levant_BA_South Levant_ChL Iran_N 09NW 4.41E−01 0.797 0.203 0.028
Levant_BA_South Levant_ChL Iran_N 09NWFPSD 8.00E−04 0.853 0.147 0.075
Levant_BA_North Levant_N Iran_ChL 09NW 0.003804 0.348 0.652 0.028
Levant_BA_North Levant_N Iran_ChL Haber 0.222705 0.518 0.482 0.04
Levant_BA_North Levant_N Iran_ChL Haber + A 0.002457 0.394 0.606 0.025
Levant_BA_North Levant_ChL Iran_LN 09NW 0.267145 0.532 0.468 0.031
Levant_BA_North Levant_ChL Iran_LN Haber 0.398822 0.555 0.445 0.04
Levant_BA_North Levant_ChL Iran_LN Haber + A 0.455948 0.535 0.465 0.019
Levant_BA_North Levant_ChL Iran_N 09NW 0.401157 0.63 0.37 0.024
Levant_BA_North Levant_ChL Iran_N Haber 0.638884 0.655 0.345 0.035
Levant_BA_North Levant_ChL Iran_N Haber + A 0.693801 0.638 0.362 0.015
Levant_BA_North Levant_ChL Iran_HotuIIIb 09NW 0.216066 0.377 0.623 0.033
Levant_BA_North Levant_ChL Iran_HotuIIIb Haber 0.03318 0.299 0.701 0.047
Levant_BA_North Levant_ChL Iran_HotuIIIb Haber + A 0.007102 0.399 0.601 0.019
Note: Populations that produce p values greater than 0.05 with plausible admixture proportions (between 0 and 1) are highlighted in italic. Models that are robust to the maximum number of outgroups are shown in bold
|
|
|
|
Post by Admin on Jun 18, 2022 20:48:54 GMT
We observe a qualitatively different pattern in the Levant_BA_North samples from Sidon, Lebanon, where models including Levant_ChL paired with either Iran_N, Iran_LN, or Iran_HotuIIIb populations appear to be a significantly better fit than those including Levant_N + Iran_ChL. We largely confirm this result using the “Right” population outgroups defined in Haber et al.26 (abb. Haber: Ust_Ishim, Kostenki14, MA1, Han, Papuan, Ami, Chuckhi, Karitiana, Mbuti, Switzerland_HG, EHG, WHG, and CHG), although we find that the specific model involving Iran_HotuIIIb no longer works with this “Right” set of populations. Investigating this further, we find that the addition of Anatolia_N in the “Right” outgroup set excludes the model of Levant_N + Iran_ChL favored by Haber et al.26. These results imply that a population that harbored ancestry more closely related to Levant_ChL than to Levant_N contributed to the Levant_BA_North population, even if it did not contribute detectably to the Levant_BA_South population.
We obtained additional insight by running qpAdm with Levant_BA_South as a target of two-way admixture between Levant_N and Iran_ChL, but now adding Levant_ChL and Anatolia_N to the basic 09NW “Right” set of 11 outgroups. The addition of the Levant_ChL causes the model to fail, indicating that Levant_BA_South and Levant_ChL share ancestry following the separation of both of them from the ancestors of Levant_N and Iran_ChL. Thus, in the past there existed an unsampled population that contributed both to Levant_ChL and to Levant_BA_South, even though Levant_ChL cannot be the direct ancestor of Levant_BA_South because, as described above, it harbors Anatolia_N-related ancestry not present in Levant_BA_South.
Genetic heterogeneity in the Levantine Bronze Age
We were concerned that our finding that the Levant_ChL population was a mixture of at least three groups might be an artifact of not having access to samples closely related to the true ancestral populations. One specific possibility we considered is that a single ancestral population admixed into the Levant to contribute to both the Levant_ChL and the Levant_BA_South populations, and that this was an unsampled population on an admixture cline between Anatolia_N and Iran_ChL, explaining why qpAdm requires three source populations to model it. To formally test this hypothesis, we used qpWave36,37,38, which determines the minimum number of source populations required to model the relationship between “Left” populations relative to “Right” outgroup populations. Unlike qpAdm, qpWave does not require that populations closely related to the true source populations are available for analysis. Instead it treats all “Left” populations equally, and attempts to determine the minimum number of theoretical source populations required to model the “Left” population set, relative to the “Right” population outgroups. Therefore, we model the relationship between Levant_N, Levant_ChL, and Levant_BA_South as “Left” populations, relative to the 09NW “Right” outgroup populations (Table 3). We find that a minimum of three source populations continues to be required to model the ancestry of these Levantine populations, supporting a model in which at least three separate sources of ancestry are present in the Levant between the Neolithic, Chalcolithic, and Bronze Age.
Table 3 Determining the number of streams of ancestry in the Levant
Left pops Right pops Rank Degrees of freedom Chi squared p Value
Levant_N 0 20 190.024 1.047e−29
Levant_ChL 09NW 1 9 32.641 1.541e−4
Levant_BA_South 2 0 0.000 1.000
Levant_N 0 20 399.438 2.673e−72
Levant_BA_South 09NW 1 9 6.574 0.681
Levant_BA_North 2 0 0.000 1.000
Levant_N 0 20 706.552 3.221e−135
Levant_BA_South 09NWZ 1 9 28.050 1.772e−3
Levant_BA_North 2 0 0.000 1.000
Note: Models that have a rank that is plausible (i.e., p value of greater than 0.05) are shown in bold. Rank is equal to the minimum number of source populations required to model the “Left” population group relative to the “Right” population group, minus 1 (thus, Rank 2, which is the only working solution for all sets of three “Left” populations, reflects three admixing populations)
We applied qpWave again, replacing Levant_ChL with Levant_BA_North, and found that the minimum number of source populations is only two. However, when we include the Levant_ChL population as an additional outgroup, three source populations are again required. This suggests that in the absence of the data from Levant_ChL there is insufficient statistical leverage to detect Anatolian-related ancestry that is truly present in admixed form in the Levant_BA_North population (data from the Levant_ChL population makes it possible to detect this ancestry). This may explain why Haber et al.26 did not detect the Anatolian Neolithic-related admixture in Levant_BA_North.
|
|
|
|
Post by Admin on Jun 19, 2022 18:50:37 GMT
Biologically important mutations in the Peqi’in population
This study nearly doubles the number of individuals with genome-wide data from the ancient Levant. Measured in terms of the average coverage at SNPs, the increase is even more pronounced due to the higher quality of the data reported here than in previous studies of ancient Near Easterners24,26. Thus, the present study substantially increases the power to analyze the change in frequencies of alleles known to be biologically important.
We leveraged our data to examine the change in frequency of SNP alleles known to be related to metabolism, pigmentation, disease susceptibility, immunity, and inflammation in the Levant_ChL population, considered in relation to allele frequencies in the Levant_N, Levant_BA_North, Levant_BA_South, Anatolia_N and Iran_ChL populations and present-day pools of African (AFR), East Asian (EAS), and European (EUR) ancestry in the 1000 Genomes Project Phase 3 dataset39 (Supplementary Data 7).
We highlight three findings of interest. First, an allele (G) at rs12913832 near the OCA2 gene, with a proven association to blue eye color in individuals of European descent40, has an estimated alternative allele frequency of 49% in the Levant_ChL population, suggesting that the blue-eyed phenotype was common in the Levant_ChL.
Second, an allele at rs1426654 in the SLC24A5 gene which is one of the most important determinants of light pigmentation in West Eurasians41 is fixed for the derived allele (A) in the Levant_ChL population suggesting that a light skinned phenotype may have been common in this population, although any inferences about skin pigmentation based on allele frequencies observed at a single site need to be viewed with caution42.
Third, an allele (G) at rs6903823 in the ZKSCAN3 and ZSCAN31 genes which is absent in all early agriculturalists reported to date (Levant_N, Anatolia_N, Iran_N) and that has been argued to have been under positive selection by Mathieson et al.31, occurs with an estimated frequency of 20% in the Levant_ChL, 17% in the Levant_BA_South, and 15% in the Iran_ChL populations, while it is absent in all other populations. This suggests that the allele was rising in frequency in Chalcolithic and Bronze Age Near Eastern populations at the same time as it was rising in frequency in Europe.
|
|

