|
|
Post by Admin on Oct 2, 2018 18:14:36 GMT
 We sequenced a total of 62 African complete mtDNA genomes for this study that have been assigned GenBank accession numbers EF184580–EF184641. These mtDNA genomes were from individuals belonging to several ethnic groups in Tanzania (n = 49), click-speaking !Xun and Khwe populations from South Africa (n = 10), and Bakola Pygmies from Cameroon (n = 4). These samples were selected in order to fully represent L0a, L0d, L0f, L0k, L1c, L5, L2, L3, M, and N haplogroup lineages (table S2, Supplementary Material online). These newly sequenced African mtDNA genomes were aligned and compared with a global assortment of 254 mtDNA genomes of peoples of diverse geographic origin. Table S3 (Supplementary Material online) lists the GenBank accession number, sampling provenance, and major geographic region for these 254 mtDNAs. Diversity statistics are given in table 1. The genetic diversity present in this sample was broadly consistent with previous studies (Ingman et al. 2000; Ruiz-Pesini et al. 2004). The amount of mtDNA sequence diversity (π) among Africans (3.92 × 10⁻³) and Tanzanians (3.80 × 10⁻³) was more than twice that among non-Africans (1.81 × 10⁻³). However, the level of variation in Africa may be artificially elevated to some extent by the selection of genomes for sequencing that would maximize haplogroup representation. Table 1. Summary Statistics and Neutrality Tests of mtDNA Genomes (excluding the d-loop) na Sb π × 10−3c kd Tajima's D D* of Fu and Li F* of Fu and Li Global 320 1,545 2.69 41.4 −2.60* −7.74** −5.82** African 94 758 3.92 60.3 −2.05* −3.97** −3.75** Non-African 226 1,086 1.81 27.9 −2.71*** −7.81** −6.15** Tanzanian 49 483 3.80 58.5 −1.70 −2.55* −2.66* We detected significant departures from neutrality expectations (table 1), as measured by Tajima's D, in the global data set and the pooled African and non-African data sets, but not in Tanzanians. D* and F* statistics of Fu and Li revealed significant departures from neutrality in all populations. We also tested all mtDNAs belonging to subsets of haplogroups L0 and L1 for deviations from neutrality expectations (results not shown). None of these subsets significantly deviated from neutrality expectations, except for mtDNAs belonging to L5 (Tajima's D = −1.29, P < 0.001; D* of Fu and Li = −1.26, P < 0.05; F* of Fu and Li = −1.37, P < 0.05). Other studies of whole-mtDNA genome diversity in Africa did not report significant deviations from neutrality expectations (Ingman et al. 2000; Mishmar et al. 2003; Ruiz-Pesini et al. 2004), with the exceptions of Torroni et al. (2001) and Kivisild, Shen, et al. (2006). We speculate that these departures from neutrality expectations may be attributed to several potential factors including our larger sample of African mtDNAs compared with previous studies, artifacts of sampling from structured populations (resulting in an excess of rare variants) (Ptak and Przeworski 2002; Hammer et al. 2004; Kivisild, Shen, et al. 2006), population expansion events, and/or an ancient selective sweep in African mtDNAs (Simonsen et al. 1995). Due to the high frequency of homoplasy in the mtDNA d-loop, we compared the topology of an NJ tree reconstructed from the complete mtDNA sequences of the 322 samples (fig. S1, Supplementary Material online) with a tree reconstructed using the mtDNA sequences excluding the d-loop (fig. 2). The topologies of the 2 trees were similar, but the basal branches of the complete mtDNA sequences had lower bootstrap values. In contrast, the NJ tree of the mtDNA genomes that excluded the d-loop had higher statistical support for the basal branches separating the haplogroups (L0, L1, L5, L2, L3, M, and N), with bootstrap values ranging from 61% to 91%. |
|
|
|
Post by Admin on Oct 3, 2018 18:14:56 GMT
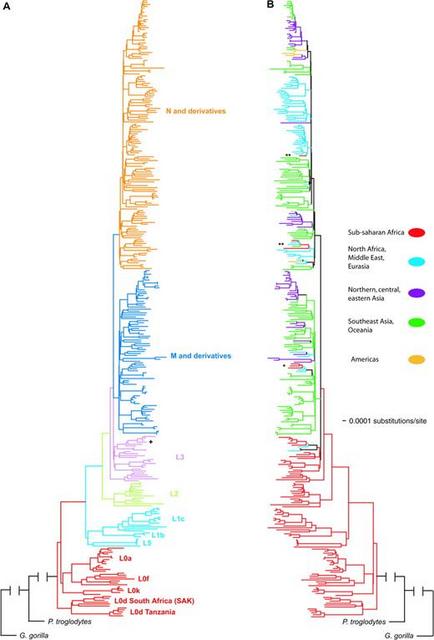 FIG. 2.— NJ trees based on mtDNA genomes (excluding the d-loop). (A) Samples are colored according to their haplogroup membership. (B) Samples are colored according to their geographic origin (sub-Saharan Africa, North Africa/Middle East/Eurasia, Asia [northern, central, and eastern], Southeast Asia/Oceania, and Americas). Samples from AF381984 (Morroco) and AF381996 (Jordan) that belong to African L3 haplogroups indicated by “+.” Samples of Tanzanians belonging to haplogroup M are indicated by “*.” Samples of Tanzanians belonging to haplogroup N are indicated by “**.” There are several notable characteristics of the NJ tree shown in figure 2. First, the L0/L5/L1/L2/L3 haplogroups are African specific, as previously reported (Ingman et al. 2000; Mishmar et al. 2003; Ruiz-Pesini et al. 2004; Kivisild, Shen, et al. 2006). Haplogroup L0 forms the basal lineage of the human mtDNA gene tree followed by L1, L5, L2, L3, M, N, and the derivatives of haplogroups M and N. Unlike previous studies that report L0k as the most basal haplogroup of the human mtDNA gene tree (Ingman et al. 2000; Mishmar et al. 2003; Ruiz-Pesini et al. 2004), our data suggest that L0d forms the basal lineage of the human mtDNA gene tree (which has also been observed in a recent study of African mtDNA genome diversity [Kivisild, Shen, et al. 2006]). L0d is further subdivided into 2 reciprocally monophyletic clades: one clade composed of SAK and one clade composed of Tanzanians (all of whom are Sandawe, except for one neighboring Burunge). Further, our analysis shows that L0k forms a clade with L0f and L0a, suggesting independent origins of L0d and L0k lineages. L1b, L1c, and L5 form a monophyletic clade, as do all L2 mtDNAs and all L3 lineages. These L3 mtDNA sequences all belong to Africans, with the exception of 2 mtDNA genomes sampled from the Middle East, suggesting some recent migration from Africa to the Middle East. mtDNAs belonging to haplogroups M and N form 2 monophyletic clades (fig. 2A). These 2 M and N haplogroup clades included a few Tanzanians (belonging to haplogroups M1, M, N1, and J), suggesting possible recent gene flow back into Africa and/or that ancestors of the Tanzanian populations may have been a source of migration of modern humans from Africa to other regions (fig. 2B). In order to better resolve the evolutionary history of the most ancient mtDNA haplogroup lineages using Bayesian maximum likelihood analyses, we next analyzed a smaller data set composed of all mtDNA genomes of people from sub-Saharan Africa and a subset of the samples obtained from GenBank. The subset of samples included a global panel representing all of the major non-African haplogroup lineages. The Bayesian tree is shown in figure 3. The overall tree topologies of the Bayesian tree and NJ tree were similar. Clade credibility scores, which are a measure of the posterior probability of the tree branching structure, ranged from 73% to 100%. MtDNAs of Africans belonging to haplogroups L0 and L1 form the most basal lineages of the human mtDNA gene tree. Within L0, L0d forms the most basal branch of the tree and also contains 2 reciprocally monophyletic clades composed of Tanzanians and SAK, respectively. L0k forms a clade with L0f and L0a, providing additional support of independent origins of the Khoisan-specific L0d and L0k haplogroup lineages. L1b and L1c form a clade that does not include L5. In contrast to the NJ trees (fig. 2 and fig. S1, Supplementary Material online), L5 occupies an intermediate phylogenetic position between L1 and L2, as has been previously reported (Shen et al. 2004). 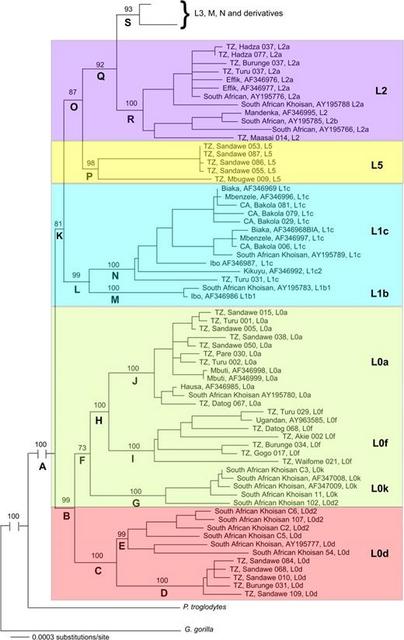 FIG. 3.— Phylogenetic tree of mtDNA genomes (excluding the d-loop) obtained by maximum likelihood Bayesian analysis. Using a log likelihood test (Huelsenbeck and Crandall 1997), we found significant substitution rate heterogeneity in our phylogenetic analyses for the complete sample of mtDNA genomes (n = 320; −2lnΛ = 750.9, χ2 df = 318, P < 0.05, 100 permutations) and for the smaller data set (n = 114; −2lnΛ = 349.5, χ2 df = 112, P < 0.05, 100 permutations). Simulations have shown that it is difficult to root a phylogeny precisely when the outgroup is very distant relative to the ingroup, as is the case in the present study (Penny et al. 1995; Sanderson and Shaffer 2002). This difficulty could potentially explain the substitution rate heterogeneity observed in our data set. Reanalysis of the data set using a conservative midpoint root verified that the substitution rates in our data were heterogeneous for the complete set of mtDNA genomes (n = 319; −2lnΛ = 433.94, χ2 df = 317, P < 0.05, 100 permutations) and for the smaller data set (n = 113; −2lnΛ = 150.41, χ2 df = 111, P < 0.05, 100 permutations). Subsequent to our discovery that these data do not follow a clock-like model, we applied a PL algorithm to account for substitution rate heterogeneity among the mtDNA haplogroup clades to calculate TMRCAs for various nodes in the gene tree shown in figure 3. Table 2 lists these TMRCA dates and their 95% CIs. Our TMRCA estimate for the global mtDNA genome tree is 194.3 ± 32.55 kya, which is very close to the age of the earliest modern humans estimated from fossil data (McDougall et al. 2005) as well as some early studies of mtDNA diversity (e.g., Vigilant et al. 1991; Horai et al. 1995 [when corrected for a Pan/Homo split 6.5 MYA]). We also observe an origin of L0 (146.4 ± 25.1 kya) and L1 (140.4 ± 33 kya), slightly more recent than the appearance of modern humans based on the paleontological record (Clark et al. 2003; White et al. 2003; McDougall et al. 2005). The L0d mtDNAs have a TMRCA of 106 ± 20.2 kya. The TMRCA of mtDNAs of the SAK belonging to L0d is 90.4 ± 18.9 kya, whereas the TMRCA of L0d mtDNAs belonging to Tanzanians is more recent (30.6 ± 17.8 kya). The TMRCA of L0k, L0f, and L0a is 139.8 ± 24.6 kya. The TMRCA of the SAK L0k is 70.9 ± 19.7 kya. The TMRCA of L0f, which is observed only in eastern Africa, indicates that it is a relatively old lineage (94.9 ± 9.4 kya). The TMRCA of L0a (54.6 ± 5.7 kya) is more recent than the TMRCA of L0f, even though these mtDNA samples originate from diverse regions in Africa. We attribute the relatively old TMRCA (and highly negative Tajima's D) of L5 (129.4 ± 22.1 kya) to the divergent sequence of the L5 mtDNA from a single Tanzanian Mbugwe individual compared with the three L5 mtDNAs from the Tanzanian Sandawe that differed from each other by very few basepairs. The TMRCAs of L2 and L3 are more recent (96.7 ± 10.7 kya) compared with those of L0, L1, and L5. The age of the youngest node containing both African and non-African sequences (node S) is 94.3 ± 9.9 kya and represents an upper bound time estimate for an exodus out of Africa. |
|
|
|
Post by Admin on Oct 4, 2018 18:17:53 GMT
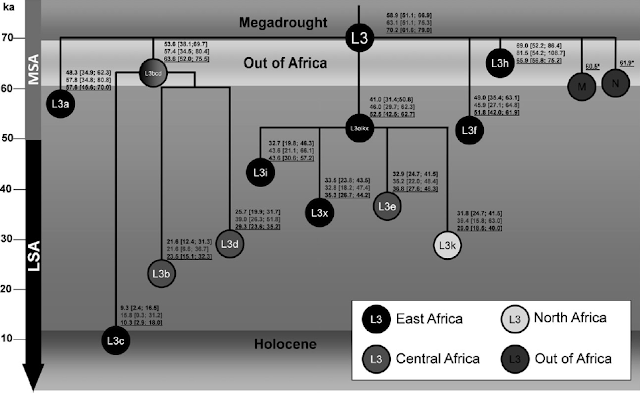
Subsequent to our discovery that these data do not follow a clock-like model, we applied a PL algorithm to account for substitution rate heterogeneity among the mtDNA haplogroup clades to calculate TMRCAs for various nodes in the gene tree shown in figure 3. Table 2 lists these TMRCA dates and their 95% CIs. Our TMRCA estimate for the global mtDNA genome tree is 194.3 ± 32.55 kya, which is very close to the age of the earliest modern humans estimated from fossil data (McDougall et al. 2005) as well as some early studies of mtDNA diversity (e.g., Vigilant et al. 1991; Horai et al. 1995 [when corrected for a Pan/Homo split 6.5 MYA]). We also observe an origin of L0 (146.4 ± 25.1 kya) and L1 (140.4 ± 33 kya), slightly more recent than the appearance of modern humans based on the paleontological record (Clark et al. 2003; White et al. 2003; McDougall et al. 2005). The L0d mtDNAs have a TMRCA of 106 ± 20.2 kya. The TMRCA of mtDNAs of the SAK belonging to L0d is 90.4 ± 18.9 kya, whereas the TMRCA of L0d mtDNAs belonging to Tanzanians is more recent (30.6 ± 17.8 kya). The TMRCA of L0k, L0f, and L0a is 139.8 ± 24.6 kya. The TMRCA of the SAK L0k is 70.9 ± 19.7 kya. The TMRCA of L0f, which is observed only in eastern Africa, indicates that it is a relatively old lineage (94.9 ± 9.4 kya). The TMRCA of L0a (54.6 ± 5.7 kya) is more recent than the TMRCA of L0f, even though these mtDNA samples originate from diverse regions in Africa. We attribute the relatively old TMRCA (and highly negative Tajima's D) of L5 (129.4 ± 22.1 kya) to the divergent sequence of the L5 mtDNA from a single Tanzanian Mbugwe individual compared with the three L5 mtDNAs from the Tanzanian Sandawe that differed from each other by very few basepairs. The TMRCAs of L2 and L3 are more recent (96.7 ± 10.7 kya) compared with those of L0, L1, and L5. The age of the youngest node containing both African and non-African sequences (node S) is 94.3 ± 9.9 kya and represents an upper bound time estimate for an exodus out of Africa. Table 2. TMRCA Dates Inferred from Tree Nodes Shown in Figure 3 Node Lineage MRCA ± CI × 103 years Pan/Homo 6,500.0a A Homo sapiens sapiens 194.3 ± 32.5 B L0 146.4 ± 25.1 C L0d 106 ± 20.2 D Tanzanian L0d 30.6 ± 17.8 E San L0d 90.4 ± 18.9 F L0k, L0f, L0a 139.8 ± 24.6 G L0k 70.9 ± 19.7 H L0f, L0a 100.1 ± 12.5 I L0f 94.9 ± 9.4 J L0a 54.6 ± 5.7 K L1, L2, L3, M, N 142.3 ± 38.2 L L1b, L1c 140.4 ± 32.9 M L1b 15 ± 26.7 N L1c 95.6 ± 23.9 O L5, L2, L3, M, N 131.2 ± 15.9 P L5 129.4 ± 22.1 Q L2, L3, M, N 96.7 ± 10.7 R L2 94.5 ± 4.5 S L3, M, N, and derivatives 94.3 ± 9.9 a We assumed a Pan/Homo divergence of 6.5 Myr. Phylogenetic analyses of mtDNA that assume a strict bifurcating tree topology may not be well suited to the study of human mtDNA (Bandelt et al. 1999). Confounding phenomena, such as homoplasy and multifurcations (“star” phylogenies), have commonly been observed in studies of human mtDNA gene genealogies (Posada and Crandall 2001). Therefore, we complemented our phylogenetic analyses by also constructing mtDNA gene genealogies (fig. S2, Supplementary Material online) using a MJ network approach. Generally, the results of our network analysis were consistent with haplogroup designations based on d-loop sequences and SNP analysis reported in other studies (Salas et al. 2002, 2004; Kivisild et al. 2004). Using the network analysis, we investigated the substitutions in the mtDNA coding region that occur along main branches of the network (fig. 4). Additional substitutions that occur along the terminal branches of the network are given in figures S3 and S4 (Supplementary Material online). The main branches of the L0/L1 network are well supported by several substitutions across the mtDNA genome. Note that L0d, L0f, L0k, and L1c haplogroups contain highly divergent lineages that are separated by several substitutions. In contrast, the L0a haplogroup was characterized by several short branches, despite the fact that these mtDNAs come from a wide variety of African populations. We speculate that the wide geographic distribution and short branches of L0a result from recent population growth and/or a recent expansion of L0a and could perhaps reflect the expansion of Bantu-speaking peoples into eastern Africa within the past few thousand years (Salas et al. 2002). 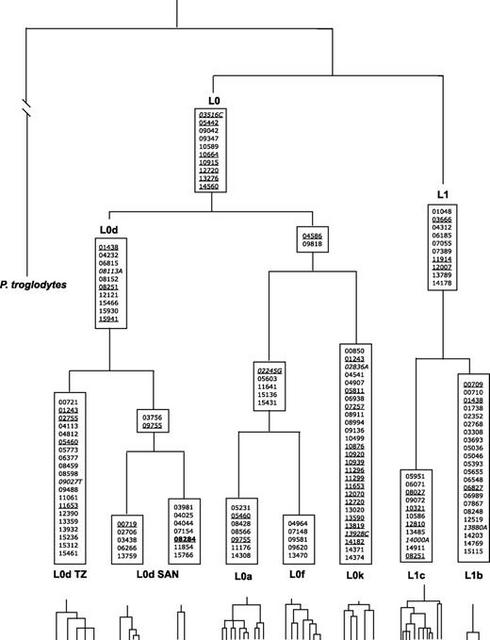 FIG. 4.— Phylogenetic relationships of haplogroups L0 and L1 mtDNA genomes (excluding the d-loop) inferred from a reduced median network analysis using Network4.111. Pan troglodytes was included as an outgroup to root the network. Nucleotide substitutions supporting each branch are shown along the phylogeny. Recurrent mutations are underlined. Transversions are shown in italic, with the nucleotide change indicated. Indels are indicated with boldface font. Additional information about substitutions that define the terminal nodes are given in figures S2–S4 (Supplementary Material online). Numbers refer to their position relative in the Cambridge Reference Sequence (Andrews et al. 1999). |
|
|
|
Post by Admin on Oct 5, 2018 18:20:57 GMT
Discussion
Most analyses of the phylogenetic relationships among African mtDNA haplogroup lineages have been confined to the d-loop and/or RFLP haplotyping of the whole-mtDNA genome. Phylogenies and TMRCA estimates based on the d-loop and RFLPs may be problematic because of homoplasy and heterogeneous mutation rates (Maddison et al. 1992; Excoffier and Yang 1999; Meyer et al. 1999; Ballard and Whitlock 2004). Although previous studies of whole-mtDNA genome diversity have included over 100 mtDNA genomes of Africans (Ruiz-Pesini et al. 2004; Kivisild, Shen, et al. 2006), these studies have not included large numbers of samples from eastern African populations. However, eastern African populations contain rare mtDNA haplogroups that may contain important clues in understanding modern human origins. Our analysis of mtDNA genomes provides relatively robust phylogenies and TMRCA estimates for these mtDNA haplogroup lineages. Moreover, the results of our study suggest several notable observations about the role of Tanzanians in the dispersion of modern humans and the history of African mtDNA haplogroups.
Tanzania is the only region of Africa where populations speak languages classified as belonging to the 4 major language families present in Africa: Afro-Asiatic, Nilo-Saharan, Niger-Kordofanian, and Khoisan (Greenberg 1963). The Hadza and Sandawe, who speak a click language classified as Khoisan, are thought to be indigenous to Tanzania. However, populations speaking languages belonging to the other 3 language families are thought to have migrated into Tanzania from the Sudan (Nilotic Nilo-Saharan speakers), Ethiopia (Cushitic Afro-Asiatic speakers), and West Africa (Bantu Niger-Kordofanian speakers) within the past 5,000 years (Ambrose 1982; Newman 1995). Given the considerable ethnic and linguistic diversity present in Tanzania, it is not surprising that Tanzanians possess high mtDNA genetic diversity, comparable to the level of genetic diversity observed across continental sub-Saharan Africa. This genetic diversity is distributed among several mtDNA haplogroups that originated at different times in modern human history. The presence of very old mtDNA haplogroups (i.e., L0d, L0f, and L5) in Tanzanians that are rare or absent in other regions of Africa suggests populations in Tanzania may have had a large long-term effective population size and/or a large degree of long-term population structure, which has acted to preserve many divergent and rare mtDNA haplogroup lineages that appeared early in modern human history. The presence of these ancient lineages in Tanzania also suggests that eastern Africa might be the source of origin of many other African mtDNA haplogroup lineages. Our findings are consistent with other studies of mtDNA genetic diversity in African populations that have suggested populations in eastern Africa form a highly diverse gene pool (Watson et al. 1997; Chen et al. 2000; Watson and Penny 2003; Kivisild et al. 2004). In addition, the TMRCA of mtDNA haplogroup lineages L3, M, and N and their derivatives (94.3 ± 9.9 kya) is approximately half of the TMRCA of all modern humans (194.3 ± 32.55 kya), which supports models predicting that there was a significant period of time in which modern humans lived exclusively in Africa prior to the exodus of modern humans to other regions of the world (Penny et al. 1995). These observations are consistent with paleobiological and archeological data suggesting that eastern Africa may have been an ancient source of dispersion both within and outside of Africa. The earliest remains of transitional modern humans, dated as early as 196 kya, have been found in Ethiopia (Clark et al. 2003; White et al. 2003; McDougall et al. 2005). The earliest artifacts associated with modern humans are also found in eastern Africa (Foley 1998). Later, Stone Age technology was established in several regions well before 40 kya in eastern Africa but not until 22 kya in southern Africa (Lahr and Foley 1994; Lahr 1996; Foley 1998).
Further, the reciprocally monophyletic phylogenetic relationship of L0d lineages in the Sandawe and the SAK at the root of the human mtDNA gene tree, indicates an ancient, but unique, genetic connection between these populations (Tishkoff SA and Mountain JL, unpublished data). The oldest L0d lineages are observed in the SAK, but it is possible that the ancestral Khoisan population(s) originated in east Africa and subsequently migrated into southern Africa, and that ancient lineages have been lost in the Tanzanian Hadza and Sandawe populations due to genetic drift (Tishkoff SA and Mountain JL, unpublished data). These observations are consistent with both linguistic data indicating similarities between the Sandawe and SAK languages (Ruhlen 1991; Ehret 2000; Traunmuller 2003) as well as shared subsistence patterns (until recently, the Sandawe maintained a hunter–gatherer lifestyle). Our findings are also consistent with patterns of variation in the Y chromosome suggesting an ancient genetic connection between SAK and several East African populations (Cruciani et al. 2002; Semino et al. 2002). Additional data from other loci and additional populations from Tanzania will help resolve whether the connection between Khoisan speakers in eastern and southern Africa is due to divergence from a common ancestor, or to ancient gene flow, and whether or not the ancestors of the Khoisan-speaking populations originated in eastern or southern Africa (Tishkoff SA and Mountain JL, unpublished data).
Finally, our limited genetic data from Tanzanians belonging to haplogroups M1, N1, and J suggest 2 alternatives that are not mutually exclusive. Populations in Tanzania may have been important in the migration of modern humans from Africa to other regions, as noted in previous studies of other populations in eastern Africa (Quintana-Murci et al. 1999). For example, mtDNAs of Tanzanians belonging to haplogroup M1 cluster with peoples from Oceania, whereas Tanzanian mtDNAs belonging to haplogroup N1 and J cluster with peoples of Middle Eastern and Eurasian origin. However, the presence of haplogroups N1 and J in Tanzania suggest “back” migration from the Middle East or Eurasia into eastern Africa, which has been inferred from previous studies of other populations in eastern Africa (Kivisild et al. 2004). These results are intriguing and suggest that the role of Tanzanians in the migration of modern humans within and out of Africa should be analyzed in greater detail after more extensive data collection, particularly from analysis of Y-, X-, and autosomal chromosome markers. Our analyses of African mtDNAs suggest populations in eastern Africa have played an important and persistent role in the origin and diversification of modern humans.
Molecular Biology and Evolution, Volume 24, Issue 3, 1 March 2007, Pages 757–768
|
|

