|
|
Post by Admin on Aug 14, 2019 17:50:10 GMT
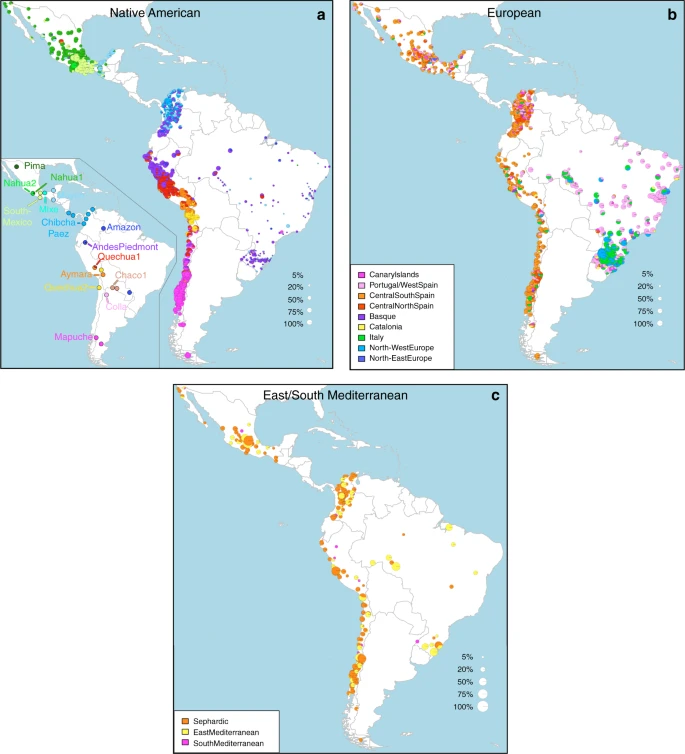 Fig. 2 Geographic variation of ancestry sub-components in Latin American individuals. a Native American, b European, and c East/South Mediterranean. Each pie represents an individual, with pie location corresponding to birthplace. Since many individuals share birthplace, jittering has been performed based on pie size and how crowded an area is. Pie size is proportional to total ancestry from all sources depicted in that specific figure, and only individuals with >5% of such total ancestry are shown. Coloring of pies represents the proportion of each sub-continental component estimated for each individual (color-coded as in Fig. 1; Chaco2 does not contribute >5% to any individual and was excluded). Pies in (c) have been enlarged to facilitate visualization Patterns of European ancestry in the CANDELA dataset Importantly, SOURCEFIND distinguishes between closely-related ancestry components from the Iberian Peninsula, as well as from the East and South Mediterranean (including individuals self-identified as Sephardic; i.e. Iberian Jews; Supplementary Note 2). The distribution of European ancestry in the CANDELA sample shows a sharp differentiation between Brazil and the Spanish American countries (Fig. 1c). In Brazil the predominant European sub-component matches mostly the Portugal/West-Spain reference group while in Mexico, Colombia, Peru and Chile it is mostly Central/South-Spanish ancestry that is inferred (Figs. 1c and 2b). This differentiation closely matches colonial history. The European settlement of what is now Latin America involved two main areas of colonial expansion, as agreed in the Tordesillas treaty of 1494. This treaty established that territories west of a meridian somewhat east of the Amazon river-mouth were ascribed to Spain, while territories east of this meridian were attributed to Portugal3,30. Portuguese migration thus concentrated in Eastern South America, gradually expanding beyond the Tordesillas meridian until achieving Brazil’s current political borders, which at independence, remained a single political entity. Conversely, Spanish immigrants settled mainly in territories of Central America and Western South America, which at independence fragmented into separate countries3. The relatively small contribution inferred here for the Basque and Catalan agrees with historical information documenting that Spanish migrants to the Americas originated mainly in Southern and Central Spain31. In addition to Portugal/West-Spain ancestry the Brazilian sample also shows substantial genetic components most closely related to the Italian and German reference groups, and these concentrate in the South of the country (Fig. 2b). This pattern is consistent with the documented migration to Southern Brazil of large numbers of Germans and Italians starting in the late 19th century30. Dating admixture from different sources To assess the time-frame of admixture between the ancestry components described above we used the program GLOBETROTTER27. Since admixture proportions in Latin Americans vary greatly, we analyzed each individual separately; simulations confirmed the accuracy of GLOBETROTTER in this setting (Supplementary Note 2). Inferred dates for events involving an Iberian source (the initial settlers arriving from Europe and allegedly the first to admix with the Natives) had a median of ten generations (IQR = 7–13), consistent with other estimates for admixture in Latin America6,10,15. Noticeably, individuals with more recent inferred dates of admixture have greater Native ancestry (Fig. 3a, Supplementary Table 4), with simulations suggesting this is consistent with continuing admixture between admixed Latin Americans and unadmixed Natives (Supplementary Note 2), possibly as a result of the decline in Iberian immigration after the mid-17th century, concomitant with the demographic recovery of neighboring Native American populations1,32. Compared to inferred dates related to Iberian admixture, admixture events involving non-Iberian European sources (Northwest Europe, Italy) have a significant skew towards more recent dates (Fig. 3b; Wilcoxon rank-sum test one-sided p-value = 3 × 10⁻⁸), consistent with the relatively recent arrival of Germans and Italians30. 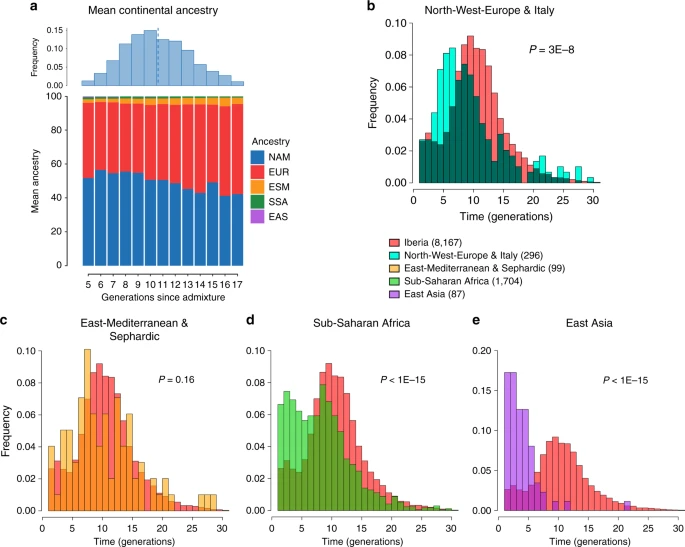 Fig. 3 Times since admixture estimated using GLOBETROTTER. a Top: frequency distribution of admixture times for individuals in which a single admixture event between Native and European sources was inferred (dashed line indicates the mean). Bottom: mean continental ancestry (%) as a function of time since admixture among these individuals. Only time bins including >20 individuals are shown. (NAM Native American, EUR European, ESM East/South Mediterranean, SSA Sub-Saharan African, EAS East Asian). b–e show contrasts of the distribution of admixture times involving Iberian versus other sources: b North-West Europe and Italy, c East Mediterranean and Sephardic, d Sub-Saharan Africa and e East Asia. p-values for comparing the mean date of Iberian versus each other ancestry source are from a one-sided Mann–Whitney U test, and numbers of inferred admixture events are given in parenthesis East/South Mediterranean ancestry in the CANDELA dataset SOURCEFIND finds that Sephardic/East/South Mediterranean ancestry is detectable in each country’s samples: Brazil (1%), Chile (4%), Colombia (3%), Mexico (3%) and Peru (2%). Altogether, ~23% of the CANDELA individuals show >5% of such ancestry (an average of 12.2%) (Fig. 1d) and in these individuals SOURCEFIND infers this ancestry to be mostly Sephardic (7.3%), with smaller non-Sephardic East Mediterranean (3.9%) and non-Sephardic South Mediterranean (1%) contributions. Individuals with Sephardic/East/South Mediterranean ancestry were detected across Latin America (Fig. 2c). It is possible that outliers with particularly high values of Sephardic/East/South Mediterranean ancestry are descendants from recent non-European immigrants. For 19 of 42 individuals with >25% Sephardic/East/South Mediterranean ancestry, genealogical information (up to grandparents) identified ancestors born in the Eastern Mediterranean (thus validating the SOURCEFIND inference). However, no recent immigration was documented for other individuals, including all Colombians with >5% Sephardic ancestry (despite these Colombians showing the highest estimated Sephardic ancestry across countries; ~10% on average, Fig. 1d). Furthermore, GLOBETROTTER estimates for the time since East/South Mediterranean admixture were not significantly different from those involving Iberian sources (Fig. 3c; Wilcoxon rank-sum test one-sided p-value > 0.1), consistent with most of this ancestry component being contributed simultaneously with the initial colonial immigrants. Jewish communities existed in Iberia (Sepharad) since roman times and much of the peninsula was ruled by Arabs and Berbers for most of the Middle Ages, by the end of which large Sephardic communities had developed33. Genetic studies have detected South and East Mediterranean ancestry in the current Spanish population, as well European admixture in the Sephardim34,35,36. The estimates of South/East Mediterranean ancestry in Latin Americans obtained here represent values over and above those present in the Iberian individuals we examined, suggesting colonial migration to Latin America involved people with relatively higher levels of South/East Mediterranean ancestry. Columbus’ arrival to the New World in the late 15th century coincided with the expulsion and forced conversion of Spanish Jews, with similar measures subsequently affecting Spanish Muslims. Although Christian converts were legally forbidden from migrating to the colonies, historical records (often from the Inquisition) document that some individuals made the journey33. Since this migration was mostly a clandestine process, its magnitude has been difficult to assess. Genetic studies have occasionally provided evidence that certain Latin American populations could have some Converso ancestry and this is at times supported by some historical evidence3,37,38. Our findings indicate that the signature of a colonial migration to Latin America of people with relatively high South/East Mediterranean ancestry is much more prevalent than suggested by these special cases, or by historical records. Sub-Saharan African ancestry in the CANDELA dataset It has been estimated that Brazil received about 4.2 million African slaves (about half of those brought to the Americas) while Spanish America altogether received about 1.5 million3. However, the average Sub-Saharan ancestry in the full CANDELA sample is relatively low (<4%), probably reflecting the fact that regions which historically received large numbers of slaves are under-represented in this sample (particularly for Brazil, which was sampled mainly in the South of the country)19. Altogether, ~22% of the individuals studied show more than 5% sub-Saharan African ancestry. SOURCEFIND infers a marked predominance of the West African sub-component, particularly in the Spanish American countries (Supplementary Figures 5 and 6), consistent with previous genetic analyses, and with historical information1,39. The distribution of dates involving Sub-Saharan African admixture mostly overlaps with that for Iberian admixture, although a substantial proportion of recent dates were also inferred (Fig. 3d), possibly reflecting continuing African admixture in the regions sampled. East Asian ancestry in the CANDELA dataset Other than the major Native American, European/Mediterranean and sub-Saharan African ancestry components, historical information indicates some East Asian migration to Latin America, particularly after independence in the 19th century30. SOURCEFIND estimates East Asian ancestry in the CANDELA sample to be, on average, very low (<1%) in Brazil, Chile, Colombia, Mexico, and slightly higher in Peru (1.4%). In individuals with >5% East Asian ancestry, this component is inferred to be most closely related to the Chinese and to a lesser extent the Japanese, except in Brazil where the opposite is found (Supplementary Fig. 7). These results match historical records documenting the arrival of Chinese laborers to Peru since the middle 19th century40 and Japanese laborers to Brazil since the early 20th century41. Reflecting the relatively recent nature of these events, GLOBETROTTER estimated dates for admixture involving an East Asian source were significantly more recent than those involving Iberian sources (median = 3, IQR 2–5 generations ago, Wilcoxon rank-sum test one-sided p-value < 1 × 10–15; Fig. 3e). |
|
|
|
Post by Admin on Aug 14, 2019 19:30:49 GMT
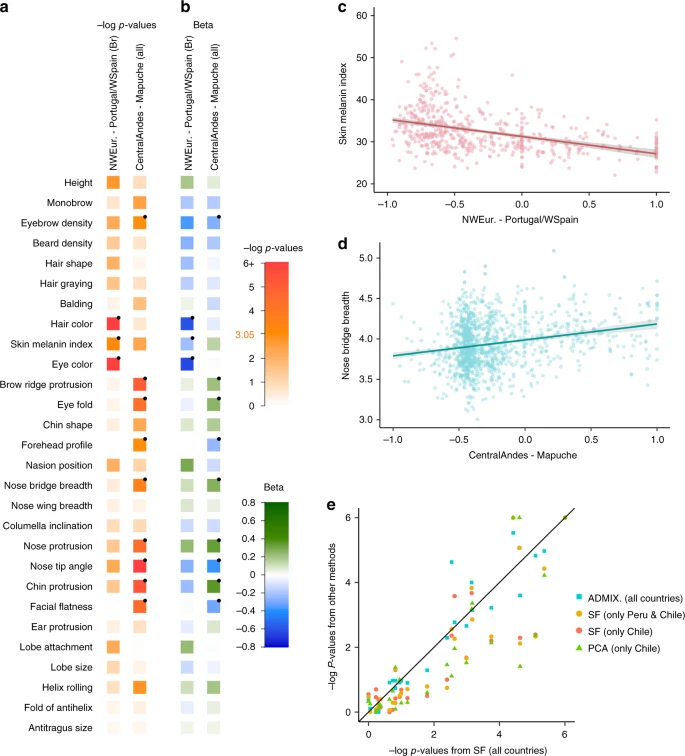 Fig. 4 Effect of sub-continental genetic ancestry on physical appearance. a Regression –log p-values for 28 traits (Supplementary Note 4) against the contrast between two sub-continental ancestry components estimated by SOURCEFIND. The left column shows results for the Portugal/West-Spain versus North-West Europe contrast in the Brazilian sample (Br). The right column presents the contrast between Central Andes versus Mapuche ancestry in the full CANDELA sample. b Regression coefficients (Betas) in units of SD for the contrasts in (a). In a, b color intensity reflects variation in -Log-p values or beta coefficients, as indicated on the scale. Bonferroni-corrected significant values are highlighted with a dot (–log p-value threshold of 3.05 for alpha = 0.05). c, d Display scatterplots and regression lines (with 95% confidence intervals) for two traits showing significant association with variation in sub-continental ancestry: skin melanin index in Brazilians (c) and nose bridge breadth in Chileans and Peruvians (d; Y-axis is in Procrustes units). e Scatterplot of -log p-values from follow-up analyses of the regression of physical traits on the Central Andes versus Mapuche ancestry contrast. The X-axis refers to -log p-values from the primary analyses (using SOURCEFIND (SF) estimates and data for all individuals, as shown in the second column of (a)). The Y-axis refers to -log-p values from four other regression analyses: using SOURCEFIND (SF) estimates restricted to Peruvian and Chilean individuals, or only to Chileans; using related ancestry components defined by: ADMIXTURE (ADMIX., at K = 7) in all the CANDELA data, or by PCA (PC 7), in an analysis limited to Chileans (Supplementary Note 5, Supplementary Figures 8 and 9). Sample sizes: all data N = 5,794, Peruvians and Chileans N = 2,594, Chileans N = 1,542 It is noticeable that regional Native American ancestry impacts on nose shape. The Mapuche component is strongly associated with a less protruded nose (p-value <2 × 10⁻⁵) and broader nose tip angle (p-value < 10−7). This is consistent with physical anthropology studies indicating that the Mapuche have a flatter, wider nose than Central Andean populations43. In a recent GWAS for facial features in the CANDELA sample, most loci identified impacted on nose shape21. For each of the six index SNPs significantly associated with facial features in that GWAS, allele frequencies at haplotypes inferred to be of Central Andean ancestry were significantly different from allele frequencies at haplotypes inferred to be of Mapuche ancestry (Supplementary Table 5). Furthermore, for each of these six SNPs, the frequency of the allele associated with an increase of the phenotypic trait was higher in the Native component associated with an increase of that trait. The nasal cavity is an important regulator of inhaled air temperature and humidity, and evolutionary studies suggest that nose shape has been influenced by adaptation to cold/dry versus hot/humid environments44. Consistent with selection effects at these SNPs, allele frequencies at the set of six GWAS index SNPs jointly were more differentiated between Central Andean and Mapuche than was the case in randomly selected sets of six genome-wide SNPs that matched each index SNP for the number of inferred Native ancestry haplotypes and minor-allele frequency in either the inferred Central Andean (p-value < 0.02) or inferred Mapuche (p-value < 0.01) haplotypes (Supplementary Figures 10 and 11, Supplementary Table 6). Since variation in altitude correlates with air temperature and humidity, it will be interesting to explore further whether the association of Central Andean ancestry with nose shape and the differences in allele frequencies in loci associated with facial features between Central Andeans and the Mapuche relate to altitude adaptation during Native American evolution. Discussion By leveraging information from shared haplotypes, here we infer the timings and proportions of ancestry contributions to Latin Americans since the colonial era. While previous work has suggested GLOBETROTTER’s inferred dates are robust to using different surrogates to the true ancestry sources27, inferred proportions of ancestry inevitably depend on which surrogate groups are used. In general our SOURCEFIND inference suggests that the reference populations included in this study are good surrogates of the true ancestral sources, as demonstrated by the preferential matching to specific geographic regions of Iberia (Fig. 2b) and the strong correspondence between geography and ancestry matching in the Native component (Fig. 2a). A caveat to this is that some of our reference Native groups evidenced strong genetic drift and SOURCEFIND inferred negligible contributions from such groups (Supplementary Table 7). Indeed if such drift is post-Columbian, the extant Native populations may not represent well the pre-Columbian Natives that admixed with immigrant settlers. DNA from the remains of pre-Columbian Native Americans could shed light on the extent to which this might be the case. A further complication is that some of the reference populations may have experienced admixture following the colonial period. For example, it is possible that the Iberian reference individuals examined here have less non-European (i.e. East/South Mediterranean and/or Sub-Saharan African) ancestry than individuals migrating to the Americas during the colonial period, due to more recent admixture with other Europeans. In this case SOURCEFIND may overestimate the contributions from the non-European groups. Because of this, estimates for each of the East/South /Mediterranean and African components should be interpreted as values over and above those present in the present-day Spanish/Portuguese reference individuals examined. As noted above, the similarity in inferred dates for admixture involving East/South Mediterranean versus Iberian ancestry furthermore suggests that the individuals carrying this excess East/South Mediterranean ancestry migrated to Latin America during the colonial period. In conclusion, the results presented here exemplify how historical events have finely structured the genetic make-up of Latin Americans, and provide insights into the complicated dynamics and timescales of intermixing among different continental groups from the colonial-period up until recently. Our findings illustrate how genetic analyses can contribute to building a fuller picture of human history. This is particularly the case for poorly documented events such as the clandestine migration of recent Christian Conversos, of East/South Mediterranean ancestry, to colonial Latin America. Furthermore, our analyses show how regional genetic variation, subtly shaped by history, can impact on the genetic architecture of complex phenotypes across major geographic regions. We demonstrate how this regional genetic diversity can be analyzed in admixed individuals with ancestry from various sources; an encouraging result given the ubiquity of recent admixture in world-wide populations27,45. Our results underline the importance, for a fuller exploitation of genomic data, of a broader description of human genetic and phenotypic diversity than is currently available. Nature Communications volume 9, Article number: 5388 (2018) |
|
|
|
Post by Admin on Jan 19, 2020 21:00:55 GMT
 Abstract Recent genetic studies, based on Y chromosome polymorphic markers, showed that Ashkenazi Jews are more closely related to other Jewish and Middle Eastern groups than to their host populations in Europe. However, Ashkenazim have an elevated frequency of R-M17, the dominant Y chromosome haplogroup in Eastern Europeans, suggesting possible gene flow. In the present study of 495 Y chromosomes of Ashkenazim, 57 (11.5%) were found to belong to R-M17. Detailed analyses of haplotype structure, diversity and geographic distribution suggest a founder effect for this haplogroup, introduced at an early stage into the evolving Ashkenazi community in Europe. R-M17 chromosomes in Ashkenazim may represent vestiges of the mysterious Khazars.  Introduction Ashkenazi Jews, who have resided in various European countries during the Diaspora, traditionally trace their origin to the Jewish people that lived in the Holy Land before the Roman exile. However, some studies claimed that a substantial part of Ashkenazim were descendants of Eastern European non-Jews. In particular, according to Middle Age historians, the Khazars from a small kingdom near the Caspian Sea converted en masse to Judaism1 and therefore might have contributed to the composition of the emerging Ashkenazi community. Yet, recent genetic studies, based on Y chromosome polymorphic markers, clearly showed that Ashkenazim are more closely related to other Jewish and Middle Eastern groups than to their host populations in Europe.2, 3, 4 Those findings argue against large-scale male-mediated gene flow into the Ashkenazi community during the Diaspora. The male admixture proportion of Europeans in Ashkenazi Jews was estimated to be 0.5% per generation,3 indicating that Ashkenazim remained, to a large extent, genetically isolated throughout their history. Ashkenazim were found to have a significantly higher frequency of the R-M17 haplogroup compared with Sephardic and Kurdish Jews.4, 5 Interestingly, Behar et al6 reported R-M17 to be the dominant haplogroup in Ashkenazi Levites (∼52%), although rare in Ashkenazi Cohanim (1.3%) and Israelites (4%). R-M17, the most common haplogroup in Eastern Europe, was suggested to have originated and started to expand in the Ukraine, probably in a Paleolithic population after the Last Glacial Maximum about 13 000 years ago.5, 7 Our present study demonstrates that R-M17 is a distinctive feature of the Ashkenazim in general and not only of Levites, as reported previously.6 Furthermore, we provide evidence for a founder effect of this haplogroup in Ashkenazim, dated to the first millennium CE. Subjects and methods A total of 495 DNA samples, from different sources (Table 1), were collected from paternally unrelated male Ashkenazi Jews, irrespective of their religious status (Cohen, Levite, Israelite). 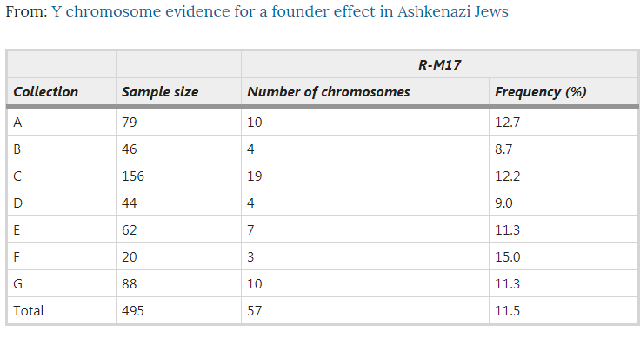 The typing of the Y chromosome biallelic marker M17 and the six microsatelllite loci (DYS19, DYS388, DYS390, DYS391, DYS392 and DYS393) was conducted following Thomas et al.8 Statistical analyses were performed as previously described.4 The study was approved by the ethics review committees of the respective institutions. |
|
|
|
Post by Admin on Jan 20, 2020 18:47:32 GMT
Results and discussion In total, 495 DNA samples from different collections (Table 1) were screened for the Y chromosome polymorphism M17. The average frequency of the haplogroup R-M17 in Ashkenazi Jews (11.5%, 57 individuals) is significantly higher (P<0.05) than that in Sephardic Jews (3.9%), Kurdish Jews (4%) and Palestinian Arabs (1.4%). To date, comparable frequencies of R-M17 in other Middle Eastern populations have been reported in Moslem Kurds, Syrians and Lebanese (Table 2). However, the haplotype distribution within R-M17, available only for Moslem Kurds, is very different from that of Ashkenazim.4 These data suggest that the increase in R-M17 in Ashkenazim occurred after they had gone into the Diaspora. Variation within R-M17 was examined by analysing 56 of the 57 chromosomes for six microsatellite loci. Apart from one singleton (haplotype H9), the other 13 haplotypes form a compact network (Figure 1). The star-like pattern and the low level of diversity are indicative of a founder effect. The most common R-M17 haplotype in the total Ashkenazi sample (∼45%), haplotype 6 (H6), is most likely the ancestral haplotype of this haplogroup among Ashkenazim. The time to the most recent common ancestor of R-M17 in Ashkenazim9 was estimated to 62.7 generations ago (excluding H9), using the previously published mutation rate for the six microsatellite loci studied here (μ=1.8 × 10⁻³ with 95% CI 9.8 × 10⁻⁴–3.1 × 10⁻³).10 Assuming a generation time of 25 years, this amounts to 1567 years ago (95% CI 2877–910 years ago). 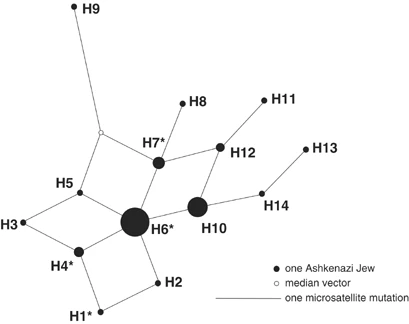 Figure 1 If R-M17 had been present in substantial frequency in the pre-Diaspora Y chromosome pool, one would expect to observe the ancestral haplotype H6 in other Jewish groups and in Palestinians who share a large portion of their Y chromosomes with Jews.3, 4, 11 However, in a combined non-Ashkenazi sample of 320 individuals (Sephardic, Kurdish Jews and Palestinians),4 H6 was found only in a single Sephardic Jew (0.3%; Figure 1). This finding strongly suggests gene flow from an external population into the Ashkenazi gene pool. Where did the R-M17 chromosomes in Ashkenazim come from? The haplogroup R-M17 has a wide geographic distribution in Europe, West Asia and the Middle East, with the highest frequencies in Eastern European populations (Table 2). Haplotype H6 is also present at considerable frequencies in various Eastern European populations,5, 12, 13 but is absent or found only at very low frequencies in Central and West Asians and in Middle Easterners.14, 15 Thus, R-M17 in Ashkenazi Jews could represent gene flow from Eastern European populations. This scenario is supported by the lower haplotype diversity measures (h) in Ashkenazim (0.735±0.05) compared to those of Eastern European populations5 (ranging from 0.894±0.022 to 0.919±0.026), and by the fact that in a combined Ashkenazi–European network, Jews present only a subset of the haplotypes (not shown). The widespread distribution of R-M17 in Europe might suggest multiple gene flow events from the European host populations into Ashkenazim. However, we observed that the frequencies of R-M17 in Jews from various countries (Germany, Lithuania, Czechoslovakia, Hungary, Romania, Poland, Russia and the Ukraine) ranged from 12–13% in Russia and Ukraine to 22% in Germany and Lithuania, and did not differ from one another (P>0.05). Likewise, the haplotypes of Jews from these countries showed very similar distribution patterns in a network (not shown). Furthermore, the frequencies of R-M17 in different Ashkenazi communities did not correspond to the east–west cline seen in Europeans. Altogether, these results support the hypothesis of a single male founder who introduced R-M17 into the Ashkenazi gene pool at the beginning of the Jewish Diaspora in Europe. Since then this haplogroup has expanded and spread among the Jewish communities across Europe. Noteworthy, Behar et al,6 in their sample of Ashkenazi Levites, found R-M17 at a frequency of 52% and its modal haplotype (identical to H6 in the present study) at 74% within this haplogroup. They suggested a founder event specific to this particular group as a result of intrusion of one or a few European Y chromosomes into the forming Ashkenazi community. The present study does not necessarily contradict that of Behar et al,6 but rather indicates that R-M17 is characteristic of the general Ashkenazi population and not restricted to the Levites. The proportion of Levites in different Jewish populations has been estimated to range from 0.2516 to 3.4%.17 Thus, their contribution to the overall frequency of R-M17 in Ashkenazim could not exceed 2%, while the frequency observed in the present study is 11.5%. Similar frequency (9.7%) was also reported by Passarino et al.5 Furthermore, the haplotype diversity in the Ashkenazi Levites (0.451)6 is lower than in the sample of Ashkenazi Jews described here, suggesting that R-M17 drifted to high frequency in the Levites more recently than in the general Ashkenazi population. It is historically well documented that the Khazar King Bulan and his court converted to Judaism at the end of the 8th century CE.1 The Khazars were originally a Turkic tribe from Central Asia who settled in the northern Caucasus and later spread to southern Russia and eastern Ukraine. Some authors argue that after the fall of their kingdom in the second half of the 10th century CE, the Khazar converts were absorbed by the emerging Ashkenazi Jewish community in Eastern Europe.18, 19 Since R-M17 haplogroup is also found at moderate to high frequencies in Central Asia20 and southern Russia/Ukraine,5 this haplogroup could have been present in the Khazars. However, if the R-M17 chromosomes in Ashkenazi Jews do indeed represent the vestiges of the mysterious Khazars then, according to our data, this contribution was limited to either a single founder or a few closely related men, and does not exceed ∼12% of the present-day Ashkenazim. European Journal of Human Genetics volume 13, 388–391(2005) |
|
|
|
Post by Admin on Nov 2, 2021 21:01:09 GMT
Modern Jews may traditionally trace their ancestry to the Holy Land, but a new genetic study finds otherwise. A detailed look at thousands of genomes finds that Ashkenazim—who make up roughly 80% of the world's Jews, including 90% of those in America and half of those in Israel—ultimately came not from the Middle East, but from Western Europe, perhaps Italy.
Most mainstream historians regard Ashkenazim as the descendants of Jews who moved into central Europe from the Middle East sometime before the 12th century C.E. Ashekenazim, like most members of this religious, cultural, and ethnic group, traditionally trace their ancestry to the ancient Israelites. The Israelites, in turn, arose between 3000 and 4000 years ago in the Middle East, according to both Biblical sources and archaeological evidence. They dispersed after the Romans destroyed their Second Temple in Jerusalem in 70 C.E.
Recent genetic work has supported this traditional view. Two studies, one led by geneticist Harry Ostrer of the New York University School of Medicine, and the other by geneticist Doron Behar of the Rambam Health Care Campus in Haifa, Israel, traced the three main Diaspora groups—Ashkenazim, Sephardim from Spain and Portugal, and Oriental Jews from the Middle East—to people who all lived in the Middle East about 2000 years ago. The Ostrer study used DNA from the nucleus of the cell in its analyses, and the Behar study used both nuclear and mitochondrial DNA (mtDNA); the latter comes from tiny bodies in the living cell that provide it with energy. Many other researchers considered these results to be definitive at the time.
Yet there were lingering questions. Ostrer and Behar had samples from only a couple of hundred Jews, for example. And while the Behar group identified four major mtDNA "founder groups" for the Ashkenazim, all supposedly with roots in the Middle East, it was able to trace only about 40% of Ashkenazi ancestry overall.
So a different team of scientists, led by geneticist Martin Richards at the University of Huddersfield in the United Kingdom, embarked on a new search for the origins of these four founder groups. The team focused on mtDNA, which is often employed in genetic studies because it is easier to sequence and allows analysis of huge population samples. However, mtDNA is inherited through the mother and not the father, so it reveals the history of maternal lineages only.
Geneticists have identified certain mtDNA markers that define lineages in different parts of the world. Behar's group had traced the Jewish founder groups to two mtDNA genetic lineages called haplogroup K and haplogroup N1b. The Jewish lineages were nested within these two larger groups, which include both Jews and non-Jews. So Richards and his colleagues first set out to understand the history of these broader lineages. They analyzed about 2500 complete and 28,000 partial mtDNA genomes of mostly non-Jews worldwide, plus 836 partial mtDNA genomes of Ashkenazi Jews, to see where the Ashkenazim fit into the overall history.
The result was very clear-cut, the authors say: As reported online today in Nature Communications, more than 80% of Ashkenazi mtDNAs had their origins thousands of years ago in Western Europe, during or before Biblical times—and in some cases even before farming came to that part of the continent some 7500 years ago. The closest matches were with mtDNAs from people who today live in and around Italy. The results imply that the Jews can trace their heritage to women who had lived in Europe at that time. Very few Ashkenazi mtDNAs could be traced to the Middle East.
The results not only conflict with the Ostrer and Behar results, but also with widespread assumptions about Jewish identity. Jews have traditionally considered that the mother determines the ethnic identity of her children. If being Jewish is defined as genetically descending from the Israelites through the maternal line, then many Ashkenazi Jews fail the test, according to this data.
Richards acknowledges that the work is likely to be controversial. "I'd anticipate some resistance to our conclusions in certain quarters," he says. One way to reconcile his team's findings with those of other researchers, he says, is to assume that the founders of the male Ashkenazi lineages were indeed originally from the Middle East, but that the maternal line arose in Europe much earlier. The European women then converted to Judaism after male Jews moved into the continent, establishing the Ashkenazi lineages that we see today. That suggestion fits with the contention of some historians that many women converted to Judaism across Mediterranean Europe during the so-called Hellenistic period between about 300 B.C.E. and 30 B.C.E.
"The data are very convincing," says Antonio Torroni, a geneticist at the University of Pavia in Italy and a leading expert in the genetics of Europeans. He adds that recent studies of DNA from the cell nucleus have also shown "a very close similarity between Ashkenazi Jews and Italians."
The new data also put the nail in the coffin of another, highly controversial, hypothesis about Jewish ancestry: that the Ashkenazim actually descend from the Khazars, a Turkic people in Western Asia's Caucasus region whose rulers are known to have converted to Judaism in the 8th century C.E. That idea was promoted in a 2008 book by historian Shlomo Sand of Tel Aviv University in Israel. Ostrer and Behar found no such link, however, and Richards's team, which sampled mtDNAs from Asia and the Caucasus specifically to test this idea, also found no evidence for it.
Behar remains unconvinced. He says it's "clear that Ashkenazi maternal ancestry includes both [Middle Eastern] and European origins," but he does not agree that the deepest roots of the Ashkenazi Jews can be found in prehistoric Europe. He says that he and his colleagues will be submitting their critique of the Richards study soon to a peer-reviewed scientific journal.
doi: 10.1126/article.24099
|
|

