|
|
Post by Admin on Jan 6, 2019 19:38:05 GMT
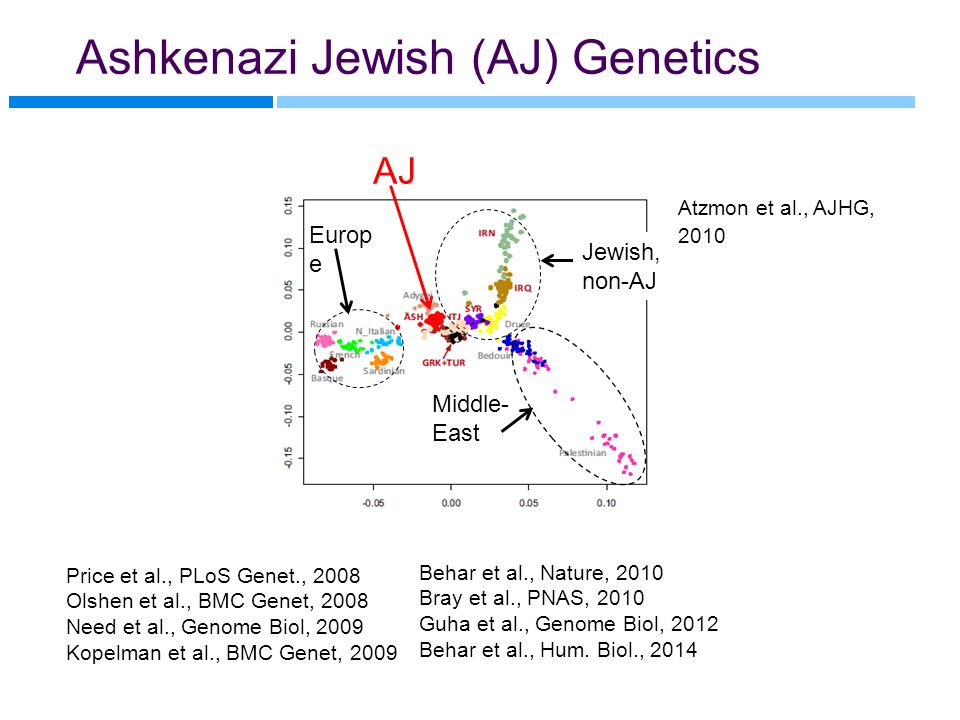 Ashkenazim generally do well in IQ tests, scoring 12-15 points above the mean value of 100, and have contributed disproportionately to the intellectual and cultural life of the West. They also suffer more often than most people from a number of genetic diseases, such as Tay-Sachs and Gaucher, which may show that the Ashkenazim's high intelligence and the genetic diseases are intimately linked. 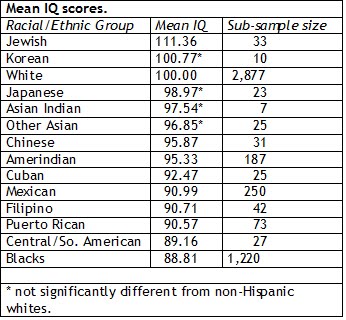 The average IQ score of Ashkenazi Jews has been calculated to be from a range of 110-115, which is significantly higher than any other ethnic groups. However, Israel scores around 95-97 in IQ tests on average as 70% of Israelis are not Ashkenazi Jews, who are maternally descended from prehistoric Europeans. Ashkenazi Jews are an admixed population and specific genetic mutations would have occurred in the process. Xue et al. (2017) proposed a three-way admixture with least two events of European admixture below. One third of Ashkenazi Jews of Eastern European origin belong to haplogroup K, compared to an average of only about 5% in Europe and 6.5% in Germany. The two main Ashkenazi subclades K1a1b1a and K1a9 are associated with higher brain pH, better brain connectivity and higher IQ.  Ashkenazi history begins with the Jewish rebellion against Roman rule in the first century AD. When this was crushed, Jewish refugees fled in all directions. The descendants of those who fled to Europe became known as Ashkenazim. In the Middle Ages, European Jews were subjected to legal discrimination, one effect of which was to drive them into money-related professions such as banking and tax farming which were often disdained by, or forbidden to, Christians. The professions occupied by European Jews were all ones that put a premium on intelligence. Several studies have shown that intelligence, as measured by IQ tests, is highly correlated with income in jobs such as banking.  There are genetic diseases specific to the Ashkenazim such as the sphingolipid-storage diseases, Tay-Sachs, Gaucher's and Niemann-Pick, which involve in extra growth of the protuberances that connect nerve cells together. This enhanced protuberance growth would yield better linkage between brain cells, thus leading to higher intelligence (Cochran et al. 2005). It's similar to the case of autism and alleles for autism overlap broadly with alleles for high intelligence, which appears paradoxical given how autism is characterized. Having a high IQ is a double-edged sword.  Having a very high general intelligence does not seem to have resulted in that great of a gain in social or cultural status in comparison to being of normal intelligence. In fact, if the genetic correlation is such that it’s associated with some higher risk for mental instability, it could simply be that a form of stabilizing selection over time kept humans within the “normal range” because that was evolutionarily optimal.  Bone marrow histology in a patient with Gaucher disease and multiple myeloma. A prediction is that Gaucher, Tay-Sachs, and Niemann-Pick heterozygotes will have higher tested IQ than control groups, probably on the order of 5 points. We do have strong but indirect evidence that one of these, Gaucher disease, does indeed increase IQ. Professor Ari Zimran, who heads the Gaucher Clinic at the Shaare Zedek Medical Centre in Jerusalem, furnished us a list of occupations of 302 Gaucher patients. Because of the Israeli medical care system, these are essentially all the Gaucher patients in the country. Of the 255 patients who are not retired and not students, 81 are in occupations that ordinarily average IQ’s greater than 120. |
|
|
|
Post by Admin on Jan 12, 2019 18:14:19 GMT
Biology of the Sphingolipid Mutations The sphingolipid storage mutations were probably favored and became common because of natural selection, yet we don’t see them in adjacent populations. We suggest that this is because the social niche favoring intelligence was key, rather than geographic location. It is unlikely that these mutations led to disease resistance in heterozygotes for two reasons. First, there is no real evidence for any disease resistance in heterozygotes (claims of TB resistance are unsupported) and most of the candidate serious diseases (smallpox, TB, bubonic plague, diarrheal diseases) affected the neighboring populations, that is people living literally across the street, as well as the Ashkenazim. Second and most important, the sphingolipid mutations look like IQ boosters. The key datum is the effect of increased levels of the storage compounds. Glucosylceramide, the Gaucher storage compound, promotes axonal growth and branching (Schwartz et al., 1995). In vitro, decreased glucosylceramide results in stunted neurons with short axons while an increase over normal levels (caused by chemically inhibiting glucocerebrosidase) increases axon length and branching. There is a similar effect in Tay-Sachs (Walkley et al., 2000; Walkley, 2003): decreased levels of GM2 ganglioside inhibit dendrite growth, while an increase over normal levels causes a marked increase in dendritogenesis. This increased dendritogenesis also occurs in Niemann-Pick type A cells, and in animal models of TaySachs and Niemann-Pick.  Figure 1, from Schwartz et al. (1995) shows the effect of glucosylceramide, the sphingolipid that accumulates in Gaucher disease. These camera lucida drawings of cultured rat hippocampal neurons show the effect of fumonisin, which inhibits glucosylceramide synthesis, and of conduritol B-epoxide (CBE) which inhibits lysosomal glycocerebrosidase and leads to the accumulation of glucosylceramide, thus mimicking Gaucher disease. Decreased levels of glucosylceramide stunt neural growth, while increased levels caused increased axonal growth and branching. Figure 1: Glucosylceramide Increases Axon Growth, from Schwartz et al. (1995), reproduced by permission of the Journal of Biological Chemistry. Dendritogenesis appears to be a necessary step in learning. Associative learning in mice significantly increases hippocampal dendritic spine density (Leuner et al., 2003), while enriched environments are also known to increase dendrite density (Holloway, 1966). It is likely that a tendency to increased dendritogenesis (in Tay-Sachs and Niemann-Pick heterozygotes) or to increased axonal growth and branching (in Gaucher heterozygotes) facilitates learning. Heterozygotes have half the normal amount of the lysosomal hydrolases and should show modest elevations of the sphingolipid storage compounds. A prediction is that Gaucher, Tay-Sachs, and Niemann-Pick heterozygotes will have higher tested IQ than control groups, probably on the order of 5 points. We do have strong but indirect evidence that one of these, Gaucher disease, does indeed increase IQ.  Tay-Sachs is caused by the absence of a vital enzyme called hexosaminidase-A (Hex-A). Without Hex-A, a fatty substance, or lipid, called GM2 ganglioside accumulates abnormally in cells, especially in the nerve cells of the brain. This ongoing accumulation causes progressive damage to the cells. Professor Ari Zimran, who heads the Gaucher Clinic at the Shaare Zedek Medical Centre in Jerusalem, furnished us a list of occupations of 302 Gaucher patients. Because of the Israeli medical care system, these are essentially all the Gaucher patients in the country. Of the 255 patients who are not retired and not students, 81 are in occupations that ordinarily average IQ’s greater than 120. There are 13 academics, 23 engineers, 14 scientists, and 31 in other high IQ occupations like accountants, physicians, or lawyers. The government of Israel states that 1.35% of Israeli’s working age population are engineers or scientists, while in the Gaucher patient sample 37/255 or 15% are engineers or scientists. Since Ashkenazim make up 60% of the workforce in Israel, a conservative base rate for engineers and scientists among Ashkenazim is 2.25% assuming that all engineers and scientists are Ashkenazim. With this rate, we expect 6 in our sample and we observe 37. The probability of 37 or more scientists and engineers in our sample, given a base rate of 2.25%, is approximately 4 x 10-19 . There are 5 physicists in the sample, while there is an equal number, 5, of unskilled workers. In the United States the fraction of people with undergraduate or higher degrees in physics is about one in one thousand. If this fraction applies even approximately to Israel the expected number of physicists in our sample is 0.25 while we observe 5. Gaucher patients are clearly a very high IQ subsample of the general population.  Are there Ashkenazi mutations other than these sphingolipid storage disorders that likely became common because of strong selection for IQ? There are several candidates. Ever since torsion dystonia among the Ashkenazim was first recognized, observers have commented on the unusual intelligence of patients. Flatau and Sterling (Eldridge, 1976) describe their first patient as showing “an intellectual development far exceeding his age”, and their second patient as showing “extraordinary mental development for his age.” At least ten other reports in the literature have made similar comments. Eldridge (1970, 1976) studied 14 Jewish torison dystonia patients: he found that their average IQ before the onset of symptoms was 121, compared to an averge score of 111 in a control group of 14 unrelated Jewish children matched for age, sex, and school district. Riklan and colleagues found that 15 Jewish patients with no family history of dystonia (typical of DYT1 dystonia) had an average verbal IQ of 117 (Eldridge, 1979; Riklan et al., 1976).  Torsion dystonia is unusual among the Ashkenazi mutations in that it is caused by a lowpenetrance dominant rather than a recessive, so disease risk and any heterozygote advantage exist in the same individual. About 10% of heterozygotes have crippling muscular spasms (usually curable by modern neurosurgery), and such individuals seldom reproduced in the past. A net fitness advantage could have existed if healthy carriers had a greater than 10% fitness edge, presumably from increased intelligence. Risch (Risch et al., 1995) found that linkage data indicate that the DYT1 mutation came into existence around 300 years ago. He suggests that a high reproductive variance may have decreased the effective Ashkenazi population size, resulting in drift, but as we pointed earlier, this proposed mechanism strengthens selection far more than drift. The high gene frequency and recent origin of the DYT1 are signs of positive selection, while the many observations of increased intelligence among people with ITD strongly suggests that increased fitness resulted from increased intelligence. Non-classic congenital adrenal hyperplasia (CAH) is another mutation that is unusually common among the Ashkenazim and has been reported to increase IQ. At least seven studies show high IQ in CAH patients, parents, and siblings, ranging from 107 to 113. Parents are obligate carriers and 2/3rds of siblings are carriers. There is also SES elevation in patient families (Nass and Baker, 1991). This mainly applies to the milder forms of CAH; there is no apparent IQ advantage in seriously ill patients like saltwasters. The Ashkenazi gene frequency is almost 20% (New and Wilson, 1999). |
|
|
|
Post by Admin on Apr 4, 2019 18:39:48 GMT
A novel piece of information available on the 100 Asian children is the race of the father. I divided the sample into a "pure" Asian group having both Asian mothers and Asian fathers (N = 63) and a "mixed" group (N = 37) of Asian mothers and other race fathers (mainly white, but including 5 blacks). At 7 years of age the unmixed Asians averaged an IQ of 114 versus one of 103 for the mixed-Asians and a cranial capacity of 1,170 cm³ versus one of 1,155 cm³ for the mixed--Asians and a cranial capacity of 1,170 cm³ versus one of 1,155 cm³ for the mixed-race group. 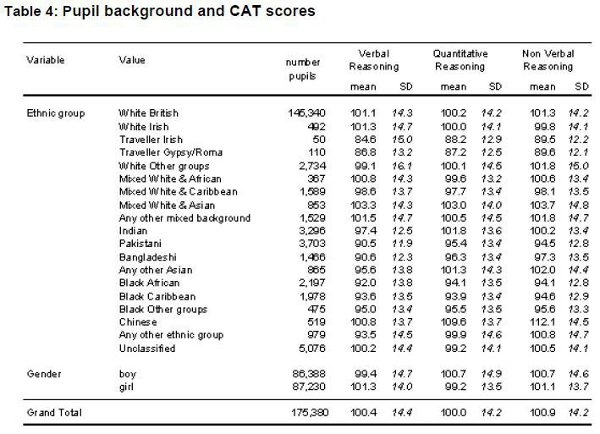 IQ test scores are significantly correlated with the socioeconomic hierarchies and cranial capacity. Is it reasonable to expect brain size and cognitive ability to be related? Yes, because, based on a partial count of representative areas of the brain, Haug (1987, p. 135) found a correlation of .479 (N = 81, p < .OOl) between number of cortical neurons and brain size in humans. His sample included both men and women. The regression relating the two measures is: number of cortical neurons (in billions)= 5.583 + 0.006 (cm3 brain volume). The difference between the low end of the normal distribution (1,000 cm3) and the high end (1,700 cm3) works out to be 4.2 billion neurons. The best estimate is that the typical human brain contains about 100 billion (10’ ‘) neurons classifiable into perhaps as many as 10,000 different types, resulting in 100,000 billion synapses (Kandel, 1991). Even storing information at the low average rate of one bit per synapse, which would require two levels of synaptic activity (high-or-low; on-or-off), the structure as a whole would generate 1014 bits of information. Contemporary supercomputers, by comparison, typically have a memory of about lo9 bits. 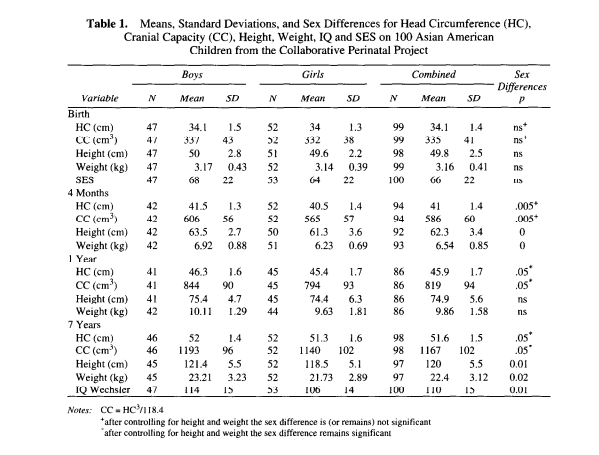 It is understandable that correlations between IQ and overall brain size will be modest. First, much of the brain is not involved in producing intelligence; thus, variation in size/mass of that tissue will lower the magnitude of the correlation. Second, IQ is not a perfect measure of intelligence and, thus, variance in IQ scores is an imperfect measure of variation in intelligence. Although brain size accounts for only a small percentage of variation in cognitive ability, it is important to note, following Hunter and Schmidt (1990), that small correlations can have large effects. For example, although the MRI-established brain-size/IQ correlation is only about .40, when squared, it shows that 16% of the variance is explained; further regression equations show that every 1 standard deviation increase in brain size increases IQ by 0.40 standard deviations on average. The data on catch-up growth, when applied to the Asian-white-black mean differences, argues in favor of the existence of genetic factors. The reason for this is that by age 7, Asians are above average in brain size but below average in body size whereas the opposite pattern is found for blacks and an intermediate pattern is found for whites. If major environmental insult or nutritional deprivation was the cause of the differences, as has often been posited for low birth-weight infants, one would not expect the particular pattern of catch- up growth that is demonstrated by these data. INTELLIGENCE 25(l): 7-20 |
|
|
|
Post by Admin on May 25, 2019 23:18:04 GMT
Past research suggests that within-family Flynn trends exist and correlate with observed patterns (1, 8). The IQ difference between scored siblings was shown to shrink with the age difference in periods of rising cohort IQs (as the Flynn effect counteracts the first-born birth order advantage) and to increase with the age difference in a period with declining cohort IQs (8). Building on this result, we use population-covering administrative data registers from Norway to estimate within-family Flynn effects across 30 birth cohorts and examine whether these estimates recover the full magnitude of, variation in, and reversal of the Flynn effects seen in average cohort scores. The Norwegian data have been extensively used in intelligence research (1, 4, 9⇓–11) and provide a particularly useful dataset for our purposes given the roughly symmetric positive and negative trends across the 1962–1991 cohorts (Fig. 1A). Based on data from birth cohorts born before 1985, prior research has reported this as a slowdown or leveling off of the Norwegian Flynn effect (9), but the additional cohorts included in our data strongly indicate that it is in fact a reversal.  Fig. 1. Average IQ score by birth year (A) and distribution of IQ scores (B). IQ scores are computed from stanine scores (s) using the conversion IQ = 100 + 7.5 × (s − 5). In A, the shaded region depicts 95% confidence intervals around the cohort mean score. n = 736,808. The analysis is made possible by the comprehensive coverage of administrative data for the native-born population. This enables us to precisely identify family relationships, birth order, and siblings without ability scores from military conscription testing. Precise controls of birth order are necessary for estimation of within-family trends, as prior research shows that IQ relates inversely to sibling order (12⇓–14). Ignoring birth order would induce omitted-variable bias with the order effect falsely attributed to later birth years, in turn causing negative bias in trend estimates. Information on unscored individuals is required to correct for changes in selection into ability testing over time, which otherwise will bias trend estimates.  Fig. 2. Within-family estimates of Flynn effects. The sample underlying estimates in A consists of all families with at least two scored brothers (n = 355,438), B of families with scored brothers in the first two parities (n = 215,514), and C of siblings born 1962–1991 in all families with sons in the first two parities (n = 236,934). Two-brother samples exclude twins and brothers born the same year. The dashed line depicts the trend for firstborn sons (n = 320,739 in A and B and 353,476 in C). Confidence intervals are computed from SEs clustered within families. The shaded region in C covers percentile values from the posterior distribution of the Bayesian model. Results The research question is whether within-family variation can recover the population Flynn trend apparent across families. This requires an appropriate comparison curve showing the across-family variation in IQ scores. The simplest such curve is the curve of observed means for all firstborn children by birth year, as it obviates the need for statistical controls for birth order. The coefficients from the standard fixed-effects model estimated on data for all scored siblings closely track the across-family variation in IQ scores throughout most of the data period (Fig. 2A). In particular, the within-family estimates confirm the positive Flynn trend during the first half of the observation period, with positive and statistically significant Flynn effects for the birth years 1962–1975. For this period, the average within-family Flynn effect is 0.26 IQ point per year (SI Appendix, Table S3, column 3), similar to the 0.28 estimated annual gain for full-scale IQ from a metaanalysis based on 271 independent samples from 31 countries (2). The fixed-effects model correctly identifies the turning point of the Flynn effect and indicates a decline for post-1975 birth cohorts. For the cohorts born in the latter half of the 1980s, however, the across-family decline in cohort IQ exceeds what the within-family estimates recover. Between the 1975 and 1991 cohorts, the average annual decline estimated using within-family variation is attenuated by almost two-thirds relative to the across-family trend: −0.08 IQ point per year versus −0.23 point per year (SI Appendix, Table S3, columns 1 and 3). One source for this divergence of within-family estimates and across-family Flynn trends in the decline period may be sample selection bias induced by conditioning the data on siblings with a valid IQ score. If selection into scoring is increasing over time, this generates a positive bias in trend estimates as families showing a decline are disproportionately removed from the sample. Conscription test coverage declined substantially for cohorts born after 1980, with coverage rates falling from 93% in 1980 to 83% in 1991 (Fig. 3A). This decline in coverage was selective and partly based on characteristics associated with intelligence: Focusing on families with sons in the first two parities and plotting the share of unscored younger siblings by the observed IQ score of the older brother, lower scoring firstborns were more likely to have unscored younger brothers (Fig. 3B). The problem is exacerbated toward the end of our data window: Among the 1987–1991 birth cohorts, fully 30% of those whose older sibling scored in the bottom IQ bracket have missing IQ scores. As sibling scores are correlated, this implies that low-ability males are less likely to be scored, and that the selection was stronger for the cohorts born in the late 1980s than for those from the 1960s and 1970s. |
|
|
|
Post by Admin on May 26, 2019 17:41:51 GMT
To assess the impact of this selection issue, we developed a Bayesian model for sibling pairs that exploits the correlation in sibling ability to estimate and correct for selection into scoring (Materials and Methods). The model provides selection-corrected estimates for both the within-family and population across-family Flynn trends, estimated on data for all pairs of male siblings (scored or unscored) born in different years and in the first two parities of their family (“two-brother sample”). Estimating the standard fixed-effect model on observed scores from the two-brother sample reconfirms that the fixed-effects model is unable to recover the across-family decline in cohort IQ (Fig. 2B). By contrast, the selection-correction model infers a stronger and more persistent within-family decline continuing into the years with increasing scoring selection that largely coincides with the selection-corrected across-family trend (Fig. 2C). The correlation in sibling ability, central to this model, is estimated at 0.47 (95% uncertainty bound: 0.46–0.48; see SI Appendix and SI Appendix, Table S6), identical to the weighted average of 69 studies based on a total of 26,473 American sibling pairs (15). Using the parameter draws from the posterior distribution, we can assess the similarity of the within- and across-family trends over longer periods. For the 1962–1975 Flynn increase period, the model estimates a 0.20 (95% uncertainty bound: 0.11, 0.29) average annual IQ point increase within families and a 0.18 (0.14, 0.21) increase across families (SI Appendix and SI Appendix, Table S3, columns 6 and 7). For the 1975–1991 decrease period, we estimate a 0.33 (0.26, 0.40) annual IQ point decline within families and a 0.34 (0.30, 0.38) decline across families. Taking the ratio of the within-family and across-family estimates, we find ratios of 1.14 (0.63, 1.69) for the increase period and 0.98 (0.79, 1.20) for the decrease period (Table 2, column 3).  Fig. 3. IQ score coverage in all families and missing IQ data in two-brother sample. A shows data coverage for all boys present in Norway on their 18th birthday (n = 817,611). B shows noncoverage rates for younger brothers in the two-brother sample; for legibility the figure depicts rates for three 5-y intervals only (n = 65,363; see SI Appendix, Table S4 for the complete series). Discussion Viewed together, the results from the standard family fixed-effects model and selection-correction model show that observed Flynn effects—both positive and negative—across three decades of Norwegian birth cohorts can be recovered using only within-family variation in IQ scores. While the fixed-effects model using observed scores fails to recover the full decline in the post-1975 cohorts in both the full sample (Fig. 2A) and the two-brother sample (Fig. 2B), the Bayesian model addressing selection into scoring fully recovers both the increase, turning point, and decline apparent across families over time, while indicating that the retrograde Flynn effect is more negative than that seen in observed scores (Fig. 2C). The results show that large positive and negative trends in cohort IQ operate within as well as across families. This implies that the trends are not due to a changing composition of families, and that there is at most a minor role for explanations involving genes (e.g., immigration and dysgenic fertility) and environmental factors largely fixed within families (e.g., parental education, socialization effects of low-ability parents, and family size). While such factors may be present, their influence is negligible compared with other environmental factors. Notably, this goes counter to the conclusion of a recent review on retrograde Flynn effects (6) and the expert opinions reported in a recent survey of intelligence researchers, which found “the anti-Flynn effect being attributed mainly to genetics and immigration” (7). As noted by two of the reviewers, the magnitude of the negative Flynn trend in our data itself speaks against the dysgenic hypothesis for retrograde Flynn effects, as changes in IQ over time are too large to plausibly reflect selection-driven genetic change in the population. This, in turn, means that dysgenic trends may be statistically imperceptible over the 16-y decline period studied. Polygenic scores that predict education are correlated with IQ and have been shown to correlate negatively with fertility in Icelandic and US data (16, 17). The authors of the Icelandic study extrapolate that their results imply a decline of 0.30 IQ point per decade, an effect sufficiently small to fall within the uncertainty bounds of the difference between across- and within-family trend estimates in the present study. While we cannot statistically rule out dysgenic trends of this magnitude, a more direct assessment of reproductive selection across the IQ distribution finds no indication of dysgenic fertility. The vast majority of fathers to children in the post-1975 cohorts were born between 1950 and 1970, and for these males we see a slight, positive IQ–fertility gradient: The mean IQ when scores are weighted by an individual’s number of children exceeds the unweighted mean (SI Appendix and SI Appendix, Table S5). This was the case both for the 1950–1960 cohorts scored under the old test norm and for the 1962–1970 cohorts scored under the new norm. A recent study finds similar results for these cohorts in data from neighboring Sweden (18). Ability scores are not available for women, but when we examine years of schooling instead of IQ scores we find the same pattern for men and no indication of negative (nor substantial positive) selection for women. Using the ratio of child-weighted to unweighted means as a summary indicator, the ratio is one or higher for each of the gender-cohort-specific comparisons (SI Appendix, Table S5). The ratios based on years of schooling are also remarkably stable across time for both men and women despite the dramatic increase in educational attainment that occurred across these cohorts. These results come with caveats, however: They speak only to dysgenic effects occurring within our sample of children born to two native-born parents, and the results assess the ability–fertility gradient using phenotypic (expressed) traits. On this last point, we cannot rule out the theoretical possibility of negative selection on a genetic component that is masked when assessed using environmentally influenced measures. Turning to the remaining hypotheses proposed, we note the difficulty of disentangling cohort and period effects. While our results support the claim that the main drivers of Flynn effects are environmental and vary within families, we are unable to identify the causal structure of the underlying environmental effects: Exposure occurring in any year will affect all cohorts below conscription age, but sensitivity to environmental factors may differ by age, and environmental effects may decay at different rates after exposure. The study design cannot distinguish between such possibilities, which also implies that the Flynn effect between two cohorts may differ with the age at which they are assessed (see the discussion in ref. 19), and our results remain consistent with a number of proposed hypotheses of IQ decline: changes in educational exposure or quality, changing media exposure, worsening nutrition or health, and social spillovers from increased immigration. PNAS June 26, 2018 115 (26) 6674-6678 |
|

