Post by Admin on Jul 19, 2020 22:07:32 GMT
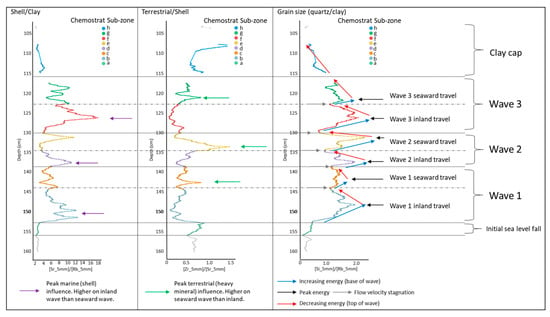
Figure 4. Proxy environmental data for key section (C3) of core ELF001A. Internal sub zones of geochemistry unit C3 showing eight sub units that form the chemical architecture of the tsunami deposit based on chemical proxies for shell (Sr), Clay (Rb), grain size (Quartz/Clay; Si/Rb) and terrestrial material (Detrital zircons; Zr).
From a review of geochemical application in tsunami deposit analysis Chagué-Goff et al. [22] suggested that three key ratios of elemental proxies are important, namely:
Sr/Rb—marine signature reflecting the chemical proxy for aragonite as shell content vs. clay content
Si/Rb—grain size proxy reflecting the chemical proxy for quartz (coarser sand grain) vs. clay content
Zr/Sr—a terrestrial vs. marine sediment chemical proxy based on the input of detrital zircons
The ratios were used to chemically zone the core into key chemo-stratigraphic sequences (Figure 4). The base of the core (chemo-stratigraphic zones C6 and C7) contain low Sr, Si and Zr and high Rb abundances indicating that they are composed of fine clay/silt deposits with only occasional shell fragments as a result of relatively low energy marine conditions. There is a sudden chemical change at 1.52 m, spanning 2 cm of section representing an erosional contact after which low energy conditions are abruptly terminated. This is followed by a zone of increased energy as reflected in a grain size increase, rise in Si and decrease in Rb into zone C5. The basal chemical sub-zone displays an increase in Zr/Sr suggesting that a terrestrial input was initiated after the erosion, possibly as a result of water retreat seaward drawing a signal from the land. Above this zone six characteristic chemical sub-zone cycles (b–g) are identified, with a further sub-zone at the end of the sequence.
The six cycles are marked by increasing Si/Rb and Sr/Rb at the base (associated with increasing grain size and increasing shell content respectively) to a peak in the middle of the sub-zone, which then decreases (sediment fining-upwards as indicated by the reducing Si/Rb ratio) to the top of the sub-zone. Boundaries between sub-zones are identified by a minima in Si/Rb reflecting flow velocity stagnation. Sub-zones b, d and f all have higher Sr/Rb peaks and lower Zr/Sr peaks than sub-zones c, e and g. Sub-zone c, e and g also display higher Zr/Sr peaks. The relationship of all the ratios would suggest that the sediment in the former sub-zones have a dominant marine source and the latter a more terrestrial source. The minima between zones represents times of lowest energy or stagnation in energy between the events. The last sub-zone (h) also shows rising values in Zr/Sr, which, together with decreasing Si/Rb and Sr/Rb values, reduce to levels that were recorded in zone C6 prior to the sudden change within unit C5. Unit C4 contains high Rb values, low Sr and increasing Si values reflecting the transitional from fine to coarse material with little shell input. The sequence terminates by a unit that shows low Rb, the lowest Sr and the highest Si abundances seen in the core typical of recent marine sands.
The iron-bearing minerals in the sediments can relate to several factors in the depositional environment including the source, transport and deposition mechanisms of the sediment. Palaeomagnetic data taken from sub-samples at 0.1 m intervals show signatures associated with low or no change in the detrital input from the base of the core to approximately 1.50 m (Figure 3D). From approximately 1.10 m to 1.50 m the core is characterized by lower χlf values than the preceding unit, together with a reduction in fine-grained magnetite (ARMχ). This suggests that the material is from a different origin to the local sediment supply as it contains a lower abundance of single domain particles. The S-ratio throughout this interval shows a higher concentration of haematite and goethite. However, this is not mirrored by the Hard IRM proxy or the coercivity of remanence, suggesting that the magnetic behaviour is the result of multi-domain magnetite co-existing with fine grained greigite. Above 1.10 m, SIRM and magnetic susceptibility suggest a much greater abundance of magnetic minerals.
4.4. Palaeoenvironmental Characterization of ELF001A
We further confirmed the nature and source of this stratum using multiple palaeoenvironmental proxies (Figure 5). Proxies included foraminifera, ostracods (SI Text S4.1), pollen (SI Text S4.2), diatoms (SI Text S4.3), molluscs (SI Text S4.4) and sedimentary ancient DNA (sedaDNA, SI Text S4.5). Relatively low levels of cytosine deamination and fragmentation patterns consistent with ancient DNA of this age and environment [23] were observed firstly by mapping sedaDNA to Quercus, Corylus and Betula genomes applying conventional mismatching approaches [24] (Figures S17 and S18), and secondly applying a novel metagenomic assessment methodology in which all sedaDNA is assessed for deamination damage, which may be more suitable for this data type (Figure S19). We then further tested sedaDNA for stratigraphic integrity to assess possible biomolecule vertical movement in the core column (Figure S20). Figure 5 shows that the sedaDNA demonstrates highly significant differentiation between strata indicating a lack of movement post deposition. Together, these tests indicate that authentic sedaDNA was retrieved and most likely represent the original depositional environment. Interestingly, the same stratigraphic tests applied to pollen generally show a lack of differentiation between strata, indicating both a consistent influx of pollen from the surrounding area from oak, hazel woodland and that the sedaDNA derived from sources other than pollen, as has been previously suggested in other sedimentary contexts [25]. This suggests a taphonomy in which the sedaDNA represents a local signal relative to a more regional palynological signal.
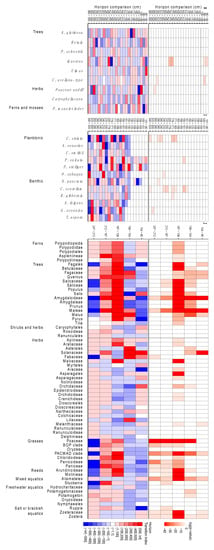
Figure 5. Assessment of taxon change between sample horizons of taxa with abundances >50, see Supplementary Information and SI Text S4.5 for methods. Top Panel—Probability of observed taxa counts between pairs of horizons being drawn from the same distribution. Middle Panel—Index of change between horizons based on changes in maximum likelihood estimators of the probability taxon being selected from each horizon. Blue indicates a decrease in probability moving up the core, red an increase. Bottom Panel—Palaeoenvironmental reconstructionwhere all measurements were taken from lithological units 1A-4 and below. A. Lithological units based on sediment types described in Supplementary Information, Figure S1 and Table S1. Panels B-G palaeoenvironmental proxy abundances, for detailed taxonomic break downs, see Supplementary Information, Table S12, Figures S16–S18 and S19B. Pollen counts. C. Diatom counts. D. Ostracod abundance E. Foramifera abundance. Foraminifera and ostracods are recorded: o—one specimen; x—several specimens; xx—common; xxx—abundant. F. Mollusc counts. G. Plant sedaDNA vegetation type with icon size relative to biogenomic mass.
The environment prior to this dramatic event, and recorded in the underlying stratum Unit 1A-7, was an estuarine mudflat typified by predominantly benthic epiphytic and epipelic diatom communities and brackish foraminifera and ostracods, with a sedaDNA floral profile of Zostera and Potamogeton as well as members of the Hydrocharitaceae and Araceae present. This was surrounded by an area with a strong meadow influence that is also apparent in the sedaDNA profile including buttercups, orchids, mallows and asterids. Further, an open woodland is suggested close by, Figure S20.
By contrast the underlying unit 1A-6 is characterized by an abrupt change in both microfossil and sedaDNA evidence. There is an absence of diatoms and pollen; an increase in outer estuarine or marine taxa of ostracods and foraminifera; the appearance of fractured molluscan shells from different and incompatible habitats including sublittoral, intertidal and brackish species; and the sudden and significant influx of all woody taxa in the sedaDNA profile (Figures S16 and S20 and Table S12). A novel measure of relative biomass, biogenomic mass, based on sedaDNA and genome size (Figure S20), suggests a higher biomass of trees than either Zostera or Potamogeton in this stratum, although these latter taxa dominate in other strata, Figure 5 (Figure S20). Together, these proxies indicate a violent event that brought with it the terrestrially derived debris of surrounding woodland.
After the event in units 1A-4 to 1A-1 the foraminifera and ostracod signal indicate a return to estuarine mudflats with a greater abundance of marine taxa such as Ammonia batavus indicating a more established marine signal than prior to the event, Table S12. The sedaDNA signal also indicates estuarine taxa such as Zostera, and a meadow influence, although the biogenomic mass appears greatly reduced suggesting more distant proximity of the flora. A faunal signal considerably weaker than the floral was present throughout the core, but shows a significant elevation in count towards the top units (p = 1.0014 × 10⁻⁶), indicating the presence of rodents and larger animals such as bear, boar and cloven hoofed ruminants, as well as higher orders of fish (Acanthomorpha, Eupercaria, Osteoglossocephalai), Figure S21.
4.5. Dating of Deposit
The depositional ages of the sequence in ELF001A was investigated using OSL (Figure 3B, SI Text 3.1) and directed AMS radiocarbon dating (SI Text 3.2). Luminescence stratigraphies generated for the core, with proxies of net OSL signal intensities and depletion indices (Figure 3B, columns 1 and 2) and OSL stored dose and sensitivity (Figure 3B, columns 3 and 4), contextualize depositional ages determined by quartz SAR OSL for units 1a-4 to 1a-7. Units 1A-6 and 1A-5 are dated by quartz SAR OSL to 8.04 ± 0.43 ka and 8.22 ± 0.43 ka, respectively, with a combined age of 8.14 ± 0.29 ka. The base of unit 1a-4 at 105 cm depth in core is dated to 7.16 ± 0.50 ka, and at 1.00m depth to 6.03 ± 0.22 ka.
Lithological units 1a-1 to 1a-7 are characterized by distinct luminescence behaviour described here from oldest to youngest. Unit 1a-7 is sub-divided into two further units, from 1.51 m to c. 2.00 m and deeper than 2.00 m. From 1.51 m to 2.00 m, the proxies show stratigraphic trends with depth indicating a more gradual accumulation than from c. 2.00 m to the base of the core where the proxies fluctuate around central tendencies marked by more rapid accumulation. Units 1a-5 and 1a-6 show a cyclicity with ‘couplets’ characterized by paired zones with low OSL intensities/high depletion indices and higher OSL intensities/low depletion indices. Within this unit inclusions of shell fragments were dated to 9.26-8.93 ka cal BP (at 95.4%; 8.34 ± 0.3 ka BP, Beta-505683) by radiocarbon AMS dating.
Unit 1a-4, shows a step-change in OSL intensities and stored doses across the 1a-4/1a-3 boundary demonstrating a change in depositional dynamics, and further that the quartz here was likely sourced from a different provenance. Units 1a-2 to 1a-3 show a normal signal-depth progression in these proxies resulting from gradual accumulation with no temporal breaks. Finally, Unit 1a-1 is characterized by fluctuating OSL intensities and variable OSL stored doses with no stratigraphic coherence showing these sands are derived from a highly mobile sequence.