|
|
Post by Admin on May 22, 2023 18:13:09 GMT
Fig. 1: Proposed conceptual models of early human history in Africa. 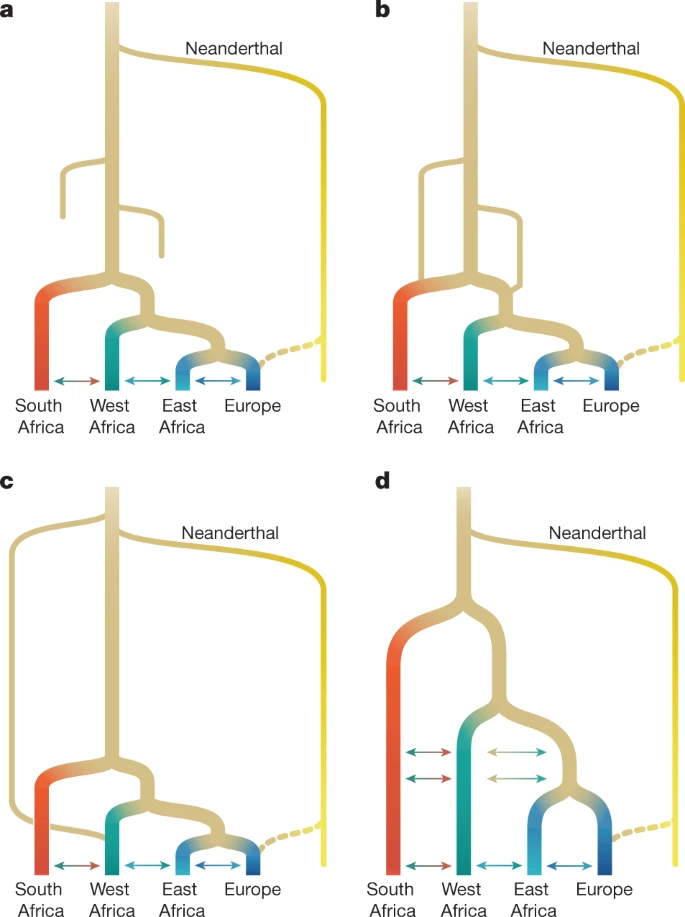 a, Recent expansion. b, Recent expansion with regional persistence. c, Archaic admixture. d, African multiregional. The models have been designed to translate models from the palaeoanthropological literature into genetically testable demographic models (ref. 1 and Supplementary Information section 3). These parameters were then fitted to genetic data. Fig. 2: Genetic diversity across Africa. 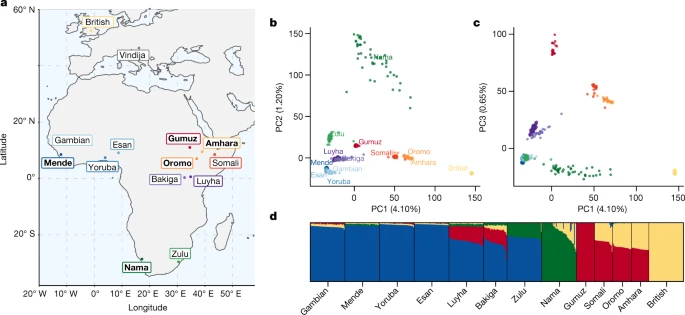 a, Selected populations from the 1000 Genomes Project and the African Diversity Reference Panel18,20 illustrate diversity from western, eastern and southern Africa. We chose representative ethnic groups from each region (bold labels) to build parameterized models, including the newly genetically sequenced Nama populations from South Africa, Mende from Sierra Leone, Gumuz, Oromo and Amhara from Ethiopia, British individuals and a Neanderthal from Vindija Cave, Croatia. b,c, Principal component analysis highlights the range of genetic divergence anchored by western African, Nama, Gumuz and British individuals between principal components (PC) 1 and 2 (b), and 1 and 3 (c). Percentages show variance explained by each principal component. Colours represent the groups shown in bold in a. d, ADMIXTURE analysis using K = 4 principal components reveals signatures of recent gene flow in Africa that reflect colonial-period migration into the Nama, back-to-Africa gene flow among some Ethiopians, and Khoe-San admixture in the Zulu population. We therefore aim to discriminate between a broader set of demographic models by studying the genomes of contemporary populations. We take as our starting point four models (single-population expansion, single-population expansion with regional persistence, archaic hominin admixture and multi-regional evolution; Fig. 1) using 290 genomes of individuals from southern, eastern and western Africa, as well as Eurasia. By including geographically and genetically diverse populations across Africa, we infer demographic models that explain more features of genetic diversity in more populations than previously reported. These analyses confirm the inadequacy of tree-like models and provide an opportunity to directly evaluate a wide range of alternative models. We inferred detailed demographic histories using 4x–8x whole-genome sequencing data for four diverse African populations, comprising the Nama (Khoe-San from South Africa, newly presented here; see Supplementary Information section 1.2 for ethical and practical aspects of participant recruitment), the Mende (from Sierra Leone; from phase 3 of the 1000 Genomes Project18), the Gumuz (recent descendants of a hunter-gatherer group from Ethiopia20,21) and eastern African agriculturalists (Amhara and Oromo from Ethiopia20). The Amhara and Oromo populations, despite speaking distinct Afro-Asiatic languages, are highly genetically similar21,22 so we combined the two groups for a larger sample size (Fig. 2). We also included British individuals from the 1000 Genomes Project in our demographic models as a representative source of back-to-Africa gene flow and recent colonial admixture in South Africa. Finally, we used a high-coverage ancient Neanderthal genome from Vindija Cave in Croatia23 to account for gene flow from Neanderthals into people from outside Africa, and gauge the relative time depth of divergence, assuming that Neanderthals diverged 550 ka from a common stem. We computed one- and two-locus statistics for which the expectation within and across populations can be computed efficiently and that are well suited for both low- and high-coverage genomes2,24. Using a maximum-likelihood inference framework, we then fitted to these statistics a family of parameterized demographic models that involve population splits, size changes, continuous and variable migration rates and punctuated admixture events, to learn about the nature of the population structure over the past million years. |
|
|
|
Post by Admin on May 23, 2023 18:10:45 GMT
Fig. 2: Genetic diversity across Africa.  a, Selected populations from the 1000 Genomes Project and the African Diversity Reference Panel18,20 illustrate diversity from western, eastern and southern Africa. We chose representative ethnic groups from each region (bold labels) to build parameterized models, including the newly genetically sequenced Nama populations from South Africa, Mende from Sierra Leone, Gumuz, Oromo and Amhara from Ethiopia, British individuals and a Neanderthal from Vindija Cave, Croatia. b,c, Principal component analysis highlights the range of genetic divergence anchored by western African, Nama, Gumuz and British individuals between principal components (PC) 1 and 2 (b), and 1 and 3 (c). Percentages show variance explained by each principal component. Colours represent the groups shown in bold in a. d, ADMIXTURE analysis using K = 4 principal components reveals signatures of recent gene flow in Africa that reflect colonial-period migration into the Nama, back-to-Africa gene flow among some Ethiopians, and Khoe-San admixture in the Zulu population. We therefore aim to discriminate between a broader set of demographic models by studying the genomes of contemporary populations. We take as our starting point four models (single-population expansion, single-population expansion with regional persistence, archaic hominin admixture and multi-regional evolution; Fig. 1) using 290 genomes of individuals from southern, eastern and western Africa, as well as Eurasia. By including geographically and genetically diverse populations across Africa, we infer demographic models that explain more features of genetic diversity in more populations than previously reported. These analyses confirm the inadequacy of tree-like models and provide an opportunity to directly evaluate a wide range of alternative models. We inferred detailed demographic histories using 4x–8x whole-genome sequencing data for four diverse African populations, comprising the Nama (Khoe-San from South Africa, newly presented here; see Supplementary Information section 1.2 for ethical and practical aspects of participant recruitment), the Mende (from Sierra Leone; from phase 3 of the 1000 Genomes Project18), the Gumuz (recent descendants of a hunter-gatherer group from Ethiopia20,21) and eastern African agriculturalists (Amhara and Oromo from Ethiopia20). The Amhara and Oromo populations, despite speaking distinct Afro-Asiatic languages, are highly genetically similar21,22 so we combined the two groups for a larger sample size (Fig. 2). We also included British individuals from the 1000 Genomes Project in our demographic models as a representative source of back-to-Africa gene flow and recent colonial admixture in South Africa. Finally, we used a high-coverage ancient Neanderthal genome from Vindija Cave in Croatia23 to account for gene flow from Neanderthals into people from outside Africa, and gauge the relative time depth of divergence, assuming that Neanderthals diverged 550 ka from a common stem. We computed one- and two-locus statistics for which the expectation within and across populations can be computed efficiently and that are well suited for both low- and high-coverage genomes2,24. Using a maximum-likelihood inference framework, we then fitted to these statistics a family of parameterized demographic models that involve population splits, size changes, continuous and variable migration rates and punctuated admixture events, to learn about the nature of the population structure over the past million years. A Late Pleistocene common ancestry We started with a model of geographical expansion from a single ancestral, unstructured source followed by migration between populations, without allowing for a contribution from an African archaic hominin lineage (Fig. 1a) or population structure before the expansion (Fig. 1d). As expected2, this first model was a poor fit to the data qualitatively (Supplementary Fig. 10) and quantitatively (log-likelihood (LL) ≈ −189,300; Supplementary Table 3). We next explored a suite of parameterized models in which population structure predates the differentiation of contemporary groups (Supplementary Information section 3). Depending on the parameters, these encompassed models allowing for ancestral reticulation, such as fragmentation-and-coalescence or meta-population models (Fig. 1b), archaic hominin admixture (Fig. 1c) and African multi-regionalism (Fig. 1d). The recent expansion and the African multi-regional models (Fig. 1a,d) have the same topology, so interpretation of the model depends on the specified or inferred divergence times. Regardless of the model choice for early epochs, maximum-likelihood inference of human demographic history for the past 150 kyr was remarkably robust. In a reticulated model, we use ‘divergence’ between populations to mean the time of their most recent shared ancestry. The earliest divergence among contemporary human populations differentiates the southern African Nama population from the other African groups at 110−135 ka, with low to moderate levels of subsequent gene flow (Table 1). In none of the high-likelihood models that we explored was the divergence between Nama and other populations earlier than around 140 ka. We conclude that geographical patterns of contemporary H. sapiens population structure probably arose during MIS 5. Although we do find evidence for earlier population structure in Africa, contemporary populations cannot be easily mapped onto the more ancient ‘stem’ groups because only a small proportion of drift between contemporary populations can be attributed to drift between stems (Fig. 4, Supplementary Information section 5.2 and Supplementary Figs. 16–19). |
|
|
|
Post by Admin on May 24, 2023 18:10:31 GMT
Given this consistency in inferred recent history and the numerical challenge of optimizing a large number of parameters, we fixed several parameters related to recent population history to focus on more-ancient events (Supplementary Information section 3.1). These parameters were ones supported by multiple genetic and archaeological studies25. Fixed parameters included the time of divergence between western and eastern African populations, set to 60 ka, just before the split of Eurasians and East Africans at 50 ka. We also fixed the amount of admixture from Neanderthals to the European population directly after the out-of-Africa migration to 1.5% at 45 ka. We quantify the migration rates of populations after their divergence at around 120 ka. Before the agropastoralist expansion 5 ka, migration between the ancestors of the Nama and other groups is an order of magnitude weaker than that observed between western and eastern Africans (Table 1). All models infer relatively high gene flow between eastern and western Africa (m ≈ 2 × 10⁻⁴, the constant proportion of migrant lineages per generation since their divergence 60 ka). We further find that back-to-Africa gene flow at the beginning of the Holocene epoch primarily affected the ancestors of the Ethiopian agricultural populations26, comprising almost 65% of their genetic ancestry. We observe considerable gene flow from the Amhara and Oromo into the Nama, a signal that is probably a proxy for the movement of eastern African caprid (goat) and cattle pastoralists27,28, here estimated to constitute a 25% ancestry contribution 2 ka. Although this gene flow is not apparent from the ADMIXTURE plot (Fig. 2), the ancestry is probably grouped into the Khoe-San component, which has drifted appreciably from its ancestral eastern African source. Colonial-period admixture from Europeans into the Nama was estimated at 15%, similar to proportions suggested by ADMIXTURE (Fig. 2). A weakly structured stem within Africa To account for the population structure before 135 ka, three of our four models allowed for two or more stem populations, which could diverge either before or after the split from the Neanderthals. We considered models both with and without migration between these stem populations, and in both cases we tested two different types of gene flow during the expansion phase, as illustrated in Supplementary Fig. 6: in the first, one of the stem population expands (splits into contemporary populations), followed by continuous symmetric migration with the other stem population(s); in the second, one or more of the stem populations expands, with instantaneous ‘pulse’ (merger) events from the other stem population, so that recent populations are formed by mergers of multiple ancestral populations. Depending on the parameter values, this scenario encompasses archaic hominin introgression and fragmentation-and-coalescence models (such as Fig. 1b,c). For many parameters, confidence intervals based on bootstrapping are relatively narrow (Supplementary Tables 3–7), reflecting an informative statistical approach. However, model assumptions have a greater effect on parameter estimates (and thus real uncertainty). To convey the uncertainty in the models, we highlight features of the two inferred models with high likelihoods. These are referred to as the multiple-merger and the continuous-migration models. Both allow for migration between stem branches, but differ primarily in the timing of the early divergence of stem populations and their relative effective population size (Ne) (Fig. 3). The two models also differ in the mode of divergence, with the multiple-merger model featuring a population reticulation (that is, loops in the population graph; Fig. 1b) during the Middle Pleistocene epoch (780 ka to 130 ka). Fig. 3: A weakly structured stem best describes two-locus statistics. 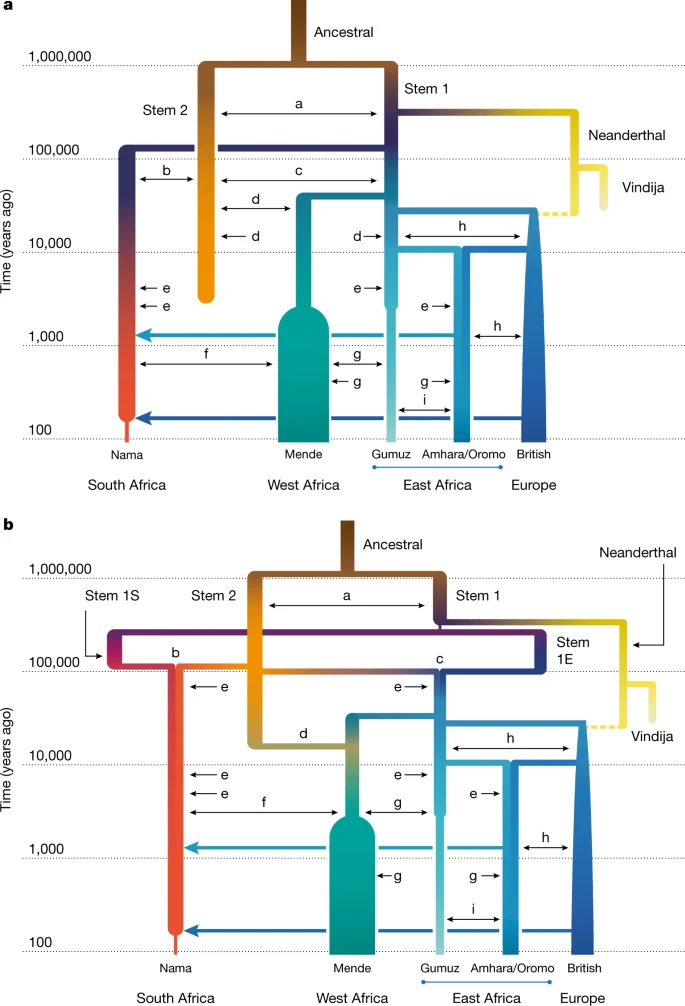 a,b, In the two best-fitting parameterizations of early population structure, continuous migration (a) and multiple mergers (b), models that include ongoing migration between stem populations outperform those in which stem populations are isolated. Most of the recent populations are also connected by continuous, reciprocal migration that is indicated by double-headed arrows (labels matched to migration rates and divergence times in Table 1). These migrations last for the duration of the coexistence of contemporaneous populations with constant migration rates over those intervals. The merger-with-stem-migration model (b, with LL = −101,600) outperformed the continuous-migration model (a, with LL = −115,300). Colours are used to distinguish overlapping branches. The letters a–i represent continuous migration between pairs of populations, as described in Table 1. |
|
|
|
Post by Admin on May 25, 2023 17:25:11 GMT
Allowing for continuous migration between the stem populations substantially improves the fits relative to zero migration between stems (LL ≈ −101,600 compared with −107,700 in the merger model, Supplementary Tables 6 and 7; and LL ≈ −115,300 versus −126,500 in the continuous migration model, Supplementary Tables 4 and 5). With continuous migration between stems, population structure extends back to more than 1 million years ago (Table 1). Migration between the stems in these models is moderate, with a fraction of migrant lineages (m) in each generation estimated as m = 6.3 × 10⁻⁵–1.3 × 10⁻⁴. For comparison, this is similar to the inferred migration rates between connected contemporary populations over the past 50 ka (Table 1). This ongoing (or at least, periodic) gene flow qualitatively distinguishes these models from previously proposed archaic hominin admixture models (Fig. 1c), as the early branches remain closely related and each branch contributes large amounts to all contemporary populations (Fig. 4). Because of this relatedness, only 1–4% of genetic differentiation among contemporary populations can be traced back to this early population structure (Supplementary Information section 5.2). Fig. 4: Structure among stems is weak and present-day structure is generally recent. 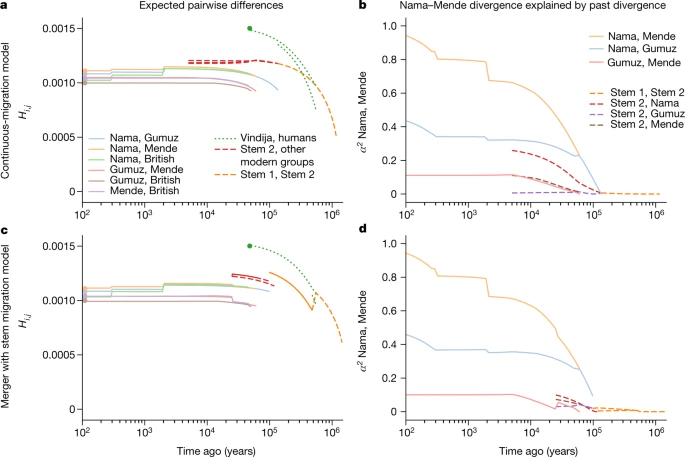 a–d, From the best-fit models of our two parameterizations (a,b, continuous migration; c,d, merger with stem migration), we predicted differentiation and shared drift between populations at past time points. a,c, We computed expected pairwise differences Hi,j between individuals sampled from populations i and j existing at time t. b,d, To understand how drift between stems explains contemporary structure, we computed the proportion α2 of drift between pairs of sampled contemporary populations (here the Nama and Mende) that aligns with drift between past populations (see Supplementary Information section 5.2 for details and additional comparisons in Supplementary Figs. 16–19). Both models infer deep population structure with modest contributions to contemporary genetic differentiation. Most present-day differentiation dates back to the past 100 kyr. Under the continuous-migration model, one of the two stems (stem 1) diverges into lineages leading to contemporary populations in western, southern and eastern Africa, and the other (stem 2) contributes variable ancestry to those populations. This migration from stem 2 is highest with the Mende (m = 1.6 × 10⁻⁴) compared with the Nama and populations from eastern Africa (m = 5.9 × 10⁻⁵ and 3.1 × 10⁻⁵, respectively), with migration allowed to occur until 5 ka. A sampled lineage from the Nama, Mende and Gumuz have probabilities of being in stem 2 at the time of stem 1 expansion (135 ka) of approximately 0.145, 0.20 and 0.130, respectively, although these probabilities change over time, precluding the notion of a fixed admixture proportion. By contrast, in the multiple-merger model, stem populations merge with varying proportions to form the different contemporary groups. We observe a sharp bottleneck in stem 1 down to Ne = 100 after the split of the Neanderthal branch. This represents the lower bound allowed in our optimization (an Ne of 100), although the size of this bottleneck is poorly constrained (95% confidence interval 100–851). After a long period of exchange with stem 2, stem 1 then fractures into stem 1E and stem 1S at 478 ka. The timing of this divergence was also poorly constrained (95% confidence interval 276– 478 ka). These populations evolve independently until 119 ka (101−125 ka) when stem 1S and stem 2 combine to form the ancestors of the Nama, with proportions of 30% and 70%, respectively. Similarly, stem 1E and stem 2 combine in equal proportions (50% each) to form the ancestors of the western and eastern Africans (and thus also all individuals who later disperse during the out-of-Africa event). Finally, the Mende receive a large additional pulse of gene flow from stem 2, replacing 19% (18–21%) of their population 25 ka (22−26 ka). The later stem 2 contribution to the western African Mende resulted in better model fits (∆LL ≈ 60,000). This may indicate that an ancestral stem 2 population occupied western or central Africa, broadly speaking. The differing proportions in the Nama and eastern Africans may also indicate a geographical separation of stem 1S in southern Africa and stem 1E in eastern Africa. To assess the robustness of the inferred models to analysis and reference population choices, Supplementary Information sections 6 and 7 include reanalyses with changes in the European and West African populations, as well as the recombination maps, filtering strategies and parameter optimization strategies. Although we find some differences in the inferred parameters (see Supplementary Information sections 7.1.1 and 7.2), the best-fit models across all reanalyses are quantitatively consistent. |
|
|
|
Post by Admin on May 26, 2023 18:03:54 GMT
Reconciling lines of genetic evidence Previous studies have found support for archaic hominin admixture in Africa using two-locus statistics2,17, conditional site frequency spectra (cSFS)7 and the reconstruction of gene genealogies16. However, none of these studies considered a weakly structured stem. We validated our inferred models with additional independent approaches. We find that the observed cSFS (conditional on the derived allele being carried in the Neanderthal sample) is well described by the merger model (Fig. 5a–c and Supplementary Figs. 20–23), even though this statistic was not used in the fit. Our best-fit models outperform archaic hominin admixture models fitted directly to the cSFS (for example, compare with figure 1 in ref. 7). Specifically, it is the addition of migration between stems that results in a qualitative improvement of the agreement (compare Supplementary Figs. 22 and 23). Fig. 5: Model validation using independent statistics. 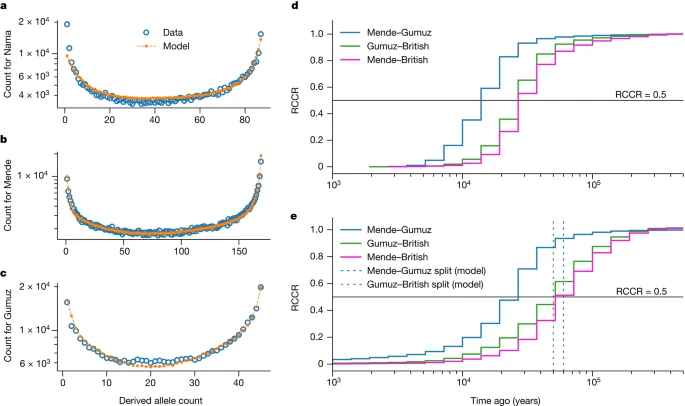 a–c, Using our best-fit models, we simulated expected cSFS and compared the simulated spectra to those observed from the data. Our inferred models provide a good fit to the data, even though this summary was not used in our inference. Across the three populations (a, Nama; b, Mende; c, Gumuz), ancestral-state misidentification was consistently inferred to be 1.5−1.7% for intergenic loci (Supplementary Information section 6.2.2). d,e, We used Relate16 to reconstruct genome-wide genealogies, which we used to estimate coalescence-rate trajectories and cross-coalescence rates between pairs of populations. Although coalescence-rate distributions are informative about past evolutionary processes, interpretation can be hindered by migration and population structure, and translating RCCR curves into population divergence times is especially prone to misinterpretation. d, Real data; e, our model. In our model, the Mende–Gumuz split occurs before the Gumuz–British split. However, the model also predicts a recent elevated Mende–Gumuz RCCR. This pattern, also observed in the data, does not indicate that the Mende and Gumuz split more recently than the Gumuz and British populations. We used the software Relate16 to infer the distribution in the coalescence rates over time in both real data and data simulated from our inferred models. Many previous studies have found a reduction of coalescence rates between 1 million years ago and 100 ka in humans and thus inferred an increase in Ne during the same period29. This increase in inferred Ne could be attributable to either an increase in population size or to ancestral population structure during the Middle Pleistocene30. All the models, including the single-origin model, recapitulate an inferred ancestral increase in Ne between 100 ka and 1 million years ago (Supplementary Fig. 26 and Supplementary Information section 7.3.2). The single-origin model achieves this by an increase in Ne during that period, whereas the best-fit models recapitulate this pattern without corresponding changes in population size. Relative cross-coalescence rates (RCCRs) have recently been used to estimate divergence between pairs of populations, as measured by the rate of coalescence between two groups divided by the mean within population coalescence. Simulations of RCCR accuracy, however, focus on a clean split between populations, whereby groups diverge without subsequent gene flow. Published estimates25 of the earliest human divergences with RCCR, which range from 150 ka to 100 ka, may be substantially biased when compared with more-complex models with gene flow as inferred here. We find that midpoint estimates of RCCR are poor estimates for population divergence, often underestimating divergence time by 50% or more (for example, Mende versus Gumuz is about 15 ka compared with a true divergence of 60 ka), and recent migration can lead to the misordering of divergence events (Fig. 5e). We suggest that RCCR analyses that do not fit multiple parameters, including gene flow, should be interpreted with caution. Other studies1,25 have fitted tree-like demographic models to African populations using distributions of allele frequencies or related statistics, finding inconsistent divergence times, some of which are older than those we find here. In Supplementary Information section 7.4, we show that this discrepancy can be explained by model misspecification: if divergence is estimated by using an isolation with migration model with constant population sizes, but the correct model has ancient population growth or population structure, the divergence time in the inferred model is much earlier than in the correct model. Intuitively, growth or structure in the ancestral population will each increase coalescence times relative to a randomly mating population of constant size, so a model that assumes constant population sizes would require an older divergence time to fit the observed distribution of coalescence times and related statistics31,32. |
|


