|
|
Post by Admin on Apr 5, 2018 18:42:47 GMT
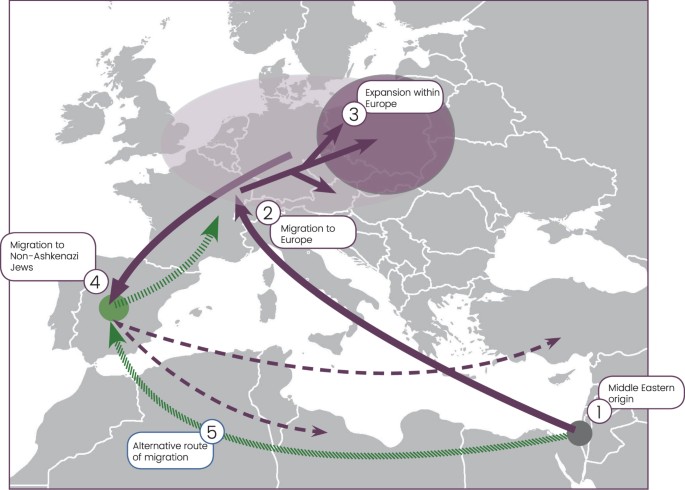
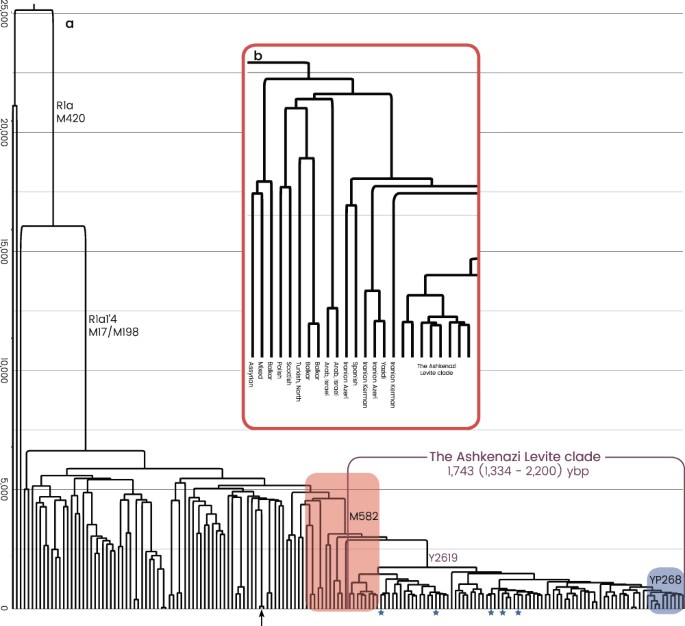
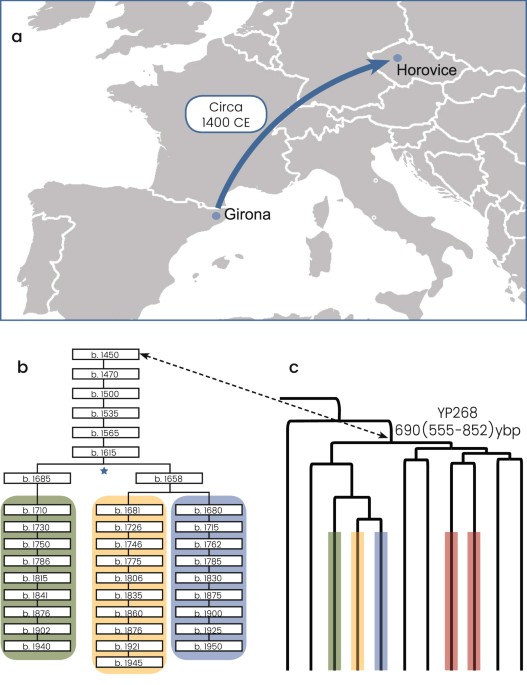
 Figure 1 The Ashkenazi Levite phylogenetic branch All R1a-M582 Y chromosomes sampled from Ashkenazi Levites, non-Ashkenazi Levites, Ashkenazi non-Levites, and non-Jews with known or suspected Ashkenazi origin established a well-defined phylogenetic branch nested within haplogroup R1a-M582 and demonstrated a star-like expansion pattern (Fig. 2 and Supplemental Figure S1). The root of this branch is defined by a total of six polymorphic sites and designated according to one of the positions, R1a-Y2619 (g.6733896A>G) coalescing 1,743 (1,334–2,200) ybp (Table 1). The five non-Ashkenazi Levites and the single Iraqi Jew did not establish a distinct phylogenetic cluster but scattered within the Ashkenazi Levite samples. The sister clades of R1a-Y2619 within R1a-M582, coalescing ~3,143 (2,620–3,682) ybp, were sampled in Iranian Azeris, a Kerman, a Yazidi and one sample from Iberia. Further, the phylogeny demonstrates a rich diversity of R1a samples distributed throughout the Middle East, Anatolia, Caucasus and the Indian sub-continent, whereas East European branches represent an early split within R1a. We then explored the allocation of the Horowitz Levite samples included in the phylogeny. First, the six tested Horowitz Levites were grouped into the Y chromosome haplogroup R1a-Y2619, allowing a unique glimpse into medieval Europe (Fig. 3a). The genealogic records for three of the individuals with the Horowitz surname converged to a common male ancestor born at 1615 CE or 402 ybp (Fig. 3b). The observed sequence variation between these three samples is consistent with this proposed genealogy (Fig. 3c), and accordingly, their genealogical claim could not be refuted. This prompted us to use this node as an internal calibration point. The two additional individuals affiliating with the Horowitz dynasty formed the closest paraphyletic clade R1a-YP268 to the described three sample cluster, coalescing with them 691 (555–852) ybp (Fig. 3c). The sixth sample carrying the Horowitz surname but claiming no ancestral relations with the Horowitz dynasty did not cluster with these five samples (Supplemental Figure S1).  Figure 2 The proposed Middle Eastern origin of the Ashkenazi Levite lineage based on what was previously a relatively limited number of reported samples20, can now be considered firmly validated. While the highest frequencies of haplogroup R1a are found in Eastern Europe18,28, our data revealed a rich variation of haplogroup R1a outside of Europe which is phylogenetically separate from the typically European R1a branches. Evidently, R1a-Y2619 is well nested within a plethora of phylogenetically close Middle Eastern sister-clades, sampled in Iranian Azeris, a Kerman, a Yazidi and one man from Iberia. This provides the needed evidence for its origin (Fig. 2 and Supplemental Figure S1). However, the exact migration pathway of R1a-Y2619 to Europe remains elusive. Most historical records suggest two major routes of Jewish migration to Europe (Fig. 1)29,30. Ashkenazi Jewry is considered to have been founded as the result of Jewish migration via Italy to the Rhine Valley, and then Poland. Sephardic (Spanish) Jews are considered to have migrated along with the gradual Islamic expansion to North Africa and then Spain14. Because R1a-Y2619 is of Middle Eastern origin, it is possible that its introduction to Europe was by either, or both, of these routes. Naturally, the strong founding event for R1a-Y2619 among Ashkenazi Jews, coupled with the presence of all known branches of R1a-Y2619 in Ashkenazi Jews, tempts to infer that its migration route from the Levant was directly related to the Ashkenazi founders. However, these facts might merely reflect an expansion within Ashkenazi Jews rather than a proof of first arrival of the R1a-Y2619 with or into the Ashkenazi population. More confusing is the fact that genealogical records of the Horowitz rabbinical dynasty, now shown to carry the R1a-Y2619 Y chromosome, suggest their presence in the Iberian Peninsula in the 15th century and probably earlier (Fig. 3)17. In fact, repeated Jewish migrations that might have carried R1a-Y2619 Y chromosomes to Catalonia are documented since the 4th century and during the Muslim expansion to Iberia31. Additionally, because Catalonia was again Christian territory since 800 CE, proto-Horowitz R1a-Y2619 ancestors could also represent migration of Ashkenazi Jews to Iberia. Accordingly, the presence of R1a-Y2619 in Spain in the 15th century could not establish proof for the first arrival of the R1a-Y2619 lineage to the Iberian Peninsula, as this could simply reflect repeated and unrecorded movements of Jews back and forth between Eastern and Western Europe and the Iberian Peninsula. Previous evidences from mtDNA and autosomal markers have already suggested a likely gene flow between Ashkenazi and Sephardic Jews within Europe32,33,34. Taken together, our results tend to favor a single route of entry to Europe as part of the Ashkenazi migration and expansion in Europe. Because the coalescence time of all contemporary R1a-Y2619 Levites is ~1,743 ybp, well within the time of the Roman exile Diaspora, and each of the branches of R1a-Y2619 is found in Ashkenazi Jews, our results are inconsistent with a scenario of rapid expansion in the Levant followed by a spread via multiple routes to Europe. The results from the non-Ashkenazi R1a-Y2619 Levite samples also suggest single expansion route. Had the R1a-Y2619 Levite lineage already been as widely prevalent in the Levant, the non-Ashkenazi Levites would have been expected to split from the Ashkenazi Levite samples prior to the time of the Diaspora and to form a different cluster. However, the results show that the non-Ashkenazi Levites fall within multiple relatively recently coalescing sub-branches of R1a-Y2619 (Fig. 2 and Supplemental Figure S1). This pattern is more compatible with continuous gene flow from the Ashkenazi population to the non-Ashkenazi population during the Diaspora, rather than multiple routes of entrance for haplogroup R1a-Y2619 to Europe from the Levant. |
|
|
|
Post by Admin on Apr 6, 2018 18:35:44 GMT
 Figure 3 The Horowitz Levite pedigree. (a) The presumed migration route of the first named founder of the Horowitz pedigree from Girona to Horovice, circa 1400 CE, is shown. (b) A total of five individuals self-affiliated as descendants of the pedigree. Of these, three individuals supplied detailed written genealogies showing the ancestral relatedness among them. These three individuals are highlighted by the green, yellow and blue colors, and the noted birth years of their ancestors are noted. The node noted by the blue star symbol was used as an internal calibration point for the R1a phylogeny (Fig. 1). (c) The obtained YP268 clade phylogeny including all five Horowitz Y chromosomes is shown to coalesce 690 (555–852) ybp. The respective allocations of the three individuals comprising the written genealogies are noted by the same colors. The digits to the left of the branches denote the number of mutational events observed in each branch (Supplemental File 1). The two additional individuals are noted in red. The dashed double-headed arrow points to the YP268 node and the first named ancestor of Horowitz pedigree. Map data is from ©2017 Google Maps. Further support for a single migration route and subsequent expansion within Ashkenazi Jews, emanates from the observed patterns of expansion of additional Ashkenazi haplogroups. Accordingly, it is important to distinguish between an Ashkenazi Levite specific founding event for haplogroup R1a-Y2619 which could have been the result of a favorable socio-economic or other status, and a general expansion of Ashkenazi founding Y chromosome lineages, including R1a-Y2619 Ashkenazi Levites. For this purpose, we have studied a handful of other haplogroups previously described to be prevalent among Ashkenazi Jews19,24,35. Our results show that the expansion of R1a-Y2619 among Ashkenazi Jews is not specific or unique to this haplogroup. For example, the coalescence of haplogroup G-M377 (Supplemental Figure S4) and Q-M242 (Supplemental Figure S5), known to each represent 5% of the Ashkenazi paternal variation24, coalesce at ~1,223 ybp and ~1,672 ybp, respectively (Table 1). The Y chromosome strategy adopted herein allowed us to resolve haplogroup E lineages into its minute sub-branches (Supplemental Figure S3). The coalescence ages of haplogroup E-Z838, E- PF3780, E- B923 and E-B933, known to cumulatively represent 20% of the Ashkenazi paternal variation24, were estimated at ~1,200–1,600 ybp. This pattern of multiple founding events, not observed among Spanish Jews36 provides further support that the R1a-Y2619 Ashkenazi Levite ancestor entered Europe via the Ashkenazi route rather than via the Jewish expansion to the Iberian Peninsula. Other patterns are also clearly visible in the Ashkenazi Jewish paternal ancestry. Haplogroup T-M70, prevalent in the Middle East, is also present among Ashkenazi Jews (Supplemental Figure S6). The genotyped samples showed deeply rooted splits probably pointing to the preservation of an ancient diversity of this haplogroup in the Levant, dating back to Pleistocene. Meanwhile, the pattern observed for haplogroup R1b-M269 (Supplemental Figure S7), prevalent in Western Europe, primarily suggests repeated punctuated introgression of European Y chromosomes to the Ashkenazi community, and is compatible with previous reports36.  We further compared the most frequent founding lineage found among Ashkenazi Cohen males, nested within haplogroup J1a-P58, to the Ashkenazi Levite R1a-Y2619 lineage. Evidently, members of the R1a-Y2619 Levite caste and the J1a-P58 Cohen caste do not share a common male ancestor within the time frame of the Biblical narrative. As in the case of the Ashkenazi Levites, the Ashkenazi Cohen J1a-P58 lineage formed a tight cluster nested within a Middle Eastern set of samples confirming its origin, and was shared in our study only with non-Ashkenazi Cohens (Supplemental Figure S2). However, differently from the pattern obtained for R1a-Y2619 Ashkenazi Levites, the cluster coalesces ~2,570 ybp, thus pointing to the start of its expansion in the pre-Diaspora period. Extensive full Y chromosome sequences from larger number of Cohen samples from more Jewish communities on the background of other Levantine populations, including ascertainment of family and clan specific variants would be very informative in addressing the finding that Ashkenazi and non-Ashkenazi Cohen individuals share an overlapping distribution of lineages. In particular, the study of the most dominant Cohen lineage nested with the prevalent haplogroup J1-P58, along with expert historical input, might grant critical insight to the understanding of Hebrews in the Old World. Furthermore, ancient DNA studies of the Levant may offer direct information. Indeed, a recent study revealed the presence of both J1a-P58 and J2-M12 Y-chromosomes, frequent among contemporary Jews, in two Canaanite samples date to 3,700 ybp37. Scientific Reports 7, Article number: 14969 (2017) |
|
|
|
Post by Admin on Jun 12, 2018 18:44:01 GMT
 According to historical sources, the Hungarian tribal alliance conquered the eastern parts of the Carpathian Basin in 895 AD, and in successive campaigns occupied its central territories until 907 AD1. The mixed autochthonous population, which mostly spoke different Slavic, Turkic Avar, and German languages, integrated with variable speed with the newcomers, as we know from contemporaneous sources2. Whereas the Slavs lived mainly on the fringes, the successors of the Avars persisted in some inner territories of the Carpathian Basin. The Avars arrived in the Carpathian Basin in 568 AD, fleeing the westward-expanding influence of the Turkic Khaganate in Inner Asia3. The Avar population already included several folk elements at this time; and the population was uniform from neither a cultural nor a physical anthropological perspective. Over one hundred thousand excavated graves from the Avar period in the Carpathian Basin picture a heterogenic physical anthropological composition of this population, which contained mainly Europid characters and, only in certain regions and periods, was dominated by Asian craniometric indices4. The occupation policy of Avar and ancient Hungarian tribes were similar due to similar steppe-type husbandry and management of space and power. In the politically unified alliance of the Hungarian tribes, both the leader and the tributary folks influenced each other culturally. These interactions are easily seen from the changing material culture of the Hungarian conquerors, who began to use local types of jewels but also maintained steppe-like traditions during the 10th century5. It is difficult to estimate the size of the 10th–11th century population of the Carpathian Basin from ca. twenty-five thousand excavated graves5,6. Scholars estimate the Hungarian conqueror population in the Carpathian Basin between a few thousand and half a million, while the indigenous population size, which is also uncertain, is estimated at a few hundred thousand people7.  Historical sources give evidence of the mixed ethnic composition of the Hungarians before the conquest of the Carpathian Basin2,8. The diverse origin of the Hungarian tribes has also been documented in physical anthropological research. Craniometrical analyses revealed that the Europid crania type was predominant in the conquerors, with smaller amounts of Europo-Mongoloid characters9. Regional groups of the ancient Hungarian anthropological series show morphometric parallels ranging from the Crimean Peninsula to the Kazakh steppe10. The Finno-Ugric origin of the Hungarian language is well recorded by linguistic research, which lead to an assumption that there was a Uralic substrate of the ancient Hungarian population2. However, Turkic-speaking groups could also have had a significant role in the formation of the Hungarian people and political institutions, as suggested by ancient Turkic loanwords in the early layer of the Hungarian language and the Turkic origin of toponyms and person names of tribe leaders of the conquest-period11. After leaving the Central Uralic homeland, an obvious source of the Turkic influence was the Turkic-speaking political environment of the Bulgars (Onogurs) and Khazars in the 9th-century Eastern European steppe, where the Hungarians lived for a period of time. The exact route and chronology of the Hungarian migration between the Ural region and the Carpathian Basin is continually debated among archaeologists, linguists and historians.  Figure 1: Location of investigated sites in the Carpathian Basin. Reproduced hyper variable segment I (HVS-I) sequences were obtained from mtDNA of 111 individuals from the medieval Carpathian Basin: 31 mtDNA profiles from Avars, 76 from Hungarian conquerors and four from the southern Hungarian-Slavic contact zone (see Supplementary Table S3). The mtDNA of 111 individuals was extracted at least twice per individual from different skeletal elements (tooth and femur or other long bones, Supplementary Table S1), the HVS-I fragments were reproduced in subsequent PCR and sequencing reactions, at least twice per DNA extract. The sequence results of these replicates, spanning HVS-I nucleotide positions (np) 16040–16400, typing individual selections of 14 coding region positions and two fragments of the HVS-II (np 29–254) confirm the haplotypes to be authentic. Of the 144 processed samples, 33 had no amplifiable DNA yield, or the sequences gave ambiguous haplotype results. The Avar group from the southeastern Great Hungarian Plain (Alföld) had a mixed European-Asian haplogroup composition with four Asian haplogroups (C, M6, D4c1, F1b) at 15.3%, but a predominantly European (H, K, T, U), haplogroup composition (Fig. 2). In the conqueror population the most common Eurasian haplogroups were detected. West-Eurasian haplogroups (H, HV, I, J, K, N1a, R, T, U, V, X, W) were present at a frequency of 77%, and Central and East-Eurasian haplogroups (A, B, C, D, F, G, M) at 23%. The most widespread haplogroups of the conqueror population were H and U with frequencies 22% and 20% respectively (Supplementary Table S5). Five individuals from the 9th–10th centuries from the west Hungarian Vörs-Papkert site were excluded from any statistical analysis because of their offside geographical location and cultural differences from the Avar and Hungarian sites. Their mtDNA belonged to the common European J and H haplogroups, but with rare haplotype variants in ancient and modern mtDNA databases (see Supplementary Table S15 for database references). The number of typed mtDNA from the 10th–12th century contact zone metapopulation13 was enlarged by four 10th century samples from present-day north Croatia. One belonged to a characteristic European H10e haplotype; another belonged to U7 haplotype, mainly distributed in modern Southwest Asia and Southern Europe; a third belonged to the Southwest Asian N1b1 type; the fourth U5a2a haplotype was common in modern Eurasia (private database, see Material and Methods, Supplementary Table S15). |
|
|
|
Post by Admin on Jun 13, 2018 18:25:39 GMT
 Figure 2: Haplogroup frequencies of the populations under study. The principal component analyses (PCAs) of ancient and modern-day populations were computed based on haplogroup frequencies (Supplementary Tables S5 and S6). PCA of 21 ancient populations showed a predominant difference between European and Asian populations, which indicates a clustering of the medieval populations of Europe, as well as the assembly of Avars, conquerors and further Mediterranean populations (Fig. 3a, Supplementary Fig. S1). Although the East Asian medieval populations were clearly separated from the European contemporaneous period on both PCA and Ward clustering, prehistoric Central Asian (Kazakhstan) and North Asian (Siberian Late Bronze Age Baraba) populations showed similarities to the conquest-period dataset in both analyses (Fig. 3b). The three Carpathian Basin populations were compared with populations from most of the ancient North European and medieval Asian populations, showing significant differences in haplogroup composition (p < 0.05). On the other hand, prehistoric Central Asian, south central Siberian (Minusinsk Hollow) and Baraba populations were not significantly different from the populations of the Carpathian Basin, and these affinities are also reflected in the clustering tree (Supplementary Table S5, Fig. 3b). The PCA of the investigated ancient and modern Eurasian populations demonstrated the clustering of most modern European populations by PC1, PC2, and PC3. Furthermore, their affinities to modern Near Eastern populations are represented by PC1 and PC3, whereas the modern Asian populations are dispersed along PC1. The conqueror population has a similar haplogroup composition to modern Central Asians and Finno-Ugric populations, which is also supported by Ward type clustering. While Avars rather showed modern European connections, the contact zone population had a Near Eastern type haplogroup composition (Supplementary Figs S2 and S3).  Figure 3 (a) PCA plot of the first two components (32.9% of variance), comparing haplogroup frequencies of 21 ancient populations. (b) Ward type hierarchical clustering of 21 ancient populations. On the PCA plot the contribution of each mtDNA haplogroup is superimposed as grey component loading vector. PCA of 21 ancient populations shows a predominant difference between European and Asian populations along PC1 (variance = 21.8%), which furthermore shows a clustering of the medieval populations of Europe, as well as the assembly of Avars (HUN_AVAR), conquerors (HUN_CONQ), and other Mediterranean populations. Along the PC2 component (variance = 11.1%), the most distant population within the European sector is of the contact zone in the Carpathian Basin (CB_Contact_zones). Prehistoric Central Asian (Kazakhstan), south western Siberian (Baraba Late Bronze Age culture), and south central Siberian populations (abbreviations: KAZ_BRAge_IAge; SIB_BAR, MIN_BRAge) show similarities to the conquest-period datasets both on PCA (a) and the Ward clustering tree (b). P values in percent are given as red numbers on the dendogram, where red rectangles indicate clusters with significant p-values. The abbreviations and references are presented in Supplementary Table S5. The distance calculations based on high subhaplogroup resolution also showed that modern Central Asian populations were highly similar to the conqueror population. The maternal genetic connections of the Avar group concentrated on modern Eastern European populations, and the contact zone group showed Southwest Asian affinities on genetic distance maps (GDM) (Fig. 4a, Supplementary Figs S6A and S7A, see Supplementary Table S13 for references). |
|
|
|
Post by Admin on Jun 14, 2018 18:30:17 GMT
 Figure 4: Mapping of genetic distances counted from the Hungarian conqueror population. The haplogroup frequency-based test of population continuity (TPC)24 rejected neither the null hypothesis of population continuity between the Avars and the southeastern Alföld group of conquest-period Hungarians, nor between Avars and all conquerors analyzed from the Carpathian Basin. Furthermore, the haplogroup frequency differences between the 10th–12th century populations and modern Hungarians, and also Hungarian minorities of Szeklers and Csangos living in Romania can be explained by genetic drift that occurred during the last millennium (Supplementary Table S7). Pairwise genetic distances were calculated between 21 ancient and 52 modern populations. Interestingly, pairwise FST values of Avars indicated non-significant differences among nearly all medieval European populations, and from Central Asia, as well as from many modern-day Europeans. The Hungarian conqueror population showed the lowest distances from modern-day Uzbeks and Turkmens (FST = 0.00335 and 0.00489 respectively) and from six ancient populations: medieval Poles (FST = −0.00018), Bronze and Iron Age in present-day Kazakhstan (FST = −0.00164), Bronze Age along the south central Siberian flow of Yenisey River (Minusinsk Hollow) (FST = −0.00208), Siberian Baraba population (FST = −0.01003), Avars (FST = 0.00233), and 6th century Lombards from Hungary (FST value 0.00762), these values were non-significant (p > 0.05). The distances from the ancient populations were visualized on an FST level plot (Fig. 5). The mixed contact zone population has the shortest distances from present-day Iraq (FST = 0.00817), Italy (FST = 0.00923), Czechs (FST = 0.01023) and Avars (FST = 0.01094). For the genetic FST values and their corresponding p-values, see Supplementary Tables S8 and S9.  Figure 5: FST level plot and shared haplotype analysis with 21 ancient populations. In order to visualize these genetic distances, linearized Slatkin FST values were displayed on multi-dimensional scaling (MDS) plots (Fig. 6, Supplementary Fig. S5 and Tables S8 and S9). The plot of ancient populations reflects the PCA and shows the connection between the south western Siberian Baraba population17, south central Siberian Minusinsk Depression and Kazakhstani prehistoric populations14,16 and the conquerors. The Avar and contact zone populations show stronger affinities to the European medieval populations, similarly to the PCA results. On the modern population MDS plot, which also contains the three investigated medieval datasets, a very similar picture is observable to the modern PCA, except that the Southwest Asian populations do not separate from Europe along coordinate 2 (Supplementary Fig. S5). The sequence-based genetic distance maps, encompassing 141 modern populations, show congruently the Central Asian affinity to the conquerors, the European/Near Eastern characteristic populations to the Avar sequences, and predominant Near Eastern affinities to the contact zone group (Fig. 4b, Supplementary Figs S6B and S7B, see Supplementary Table S14 for references). |
|


