|
|
Post by Admin on Aug 22, 2020 21:27:28 GMT
287
288 While the Afanasievo-derived lineages are consistent with having largely disappeared
289 in Mongolia by the Late Bronze Age when our data showed that later groups with
290 Steppe pastoralist ancestry made an impact, we confirm and strengthen previous
291 ancient DNA analysis suggesting that the legacy of this expansion persisted in
292 western China into the Iron Age Shirenzigou culture (410-190 BCE)27. The only
293 parsimonious model for this group that fits according to our criteria is a 3-way
294 mixture of groups related to Mongolia_N_East, Russia_Afanasievo, WSHG. The only
295 other remotely plausible model (although not formally a good fit) also requires
296 Russia_Afanasievo as a source (Figure 3, Online Table 5). The findings of the original
297 study that reported evidence that the Afanasievo spread was the source of Steppe
298 ancestry in the Iron Age Shirenzigou have been questioned with the proposal of
299 alternative models that use ancient Kazakh Steppe Herders from the site of Botai,
300 Wusun, Saka and ancient Tibetans from the site of Mebrak15 in present-day Nepal as
301 major sources for Steppe and East Asian-related ancestry28. However, when we fit
302 these models with Russia_Afanasievo and Mongolian_East_N added to the outgroups,
303 the proposed models are rejected (P-values between 10-7and 10-2 ), except in a model
304 involving a single low coverage Saka individual from Kazakhstan as a source
305 (P=0.17, likely reflecting the limited power to reject models with this low coverage).
306 Repeating the modeling using other ancient Nepalese with very similar genetic
307 ancestry to that in Mebrak results in uniformly poor fits (Online Table 5). Thus,
308 ancestry typical of the Afanasievo culture and Mongolian Neolithic contributed to the
309 Shirenzigou individuals, supporting the theory that the Tocharian languages of the
310 Tarim Basin—from the second-oldest-known branch of the Indo-European language
311 family—spread eastward through the migration of Yamnaya steppe pastoralists to the
312 Altai Mountains and Mongolia in the guise of the Afansievo culture, from where they
313 spread further to Xinjiang5,7,8,27,29,30. These results are significant for theories of Indo
314 European language diversification, as they increase the evidence in favor of the
315 hypothesis the branch time of the second-oldest branch in the Indo-European language
316 tree occurred at the end of the fourth millennium BCE27,29,30.

317
318 The individuals from the ~5000 BCE Neolithic Boisman culture and the ~1000 BCE
319 Iron Age Yankovsky culture together with the previously published ~6000 BCE data
320 from Devil’s Gate cave19 are genetically very similar, documenting a continuous
321 presence of this ancestry profile in the Amur River Basin stretching back at least to
322 eight thousand years ago (Figure 2 and Figure S2). The genetic continuity is also
323 evident in the prevailing Y chromosomal haplogroup C2b-F1396 and mitochondrial
324 haplogroups D4 and C5 of the Boisman individuals, which are predominant lineages
325 in present-day Tungusic, Mongolic, and some Turkic-speakers. The Neolithic
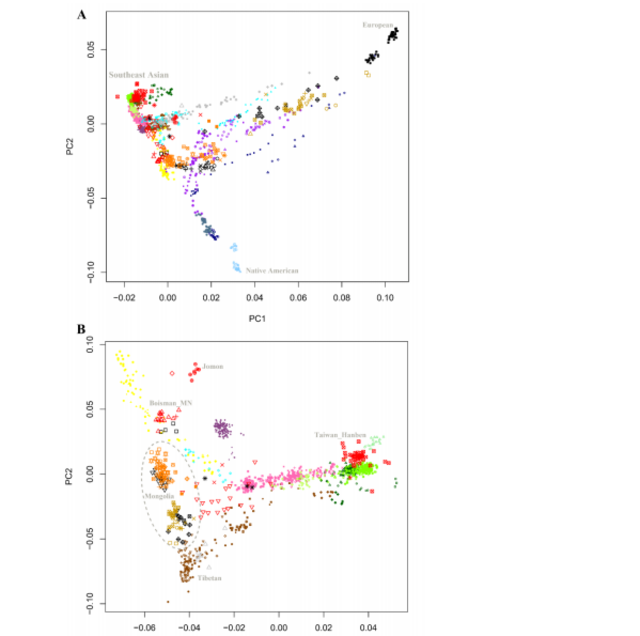
326 Boisman individuals shared an affinity with Jomon as suggested by their intermediate
327 positions between Mongolia_East_N and Jomon in the PCA and confirmed by the
328 significantly positive statistic f4 (Mongolia_East_N, Boisman; Mbuti, Jomon).
329 Statistics such as f4 (Native American, Mbuti; Test East Asian,
330 Boisman/Mongolia_East_N) show that Native Americans share more alleles with
331 Boisman and Mongolia_East_N than they do with the great majority of other East
332 Asians in our dataset (Table S5). It is unlikely that these statistics are explained by
333 back-flow from Native Americans since Boisman and other East Asians share alleles
334 at an equal rate with the ~24,000-year-old Ancient North Eurasian MA1 who was
335 from a population that contributed about 1/3 of all Native American ancestry31. A
336 plausible explanation for this observation is that the Boisman/Mongolia Neolithic
337 ancestry was linked (deeply) to the source of the East Asian-related ancestry in Native
338 ,31. We can also model published data from Neolithic and Early Bronze Age individuals
339 around Lake Baikal7 as sharing substantial ancestry (77-94%) with
340 the lineage represented by Mongolia_East_N, revealing that this type of ancestry was
341 once spread over a wide region spanning across Lake Baikal, eastern Mongolia, and
342 the Amur River Basin (Table S7). Some present-day populations around the Amur
343 River Basin harbor large fractions of ancestry consistent with deriving from more
344 southern East Asian populations related to Han Chinese (but not necessarily Han
345 themselves) in proportions of 13-50%. We can show that this admixture occurred at
346 least by the Early Medieval period because one Heishui_Mohe individual (I3358,
347 directly dated to 1050-1220 CE) is estimated to have harbored more than 50%
348 ancestry from Han or related groups (Table S8).
|
|
|
|
Post by Admin on Aug 23, 2020 7:10:05 GMT
349
350 The Tibetan Plateau, with an average elevation of more than 4,000 meters, is one of
351 the most extreme environments in which humans live. Archaeological evidence
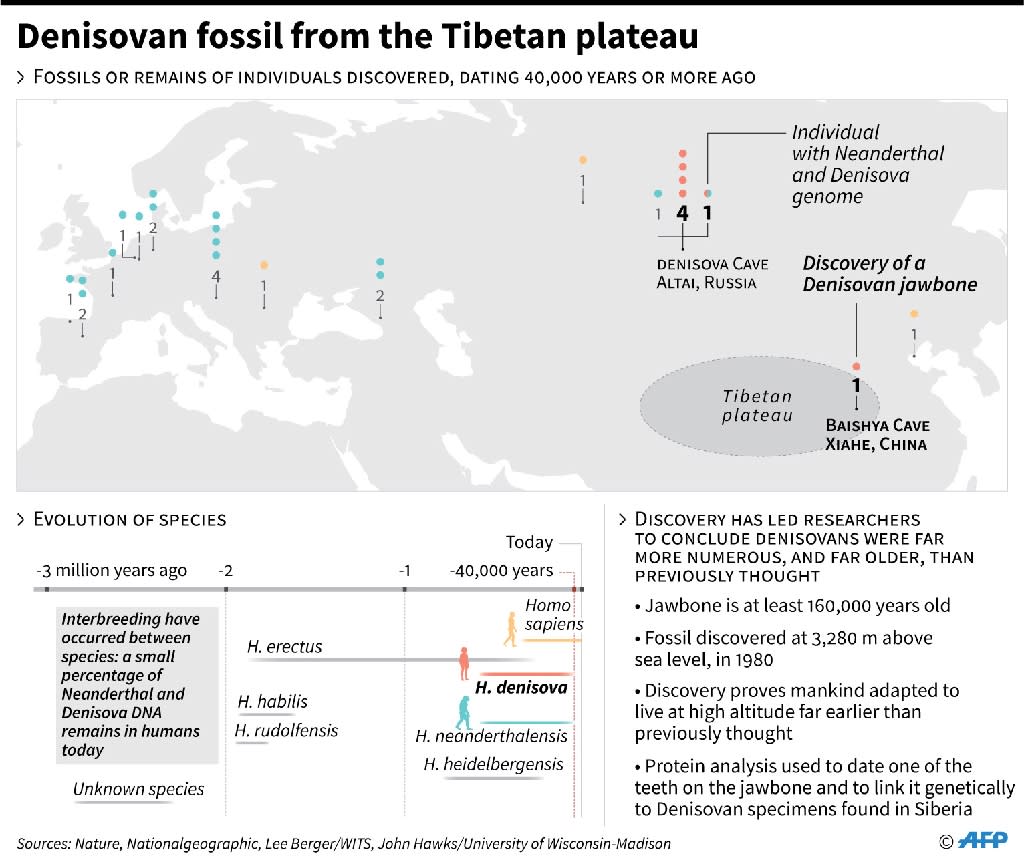
352 suggests two main phases for modern human peopling of the Tibetan Plateau. The
353 first can be traced back to at least ~160,000 years ago probably by Denisovans32
354 and then to 40,000-30,000 years ago as reflected in abundant blade tool assemblages.
355 However, it is only in the last ~3,600 years that there is evidence for continuous
356 permanent occupation of this region with the advent of agriculture34. We grouped 17
357 present-day populations from the highlands into three categories based on genetic
358 clustering patterns (Figure S3): “Core Tibetans” who are closely related to the ancient
359 Nepal individuals such as Chokopani with a minimal amount of admixture with
360 groups related to West Eurasians and lowland East Asians in the last dozens of
361 generations, “northern Tibetans” who are admixed between lineages related to Core
362 Tibetans and West Eurasians, and “Tibeto-Yi Corridor” populations (the eastern edge
363 of the Tibetan Plateau connecting the highlands to the lowlands) that includes not just
364 Tibetan speakers but also Qiang and Lolo-Burmese speakers who we estimate using
365 qpAdm4,35 have 30-70% Southeast Asian Cluster-related ancestry (Table S9). We
366 computed f3 (Mbuti; Core Tibetan, non-Tibetan East Asian) to search for non-Tibetans
367 that share the most genetic drift with Tibetans. Neolithic Wuzhuangguoliang, Han and
368 Qiang appear at the top of the list (Table S10), suggesting that Tibetans harbor
369 ancestry from a population closely related to Wuzhuangguoliang that also contributed
370 more to Qiang and Han than to other present-day East Asian groups. We estimate that
371 the mixture occurred 60-80 generations ago (2240-1680 years ago assuming 28 years
372 per generation36 under a model of a single pulse of admixture (Table S11). This
373 represents an average date and so only provides a lower bound on when these two
374 populations began to mix; the start of their period of admixture could plausibly be as
375 old as the ~3,600-year-old date for the spread of agriculture onto the Tibetan plateau.
376 These findings are therefore consistent with archaeological evidence that expansions
377 of farmers from the Upper and Middle Yellow River Basin influenced populations of
378 the Tibetan Plateau from the Neolithic to the Bronze Age as they spread across the
379 China Central plain37,38, and with Y chromosome evidence that the shared common
380 haplogroup Oα-F5 between Han and Tibetans coalesced to a common ancestry less
381 than 5,800 years ago39.

383 In the south, we find that the ancient Taiwan Hanben and Gongguan culture
384 individuals dating from at least a span of 1400 BCE - 600 CE are genetically most
385 similar to present-day Austronesian speakers and ancient Lapita individuals from
386 Vanuatu as shown in outgroup f3-statistics and significantly positive f4-statistics
387 (Taiwan_Hanben/Gongguan, Mbuti; Ami/Atayal/Lapita, other Asians) (Table S8).
388 The similarity to Austronesian-speakers is also evident in the Iron Age dominant
389 paternal Y chromosome lineage O3a2c2-N6 and maternal mtDNA lineages E1a,
390 B4a1a, F3b1, and F4b, which are widespread lineages among Austronesianspeakers40,41
391 . We compared the present-day Austronesian-speaking Ami and Atayal of
392 Taiwan with diverse Asian populations using statistics like f4 (Taiwan Iron
393 Age/Austronesian, Mbuti; Asian1, Asian2). Ancient Taiwan groups and Austronesian
394 speakers share significantly more alleles with Tai-Kadai speakers in southern
395 mainland China and in Hainan Island42 than they do with other East Asians (Table
396 S8), consistent with the hypothesis that ancient populations related to present-day Tai
397 Kadai speakers are the source for the spread of agriculture to Taiwan island around
398 . The Jomon share alleles at an elevated rate with ancient Taiwan
399 individuals and Ami/Atayal as measured by statistics of the form f4 (Jomon, Mbuti;
400 Ancient Taiwan/Austronesian-speaker, other Asians) compared with other East Asian
401 groups, with the exception of groups in the Amur Basin Cluster (Table S8)44.
|
|
|
|
Post by Admin on Aug 23, 2020 20:57:04 GMT

403 The Han Chinese are the world’s largest ethnic group. It has been hypothesized based
404 on the archaeologically documented spread of material culture and farming
405 technology, as well as the linguistic evidence of links among Sino-Tibetan languages,
406 that one of the ancestral populations of the Han might have consisted of early farmers
407 along the Upper and Middle Yellow River in northern China, some of whose
408 descendants also may have spread to the Tibetan Plateau and contributed to presentday Tibeto-Burmans
409 . Archaeological and historical evidence document how during
410 the past two millennia, the Han expanded south into regions inhabited by previously
411 established agriculturalists46. Analysis of genome-wide variation among present-day
412 populations has revealed that the Han Chinese are characterized by a “North-South”
413 cline47,48, which is confirmed by our analysis. The Neolithic Wuzhuangguoliang,
414 present-day Tibetans, and Amur River Basin populations, share significantly more
415 alleles with Han Chinese compared with the Southeast Asian Cluster, while the
416 Southeast Asian Cluster groups share significantly more alleles with the majority of
417 Han Chinese groups when compared with the Neolithic Wuzhuangguoliang (Table
418 S12, Table S13). These findings suggest that Han Chinese may be admixed in variable
419 proportions between groups related to Neolithic Wuzhuangguoliang and people
420 related to those of the Southeast Asian Cluster. To determine the minimum number of
421 source populations needed to explain the ancestry of the Han, we used qpWave4,49 to
422 study the matrix of all possible statistics of the form f4 (Han1, Han2; O1, O2), where
423 “O1” and “O2” are outgroups that are unlikely to have been affected by recent gene
424 flow from Han Chinese. This analysis confirms that two source populations are
425 consistent with all of the ancestry in most Han Chinese groups (with the exception of
426 some West Eurasian-related admixture that affects some northern Han Chinese in
427 proportions of 2-4% among the groups we sampled; Table S14 and Table S15).
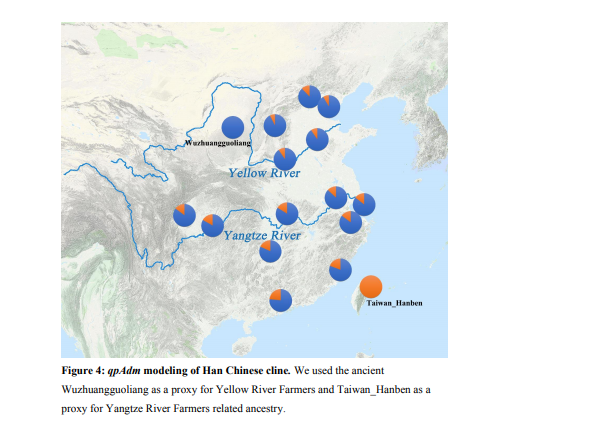
428 Specifically, we can model almost all present-day Han Chinese as mixtures of two
429 ancestral populations, in a variety of proportions, with 77-93% related to Neolithic
430 Wuzhuangguoliang from the Yellow River basin, and the remainder from a
431 population related to ancient Taiwan that we hypothesize was closely related to the
432 rice farmers of the Yangtze River Basin. This is also consistent with our inference that
433 the Yangtze River farmer related ancestry contributed nearly all the ancestry of
434 Austronesian speakers and Tai-Kadai speakers and about 2/3 of some Austroasiatic
435, 20 (Figure 4). A caveat is that there is a modest level of modern
436 contamination in the Wuzhuangguoliang we use as a source population for this
437 analysis (Online Table 1), but this would not bias admixture estimates by more than
438 the contamination estimate of 3-4%. The average dates of West Eurasian-related
439 admixture in northern Han Chinese populations Han_NChina and Han_Shanxi are 32-
440 45 generations ago, suggesting that mixture was continuing at the time of the Tang
441 Dynasty (618-907 CE) and Song Dynasty (960-1279 BCE) during which time there
442 are historical records of integration of Han Chinese and western ethnic groups, but
443 this date is an average so the mixture between groups could have begun earlier.
|
|
|
|
Post by Admin on Aug 24, 2020 20:30:29 GMT
445 To obtain insight into the formation of present-day Japanese archipelago populations,
446 we searched for groups that contribute most strongly to present-day Japanese through
447 admixture f3-statistics. The most strongly negative signals come from mixtures of Han
448 Chinese and ancient Jomon (f3(Japanese; Han Chinese, Jomon)) (Table S16). We can
449 model present-day Japanese as two-way mixtures of 84.3% Han Chinese and 15.7%
450 Jomon or 87.6% Korean and 12.4% Jomon (we cannot distinguish statistically
451 between these two sources; Table S17 and Table S18). This analysis by no means
452 suggests that the mainland ancestry in Japan was contributed directly by the Han
453 Chinese or Koreans themselves, but does suggest that it is from an ancestral
454 population related to those that contributed in large proportion to Han Chinese as well
455 as to Koreans
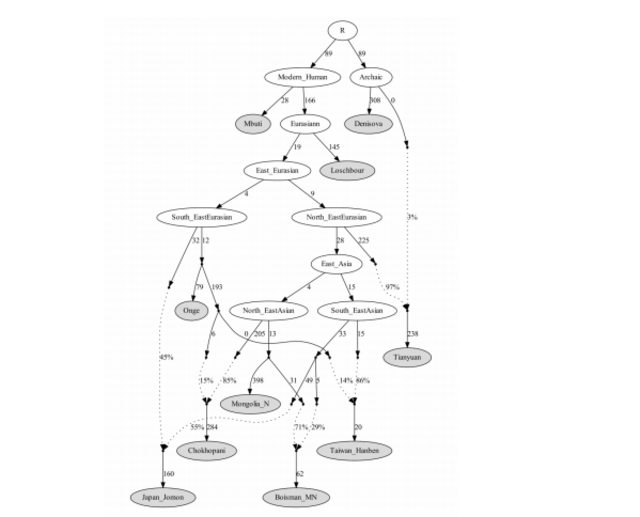
456 We used qpGraph35 457 to explore models with population splits and gene flow, and
458 tested their fit to the data by computing f2-, f3- and f4- statistics measuring allele
459 sharing among pairs, triples, and quadruples of populations, evaluating fit based on
460 the maximum |Z|-score comparing predicted and observed values. We further
461 constrained the models by using estimates of the relative population split times
462 between the selected pairs of populations based on the output of the MSMC
software50 463 . While admixture graph modeling based on allele frequency correlation
464 statistics is not able to reject a model in which ancient Taiwan individuals and
465 Boisman share substantial ancestry with each other more recently than either does
466 for which we do not yet have ancient DNA data. with the ancestors of Chokopani and Core Tibetans,
467 this model cannot be correct because our MSMC analysis reveals that Core Tibetans (closely related to Chokopani)
468 and Ulchi (closely related to Boisman) share ancestry more recently in time on
469 average than either does with Ami (related to Taiwan_Hanben). This MSMC-based
470 constraint allowed us to identify a parsimonious working model for the deep history
471 of key lineages discussed in this study (Supplementary Information section 3:
472 qpGraph Modeling). Our fitted model (Figure 5), suggests that much of East Asian
473 ancestry today can be modelled as derived from two ancient populations: one from the
474 same lineage as the approximately ~40,000-year-old Tianyuan individual and the
475 other more closely related to Onge, with groups today having variable proportions of
476 ancestry from these two deep sources. In this model, the Mongolia_East_N and Amur
477 River Basin Boisman related lineages derive the largest proportion of their ancestry
478 from the Tianyuan-related lineage and the least proportion of ancestry from the Onge
479 related lineage compared with other East Asians. A sister lineage of
480 Mongolia_East_N is consistent with expanding into the Tibetan Plateau and mixing
481 with the local hunter-gatherers who represent an Onge-related branch in the tree. The
482 Taiwan Hanben are well modelled as deriving about 14% of their ancestry from a
483 lineage remotely related to Onge and the rest of their ancestry from a lineage that also
484 contributed to Jomon and Boisman on the Tianyuan side, a scenario that would
485 explain the observed affinity among Jomon, Boisman and Taiwan Hanben. We
486 estimate that Jomon individuals derived 45% of their ancestry from a deep basal
487 lineage on the Onge side. These results are consistent with the scenario a Late
488 Pleistocene coastal route of human migration linking Southeast Asia, the Japanese
489 Archipelago and the Russian Far East51. Due to the paucity of ancient genomic data
490 from Upper Paleolithic East Asians, there are limited constraints at present for
491 reconstructing the deep branching patterns of East Asian ancestral populations, and it
492 is certain that this admixture graph is an oversimplification and that additional
493 features of deep population relationships will be revealed through future work.

495 At the end of the last Ice Age, there were multiple highly differentiated populations in
496 East as well as West Eurasia, and it is now clear that these groups mixed in both
497 regions, instead of one population displacing the others. In West Eurasia, there were
498 at least four divergent populations each as genetically differentiated from each other
499 as Europeans and East Asians today (average FST=0.10), which mixed in the
500 Neolithic, reducing heterogeneity (average FST=0.03) and mixed further in the Bronze
501 Age and Iron Age to produce the present-relatively low differentiation that
502 characterizes modern West Eurasia (average FST=0.01)52. In East Eurasia, our study
503 suggests an analogous process, with the differentiation characteristic of the Amur
504 River Basin groups, Neolithic Yellow River farmers, and people related to those of
505 the Taiwan Iron Age (average FST=0.06 in our data) collapsing through mixture to
506 today’s relatively low differentiation (average FST=0.01-0.02) (Figure 6). A priority
507 should be to obtain ancient DNA data for the hypothesized Yangtze River population
508 (the putative source for the ancestry prevalent in the Southeast Asian Cluster of
509 present-day groups), which should, in turn, make it possible to test and further extend
510 these models, and in particular to understand if dispersals of people in Southeast Asia
511 do or do not correlate to ancient movements of people.
|
|


