|
|
Post by Admin on Feb 1, 2020 7:58:56 GMT
In November 2002, doctors in the Guangdong province of southeastern China began to see the first cases of what would become known as SARS, or severe acute respiratory syndrome. Over the next several months, 8,096 people in 26 countries contracted the new viral illness, leading to 774 deaths. Although the slow reporting of initial SARS cases helped the illness spread, globally-enforced medical practices eventually helped end the outbreak. The reasons for the slow reporting of SARS are complicated. Doctors had never seen the viral illness before, and at first, those in Guangdong province thought the SARS cases they were seeing might be atypical pneumonia. “Nobody was aware of it, including probably people in Beijing,” says Arnold S. Monto, a professor of epidemiology and global public health at the University of Michigan. Even after doctors began to realize that there was something new about the illnesses they were seeing, “it was kept locally for a while, which was one of the problems.” There were also reports that officials may have encouraged doctors not to report new cases when SARS spread to Beijing. In April 2003, Time magazine obtained a letter from Jiang Yanyong, a physician at an army hospital in Beijing, alleging the actual number of SARS cases in the capital city was much higher than the official count. This turned out to be true, and Chinese officials released the real numbers that month (and also began to monitor Jiang).  SARS jumped from mainland China to Hong Kong in February 2003 when Liu Jianlun, a medical professor from Guangdong who unknowingly had SARS, checked into Room 911 at Hong Kong's Metropole Hotel. The 64-year-old professor soon became sick from the illness and went to the hospital, where he died within two weeks. But during his short stay at the hotel, he unwittingly infected several other guests. Those people then took SARS with them to Singapore, Toronto and Hanoi. (The hotel has since been renamed Room 911 because of the stigma.) “It’s a remarkable story, and it also identifies an issue which was clearly identified as a problem in 2003,” Monto says. “And that is that there were what we call ‘superspreaders’—people who seem to infect a lot of other people.” Scientists still don’t understand the biological reason why some infected people spread illness more than others do in the same situation, but they were a major factor in the spread of SARS. “The other very important characteristic of SARS was the association or the particular problem of hospital-based infections, healthcare worker infections,” Monto says. “And this was a manifestation of the fact that sick patients and particularly very sick patients shed a lot of virus into the environment.” During the SARS outbreak, medical professionals like Dr. Liu were at an increased risk of passing the illness to people outside of hospitals.  Illnesses like SARS create panic because there are so many unknowns. In the midst of the outbreak, scientists weren’t certain if they would be able to eliminate SARS completely, or if it would become a seasonal illness like the flu, which kills hundreds of thousands of people per year. Luckily, doctors and scientists were able to completely eliminate SARS by isolating and quarantining people until the virus passed out of their system and they could no longer transmit it to others. Because of international cooperation to isolate and quarantine people with SARS, the World Health Organization and affected countries were able to contain SARS by July 2003. After that year, the only SARS cases came from isolated laboratory outbreaks where scientists were studying the SARS coronavirus (SARS-CoV) that causes the illness. Once again, officials contained these infections through isolation and quarantines. China and Hong Kong suffered the most during the SARS outbreak. In China, there were 5,327 cases and 349 deaths; and in Hong Kong, there were 1,755 cases and 299 deaths, according to the World Health Organization. One of the lessons of the SARS outbreak was that in the future, China needed to have more transparency between its provinces and its national government.  “SARS was an alert as to how bad it could be,” Monto says. “China has had the experience over the last 15 years of dealing with small outbreaks of avian influenza—which have not transmitted extensively, but have continued to occur in China—so they’ve learned how to deal with these.” Preparedness for pandemics has also improved on a global level, says Anne W. Rimoin, a professor of epidemiology at the UCLA School of Public Health who specializes in the Ebola virus. “Since the SARS outbreak, we’ve seen several other outbreaks,” she says. “We’ve had MERS, we’ve had the H1N1, that’s swine flu; we’ve had chikungunya, we’ve had Zika, and we’ve had several Ebola outbreaks since that time. So I think that the world has just gotten much better at coordinating response.” |
|
|
|
Post by Admin on Feb 1, 2020 18:12:40 GMT
 Estimating the effective reproduction number of the 2019-nCoV in China Zhidong Cao, View ORCID ProfileQingpeng Zhang, Xin Lu, Dirk Pfeiffer, Zhongwei Jia, Hongbing Song, Daniel Dajun Zeng doi: doi.org/10.1101/2020.01.27.20018952Abstract We estimate the effective reproduction number for 2019-nCoV based on the daily reported cases from China CDC. The results indicate that 2019-nCoV has a higher effective reproduction number than SARS with a comparable fatality rate.
29 Text—799 words
30 As of 01/26/2020, the 2019 novel coronavirus (2019-nCoV), originated in Wuhan
31 China, has spread to 29 mainland provinces, Hong Kong, Macau, Taiwan, as well as 11 other
32 countries (1, 2). Early genome sequence and clinical studies of 2019-nCoV provided the
33 evidence of human-to-human transmission and revealed its similarity to as well as differences
34 from SARS (3-5). However, epidemiological investigations of 2019-nCoV are just
35 beginning, and data-driven studies are critically needed to develop insights into this ongoing
36 outbreak and evaluate the effectiveness of public health strategies, such as the currently
37 implemented lockdown of Wuhan.
38 An important epidemiological understanding of 2019-nCoV is concerned with its
39 transmissibility, quantified by the basic reproduction number and the effective 𝑅0
40 reproduction number . is the expected number of secondary infectious cases generated 𝑅 𝑅0
41 by an infectious case in a susceptible population. is the expected number of secondary 𝑅
42 cases generated by an infectious case once an epidemic is underway (6). , where 𝑅 = 𝑅0
𝑥 𝑥 ∈
43 (0, 1) is the proportion of the population susceptible. Following (7), is calculated as 𝑅
44 follows:
45 𝑅 = 𝐾2(𝐿 × 𝐷) + 𝐾(𝐿 + 𝐷) + 1,
46 where is the average latent period, the average latent infectious period, the logarithmic 𝐿 𝐷 𝐾
47 growth rate of the case counts as reported by China CDC. This form of is appropriate 𝑅
48 because 2019-nCoV is still at its early growth stage. According to China CDC, we set 𝐿 = 7
49 days and 𝐷 = 9 days. Experiments with varying 𝐿 and 𝐷 values were also conducted.
|
|
|
|
Post by Admin on Feb 2, 2020 1:18:38 GMT
50 Let denote the number of days since the start of the outbreak and the number of 𝑡 𝑌(𝑡)
51 cases. is estimated based on at six time points. (Time-1) 12/31/2019, when the 𝐾 𝑌(𝑡)
52 authorities reported the first 27 cases with the infection dated as early as 12/16/2019. As
53 such, t=15, Y(15)=27. (Time-2) 01/04/2020, t=19, Y(19)=41; (c) 01/21/2020, t=36, 𝑌(36) = 375;
54 (Time-3) 01/22/2020, 𝑡 = 37 𝑌(37) = 437; (Time-4) 01/23/2020, 𝑡 = 38, 𝑌
55 (38) = 507; (Time-5) 01/24/2020, 𝑡 = 39 𝑌(39) = 572; (Time-6) 01/25/2020, 𝑡 = 40 𝑌(40)
56 = 618. Note that the case data between 01/05/2020-01/20/2020 were discarded due to
57 significant changes experienced in this time period in the case reporting requirements and
58 practice.
59 Using the data described above, R is estimated to be 4.08, indicating that an infected 𝑅
60 patient infects more than four susceptible people during the outbreak. This value substantially
61 exceeds WHO's estimate of (supposed to be smaller than ) between 1.4 and 2.5, and is 𝑅0 𝑅
62 also higher than a recent estimate between 3.6 and 4.0 ( 𝑅 8). Compared against the 2003 0
63 SARS epidemic, of 2019-nCoV is higher than that of SARS in both Beijing (2.76) and 𝑅
64 Guangzhou (3.01) (calculated using the same method). To test the robustness of findings, we
65 performed sensitivity analyses by adopting varying values of and , generated from a 𝐿 𝐷
66 Gaussian distribution with and . The resulting mean of R estimates is 𝐿~𝑁(7,1) 𝐷~𝑁(9,1)
67 4.08, as expected, with SD=0.36 (95% CI 3.37~4.77).
68 To predict the future outbreak profile, we developed a model based on the
69 deterministic Susceptible-Exposed-Infectious-Recovered-Death-Cumulative (SEIRDC)
70 structure (9). Overall, our model appears to explain the reported case counts very well during
71 the current early stage of the outbreak. An interesting finding is that by setting the start date
72 to a time earlier than 12/16/2020 (the experimented range is from 12/01/2019—12/15/2019),
73 the SEIRDC model is able to provide a better fit for the case counts. This indicates that
74 human-to-human transmission may have started earlier than what the current prevailing
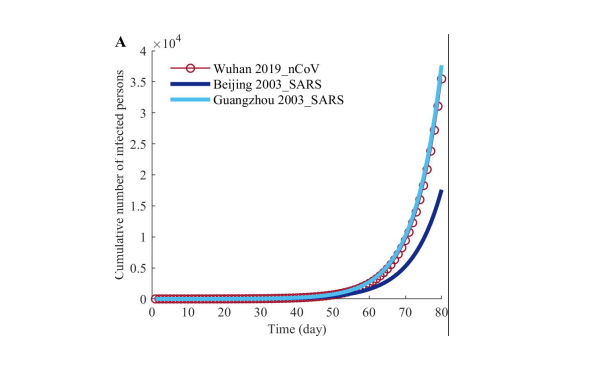 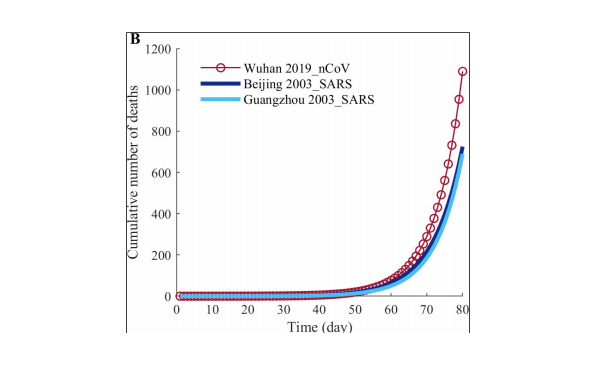 Figure. SEIRDC model predictions for (A) cumulative numbers of infected persons and (B) deaths of 2019-nCoV, 2003-SARS in Beijing, and 2003 SARS in Guangzhou in the first 80 days after the outbreak.
75 viewpoint suggests. Obviously, further molecular and epidemiological studies are needed to
76 draw any conclusions in this regard.
77 The SEIRDC model estimates the fatality rate for 2019-nCoV is 6.50%. As a base of
78 comparison, the fatality rate for 2003 SARS was 7.66% and 3.61% for Beijing and
79 Guangzhou, respectively. We used the model to predict the confirmed case counts and death
80 counts in the first 80 days of the ongoing 2019-nCoV outbreak. We simulated these counts
81 for the 2003 SARS outbreaks in Beijing and Guangzhou as well, using the case counts as
82 input. The basic assumption is the absence of any control measures in all these scenarios. At
83 the end of this 80-day period, according to our simulations, the 2019-nCoV case counts
84 (35,454) is close to that of SARS in Guangzhou (37,663) and much higher than that of SARS
85 in Beijing (17,594). The 2019-nCoV death count (1,089) is much higher than that of SARS in
86 Guangzhou (725) and Beijing (690).
87 Our study also suggests that by reducing the average infectious period to <2.3 days,
88 the resulting will decease to a value less than 1, meaning the epidemic can be effectively 𝑅
89 controlled.
90 In conclusion, considering transmissibility and fatality rate, 2019-nCoV poses a major
91 public health threat, at least at the level of 2003 SARS. Epidemiological studies are critically
92 called for to evaluate the effectiveness of stringent measures such as lockdown and help the
93 design of refinements and development of potential alternative strategies for the next phase of
94 the 2019-nCoV outbreak.
95 Acknowledgments
96 This work was supported in part by grants from the Ministry of Science and
97 Technology (2016QY02D0305), National Natural Science Foundation of China (71621002,
98 71771213, 71790615, 71972164 and 91846301), Chinese Academy of Sciences (ZDRW-XH99 2017-3), and the Hunan Science and Technology Plan Project (2017RS3040, 2018JJ1034).
|
|
|
|
Post by Admin on Feb 2, 2020 19:53:17 GMT
Two months into the epidemic, the coronavirus has not proven to be as deadly as the SARS virus. That, however, may also help explain why it’s spreading so quickly. It has an incubation period of up to two weeks, which enables the virus to spread through person-to-person contact.  The coronavirus, a highly contagious, pneumonia-causing illness that infects the respiratory tract, was responsible for 304 deaths in China, with 45 new deaths reported in the previous 24-hour period, and 14,380 infections worldwide, according to the latest figures released by China’s National Health Commission on Sunday (Saturday EST). SARS, or severe acute respiratory syndrome, infected 8,096 people worldwide with approximately 774 official SARS-related deaths; most of those infections occurred during a nine-month period from 2002 to 2003. Even with 43 new fatalities reported over 24 hours, the fatality rate remains steady. SARS had a fatality rate of 9.6% compared to coronavirus fatality rate of 2.1%, but that may change. SARS had a fatality rate of 9.6% compared to the fatality rate of 2.1% for this new 2019-nCoV strain of coronavirus, which has remained steady for the last several weeks. However, that death toll could rise as the weeks progress, and drug companies scramble to come up with a vaccine for the virus. Whether the fatality rate remains steady has yet to be determined.  Assuming an incubation period of up to 14 days, with an average of 7 days, before a person presents with symptoms of the virus and succumbs to the illness within the first week of diagnosis, the current fatality rate may yet underestimate the eventual rate. The current fatality rate of 259 based on the total number of cases reported four days ago (4,600) equates to a fatality rate of closer to 5.6%. If, on the other hand, the number of infections is as vastly underestimated, even more so than the fatality rate, that 2.1% coronavirus fatality rate could fall, which would be good news for those who have contracted the illness. (The World Health Organization has declared a global health emergency.) Maciej Boni, an associate professor of biology, at Pennsylvania State University, said the 2009 H1N1 flu pandemic initially overestimated the final fatality rate, while the SARS fatality rate rose as the virus spread.  Boni wrote on the online science magazine LiveScience, “During the 2009 influenza pandemic, the earliest reports listed 59 deaths from approximately 850 suspected cases, which suggested an extremely high case fatality of 7%. However, the initially reported information of 850 cases was a gross underestimate. This was simply due to a much larger number of mild cases that did not report to any health system and were not counted.” “After several months — when pandemic data had been collected from many countries experiencing an epidemic wave — the 2009 influenza turned out to be much milder than was thought in the initial weeks. Its case fatality was lower than 0.1% and in line with other known human influenza viruses,” he added. But even that faality rate is smaller than the SARS fatality rate. The difference in these two fatality rates gives more context as to why the coronavirus has spread so quickly. Medical experts say an effective flu-like virus can extend its reach by not killing its host too rapidly and/or making the host sick enough to pass it on before finally becoming bedridden. |
|
|
|
Post by Admin on Feb 3, 2020 5:53:38 GMT
The continuing 2019-nCoV epidemic threat of novel coronaviruses to global health — The latest 2019 novel coronavirus outbreak in Wuhan, China
The city of Wuhan in China is the focus of global attention due to an outbreak of a febrile respiratory illness due to a coronavirus 2019-nCoV. In December 2019, there was an outbreak of pneumonia of unknown cause in Wuhan, Hubei province in China, with an epidemiological link to the Huanan Seafood Wholesale Market where there was also sale of live animals. Notification of the WHO on 31 Dec 2019 by the Chinese Health Authorities has prompted health authorities in Hong Kong, Macau, and Taiwan to step up border surveillance, and generated concern and fears that it could mark the emergence of a novel and serious threat to public health (WHO, 2020a, Parr, 2020).
The Chinese health authorities have taken prompt public health measures including intensive surveillance, epidemiological investigations, and closure of the market on 1 Jan 2020. SARS-CoV, MERS-CoV, avian influenza, influenza and other common respiratory viruses were ruled out. The Chinese scientists were able to isolate a 2019-nCoV from a patient within a short time on 7 Jan 2020 and perform genome sequencing of the 2019-nCoV. The genetic sequence of the 2019-nCoV has become available to the WHO on 12 Jan 2020 and this has facilitated the laboratories in different countries to produce specific diagnostic PCR tests for detecting the novel infection (WHO, 2020b). The 2019-nCoV is a β CoV of group 2B with at least 70% similarity in genetic sequence to SARS-CoV and has been named 2019-nCoV by the WHO.
SARS is a zoonosis caused by SARS-CoV, which first emerged in China in 2002 before spreading to 29 countries/regions in 2003 through a travel-related global outbreak with 8,098 cases with a case fatality rate of 9.6%. Nosocomial transmission of SARS-CoV was common while the primary reservoir was putatively bats, although unproven as the actual source and the intermediary source was civet cats in the wet markets in Guangdong (Hui and Zumla, 2019). MERS is a novel lethal zoonotic disease of humans endemic to the Middle East, caused by MERS-CoV. Humans are thought to acquire MERS-CoV infection though contact with camels or camel products with a case fatality rate close to 35% while nosocomial transmission is also a hallmark (Azhar et al., 2019). The recent outbreak of clusters of viral pneumonia due to a 2019-nCoV in the Wuhan market poses significant threats to international health and may be related to sale of bush meat derived from wild or captive sources at the seafood market.
As of 10 Jan 2020, 41 patients have been diagnosed to have infection by the 2019-nCoV animals. The onset of illness of the 41 cases ranges from 8 December 2019 to 2 January 2020. Symptoms include fever (>90% cases), malaise, dry cough (80%), shortness of breath (20%) and respiratory distress (15%). The vital signs were stable in most of the cases while leucopenia and lymphopenia were common. Among the 41 cases, six patients have been discharged, seven patients are in critical care and one died, while the remaining patients are in stable condition. The fatal case involved a 61 year-old man with an abdominal tumour and cirrhosis who was admitted to a hospital due to respiratory failure and severe pneumonia. The diagnoses included severe pneumonia, acute respiratory distress syndrome, septic shock and multi-organ failure. The 2019-nCoV infection in Wuhan appears clinically milder than SARS or MERS overall in terms of severity, case fatality rate and transmissibility, which increases the risk of cases remaining undetected. There is currently no clear evidence of human to human transmission. At present, 739 close contacts including 419 healthcare workers are being quarantined and monitored for any development of symptoms (WHO, 2020b, Center for Health Protection and HKSAR, 2020). No new cases have been detected in Wuhan since 3 January 2020. However the first case outside China was reported on 13th January 2020 in a Chinese tourist in Thailand with no epidemiological linkage to the Huanan Seafood Wholesale Market.
The Chinese Health Authorities have carried out very appropriate and prompt response measures including active case finding, and retrospective investigations of the current cluster of patients which have been completed; The Huanan Seafood Wholesale Market has been temporarily closed to carry out investigation, environmental sanitation and disinfection; Public risk communication activities have been carried out to improve public awareness and adoption of self-protection measures. Technical guidance on novel coronavirus has been developed and will continue to be updated as additional information becomes available.
However, many questions about the new coronavirus remain. While it appears to be transmitted to humans via animals, the specific animals and other reservoirs need to be identified, the transmission route, the incubation period and characteristics of the susceptible population and survival rates. At present, there is however very limited clinical information of the 2019-nCoV infection and data are missing in regard to the age range, animal source of the virus, incubation period, epidemic curve, viral kinetics, transmission route, pathogenesis, autopsy findings and any treatment response to antivirals among the severe cases. Once there is any clue to the source of animals being responsible for this outbreak, global public health authorities should examine the trading route and source of movement of animals or products taken from the wild or captive conditions from other parts to Wuhan and consider appropriate trading restrictions or other control measures to limit. The rapid identification and containment of a novel coronavirus virus in a short period of time is a re-assuring and a commendable achievement by China’s public health authorities and reflects the increasing global capacity to detect, identify, define and contain new outbreaks. The latest analysis show that the Wuhan CoV cluster with the SARS CoV.10 (Novel coronavirus - China (01): (HU) WHO, phylogenetic tree Archive Number: 20200112.6885385).
This outbreak brings back memories of the novel coronavirus outbreak in China, the severe acute respiratory syndrome (SARS) in China in 2003, caused by a novel SARS-CoV-coronavirus (World Health Organization, 2019a). SARS-CoV rapidly spread from southern China in 2003 and infected more than 3000 people, killing 774 by 2004, and then disappeared – never to be seen again.
However, The Middle East Respiratory Syndrome (MERS) Coronavirus (MERS-CoV) (World Health Organization, 2019b), a lethal zoonotic pathogen that was first identified in humans in the Kingdom of Saudi Arabia (KSA) in 2012 continues to emerge and re-emerge through intermittent sporadic cases, community clusters and nosocomial outbreaks. Between 2012 and December 2019, a total of 2465 laboratory-confirmed cases of MERS-CoV infection, including 850 deaths (34.4% mortality) were reported from 27 countries to WHO, the majority of which were reported by KSA (2073 cases, 772 deaths. Whilst several important aspects of MERS-CoV epidemiology, virology, mode of transmission, pathogenesis, diagnosis, clinical features, have been defined, there remain many unanswered questions, including source, transmission and epidemic potential. The Wuhan outbreak is a stark reminder of the continuing threat of zoonotic diseases to global health security. More significant and better targeted investments are required for a more concerted and collaborative global effort, learning from experiences from all geographical regions, through a ‘ONE-HUMAN-ENIVRONMENTAL-ANIMAL-HEALTH’ global consortium to reduce the global threat of zoonotic diseases (Zumla et al., 2016). Sharing experience and learning from all geographical regions and across disciplines will be key to sustaining and further developing the progress being made.
Author declarations
All authors have a specialist interest in emerging and re-emerging pathogens. FN, RK, OD, GI, TDMc, CD and AZ are members of the Pan-African Network on Emerging and Re-emerging Infections (PANDORA-ID-NET) funded by the European and Developing Countries Clinical Trials Partnership the EU Horizon 2020 Framework Programme for Research and Innovation. AZ is a National Institutes of Health Research senior investigator. All authors declare no conflicts of interest.
International Society for Infectious Diseases
February 2020Volume 91, Pages 264–266
|
|

