|
|
Post by Admin on Feb 15, 2021 4:46:31 GMT
Results Samples and haplogrouping After subjects with common surnames were recruited, we selected 567 samples encompassing 27 common surname groups with more than 10 bearers (Table 1). The rankings in the Japanese population extended from the top to the 62nd, corresponding to the most common surname to common surnames. More than 30 samples were collected for the four surnames of Satoh, Suzuki, Takahashi, and Katoh among the top ten popular surnames. Separately, 205 samples in non-namesakes were obtained for the control. Genotypes of SNP and STR were totally achieved for all 772 samples that were examined. The Y-SNP haplogroups for all 567 subjects were classified into four major haplogroups of C, D, O1b, and O2, of which the respective frequencies (number) were 0.101 (n = 57), 0.372 (n = 211), 0.287 (n = 163), and 0.208 (n = 118) at the first step. Haplogroups D and O1b were subdivided further into sub-haplogroup D* of 0.079 (n = 45) at M174, D1b1* of 0.122 (n = 69) at M116.1, D1b1a of 0.171 (n = 97) at M125, O1b* of 0.016 (n = 9) at M268, O1b2a* of 0.081 (n = 46) at JST022454, and O1b2a1a1 of 0.190 (n = 108) at CTS713. As other rare haplogroups, O*, N, and Q were also detected respectively as 0.023 (n = 13), 0.004 (n = 2), and 0.005 (n = 3). For the four surname groups consisting of more than 30 bearers, the compositions of major haplogroups were compared with that of the control group. No significant difference was found, except for Satoh, of which composition was biased to more haplogroup O2 and less D (p < 0.01). Diversity of Y-STR data for each surname In all, 489 distinct Y-STR haplotypes were identified for the 567 men, among whom 456 (93.3%) haplotypes were found once in the 15 loci. The most frequently occurring haplotype was detected 17 times in haplogroup D. For the control in the 205 non-namesake samples, 180 distinct haplotypes (96.3%) were detected once. The most frequent one was detected nine times in the same haplotype of haplogroup D. In the namesake group, with the vast majority being observed in single individuals, matches at 15 Y-STRs in the namesakes were few; each HD value was very high (Table 1). For the most common surname of Satoh, only two pairs of subjects shared an identical STR haplotype, of which the match probability was 2.0%. In all, only ten pairs or trios of eight surnames among a total of 7709 pairs in namesakes shared the same haplotypes at all the 15 loci. To explore Y-STR haplotype differences across surnames, we employed MDS analysis to the result from whole 17 loci, as presented in Fig. 1. In the MDS plot for each surname and the Japanese control group in the dataset, most surnames were not significantly different from the control group, except for the two surnames of Kobayashi and Matsumoto (p < 0.05). Furthermore, another MDS analysis within the same haplogroups of D and O1b was performed for the four surnames of Satoh, Suzuki, Takahashi, and Katoh. Significant difference was found between Satoh and Suzuki in the O1b lineage (p < 0.05); otherwise no significant difference was found (data not shown). Fig. 1 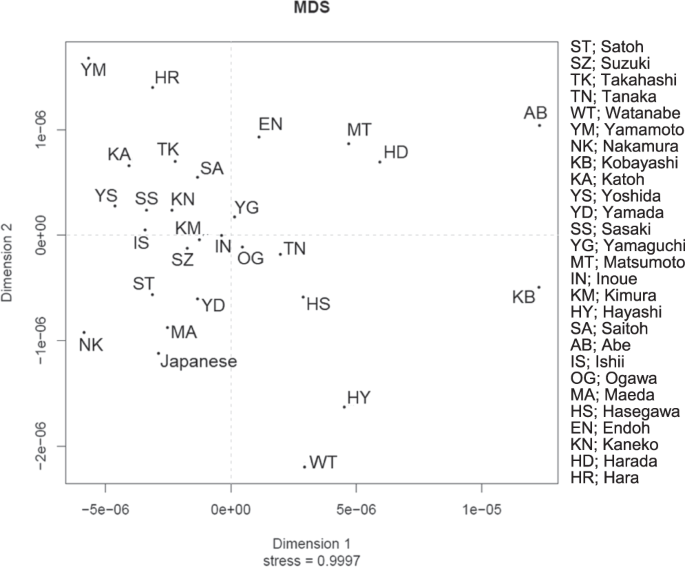 Network analysis and DCs A median-joining network was constructed using haplotypes based on 15 Y-STR loci, accompanied by coloring according to Y-SNP sub-haplogroups for each namesake group. The network structure for all subjects (n = 772) included one largest core cluster of haplogroup O1b, two cores of D, and no apparent core formation for C, O2, and others (Fig. 2a). Fig. 2 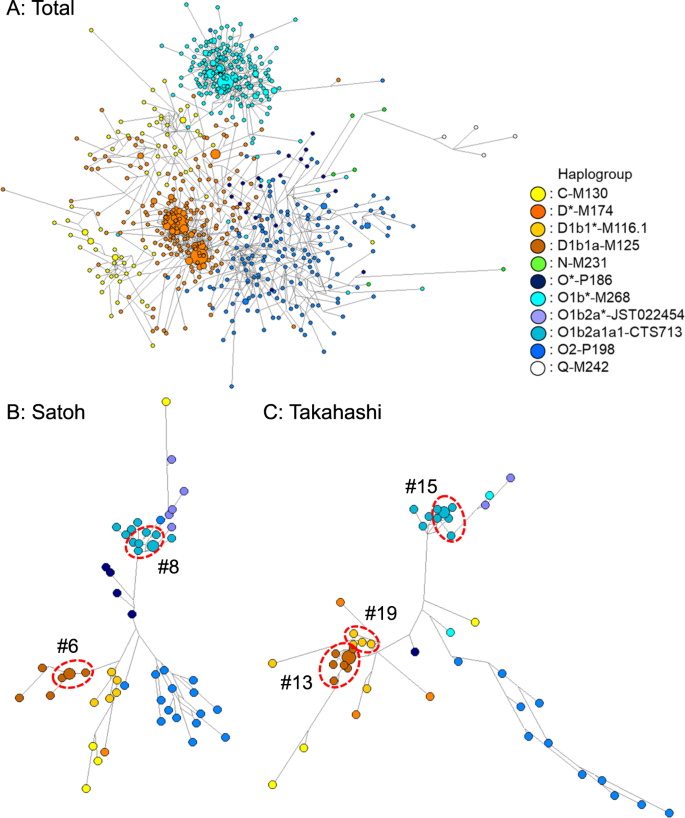 Furthermore, the features of the Satoh and Takahashi surnames are demonstrated in Fig. 2b, c, representatively. The network distributions for the examined common surnames seemed divergent without concentration to any specific identical haplotype, indicating a low level of co-ancestry present in surnames. According to our criteria, a total of 22 DCs that were derived tentatively from a founder were identified in the 13 common surnames (see Supplementary data). These clusters within maximal five steps were confirmed in the D and O1b lineages, which included 3–9 members, except for the C and O2 lineages. The Suzuki surname showed four independent clusters. The largest one detected in the Takahashi group comprised nine members within five steps. The percentage of men who were involved in any of groups 1) to 3) of DCs was as high as 18.5% in all samples of namesakes. The TMRCA was estimated for each DC using the Y-time analytical application (Fig. 3). Results of calculations indicate that 7.98–82.13 generations had passed from each putative founder in each cluster. Estimates of TMRCA for the surname DCs ranged from 279 years of DC#1 for Harada to 2577 years of DC#8-3 for Satoh. For group 1) in fewer than three mutational steps (n = 12), the estimates were 279–1269 years with a mean of 701 years before present. For Group 2), with four steps (n = 10), TMRCA was estimated as 866–1887 years, with a mean of 1193 years. For Group 3), within five steps (n = 11), TMRCA was estimated as 774–2577 years, with a mean of 1513 years. Fig. 3 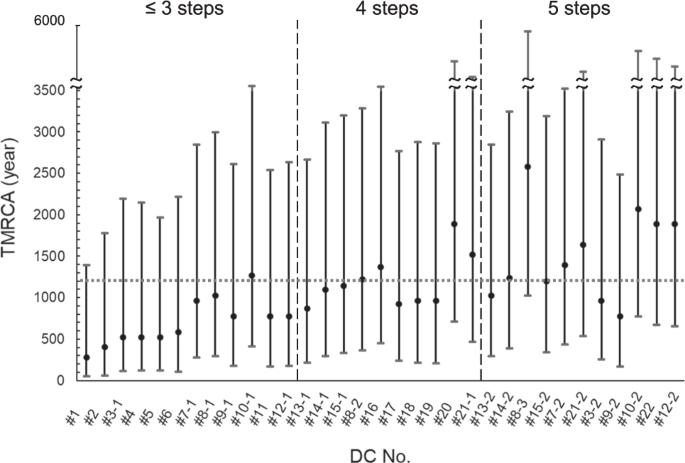 TMRCA in year for detected 22 DCs. A filled circle and vertical line respectively represent TMRCA and CIs. The horizontal broken line represents the maximal historical time-depth of a potential surname founder in Japan |
|
|
|
Post by Admin on Feb 15, 2021 5:51:31 GMT
Discussion
This study undertook molecular linkage analysis of major surnames among Japanese men with Y chromosomal polymorphisms. The Y-STR network of samples was consistent with recent observations of the Japanese population, in which Y-SNP haplogroups were biased on the divergent distribution of Y-STR haplotypes, as reported by Watahiki et al. [27]. The combination of Y-STR haplotype with Y-SNP haplogroup provided a high-resolution network structure of the phylogeny of bearers [6].
The most common surname of Satoh showed very little Y-STR haplotype sharing. More or less equal diversity was found for subjects carrying other surnames examined for this study. Ruling out effects related to sampling and the area, these results suggest that genetic drift has not occurred on a large-scale after the inception of hereditary surnames in Japan. The most common name in England, Smith, exhibited a similar network structure to that of control for non-namesake individuals. In contrast, the average probability of matching in Irish common surnames is as high as 8.15% [12], which probably derives from drift events occurring in their history.
Vertical transmission of Y-chromosome/surname linkage can be disrupted by non-paternity events such as adoption of male children, transmission of maternal surname, or deliberate surname change. At least, the different Y-SNP haplogroups within the same surname imply the presence of another founder. Investigations of genealogical records in England and Iceland suggest confounding effects of non-paternity events, occurring at a rate of 1.3–2% per generation [7, 10, 28].
This high heterogeneity, with the inclusion of many singletons, suggests that Japanese common surnames have undergone extensive loss of relation because of extensive non-paternity events, in addition to other factors such as mutation in meiosis. Moreover, a more plausible interpretation is that this extensive diversity derives from numerous founders through history. Many people gained a surname recently, i.e. within the last couple of centuries. Effects of such multiple independent founders were observed also in South Korea [29].
In contrast to heterogeneity among namesakes, many groups showed a cluster of close haplotypes in the same SNP haplogroup. Genetic testing is incapable of identifying the true lineage between two male individuals in the absence of an extensive genealogical tree. Therefore, the criteria were tentative. According to criteria used by King and Jobling [7], only five DCs of #1, #2, #6, #13, and #15 (in Supplementary data) were detectable from the present data. Their criteria were strict, but they caused underestimation. The requirements are expected to be suitable for a local rare surname group having total population of less than 10,000. Martinez-Cadenas et al. [21] speculated that five mutational steps would be maximal for any two bearers. We therefore examined how many steps are reasonable for the Japanese population.
To construct putative DCs for this study, we assumed three classes of fewer than five mutational steps. For analyses, 22 DCs were identified in 13 surname groups. In 12 clusters of fewer than three steps in group 1, a founder was assumed to have existed 279–1269 years ago. In 10 clusters within four steps in group 2, a founder was assumed to have existed 886–1887 years ago. In group 3 within five steps, up to 9 of 11 led to an estimate of more than millennial age. Apparently, when larger numbers of mutational steps are considered, a more ancient founder must be assumed. Furthermore, when more members are involved, even in the same step, larger TMRCA must be estimated. Overestimation might occur in a group within five step-neighbors. These results suggest that a group within four steps is optimal for selection of a DC in the huge population of a whole nation.
In Japanese history, surname use was prevalent among the noble class in the tenth century during the Heian period; the practice later to extended to the military class [15]. These major surnames are thought to have originated during this period, meaning that the surnames analyzed in this study spent roughly a millennium as the time-depths of surname establishment. Founders from the ancient noble families are known for some of the major surnames prevailing today. For instance, the most populous surname of Satoh is said to be derived from a local faction of the famous Fujiwara family.
After the public use of surnames had been prohibited among farmers for a couple of centuries, most people carried surnames late in the Edo period. In general, surnames are believed to have been inherited paternally throughout history. The heritage principle was established by law in the 19th century, during the Meiji period.
Our results highlight the fact that common Japanese surnames consist of DCs and many singletons, indicating mixed stratification of long-term bearers and short-term bearers in the population. The present molecular study revealed characteristic features of Japanese surnames. Japanese society is characterized by a wider variety of surnames than those of Korea and China. Given ~100,000 surnames in the country, regionally uneven distributions have been reported for common surnames and rare surnames [15]. For China, which has the world’s longest history of surnames, a large-scale study revealed a high relation of surnames with Y-chromosome polymorphism [30]. As in European countries, analyses of Y chromosome and surnames are progressing in Asia and elsewhere. Reportedly, several DNA registering banks for surnames have been established around the world to support historical studies [31]. Furthermore, forensic use of Y-chromosome DNA is anticipated for personal identification [32]. The investigation of Y-chromosome should be developed in Japan on a large scale.
In conclusion, the present examinations of the RST plot and network analyses revealed that divergence in collected surname samples progressed to a high degree. In contrast, many DCs composed of close haplotypes in the same SNP haplogroup were identified. Common Japanese surnames should consist of long-term bearers and short-term bearers in the population, which can reflect influences of historical events. This report is the first of extensive research conducted of the Japanese population.
|
|
|
|
Post by Admin on Feb 15, 2021 21:04:46 GMT
Genome-wide SNP data of Izumo and Makurazaki populations support inner-dual structure model for origin of Yamato people Timothy Jinam, Yosuke Kawai, Yoichiro Kamatani, Shunro Sonoda, Kanro Makisumi, Hideya Sameshima, Katsushi Tokunaga & Naruya Saitou Journal of Human Genetics (2021 Abstract The “Dual Structure” model on the formation of the modern Japanese population assumes that the indigenous hunter-gathering population (symbolized as Jomon people) admixed with rice-farming population (symbolized as Yayoi people) who migrated from the Asian continent after the Yayoi period started. The Jomon component remained high both in Ainu and Okinawa people who mainly reside in northern and southern Japan, respectively, while the Yayoi component is higher in the mainland Japanese (Yamato people). The model has been well supported by genetic data, but the Yamato population was mostly represented by people from Tokyo area. We generated new genome-wide SNP data using Japonica Array for 45 individuals in Izumo City of Shimane Prefecture and for 72 individuals in Makurazaki City of Kagoshima Prefecture in Southern Kyushu, and compared these data with those of other human populations in East Asia, including BioBank Japan data. Using principal component analysis, phylogenetic network, and f4 tests, we found that Izumo, Makurazaki, and Tohoku populations are slightly differentiated from Kanto (including Tokyo), Tokai, and Kinki regions. These results suggest the substructure within Mainland Japanese maybe caused by multiple migration events from the Asian continent following the Jomon period, and we propose a modified version of “Dual Structure” model called the “Inner-Dual Structure” model. Introduction The Japanese Archipelago spans more than 2000 km from north to south. This Archipelago was called “Yaponesia” by writer Toshio Shimao in early 1960s [1], by connecting “Yapo” (Japan in Latin) and “nesia” (islands in Latin). Yaponesia can be divided into three geographical areas: Northern Yaponesia, Central Yaponesia, and Southern Yaponesia (Fig. 1). Northern Yaponesia consists of Hokkaido (sometimes Sakhalin and Kuril Islands may also be included [2]), Central Yaponesia consists of Honshu, Shikoku, and Kyushu, and Southern Yaponesia consists of the islands in Okinawa prefecture, also known as Ryukyu Islands. Besides people from Okinawa and the Ainu from Hokkaido, people who inhabit the Japanese Archipelago can be referred to as Yamato people. 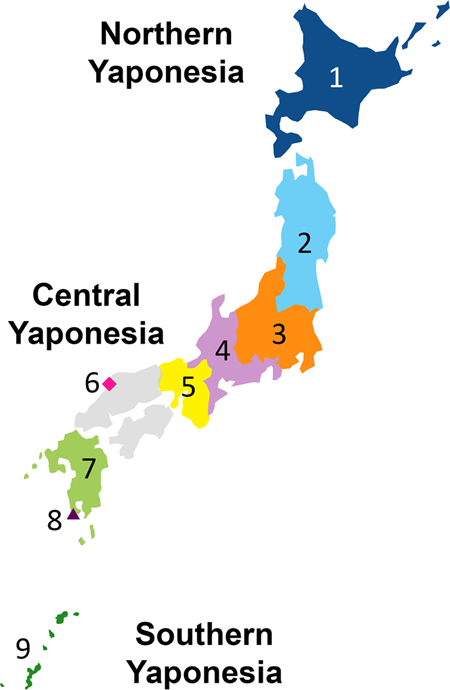 Regarding the formation of Yaponesians (Japanese), von Baelz [3] first pointed out common features in Ainu and Okinawan people as early as 1911. This view was later supported by many researchers, and renamed by Yamaguchi [4] and Hanihara [5] as the “Dual Structure” model. This model has often been invoked to explain the genetic diversity of people from the Japanese Archipelago, which has been inhabited by humans long before the Jomon period (16,000–3,000 years before present, BP [6, 7]). According to the model, rice agriculturists (symbolically called “Yayoi” people) migrated from the Asian Continent during the Yayoi period (10th century B.C.–3rd century A.D. [7]). They admixed with the indigenous hunter-gatherers (symbolically called “Jomon” people), resulting in the current Japanese population. Figure 2 shows the “Dual Structure” model based on Hanihara [5]. This model also posits that Ainu people from Hokkaido in the north and Okinawa people from the southernmost islands have the much higher proportion of Jomon ancestry compared to Yamato people. Initially conceived from craniometric data, the model now has a strong support from our genome-wide SNP data [8]. 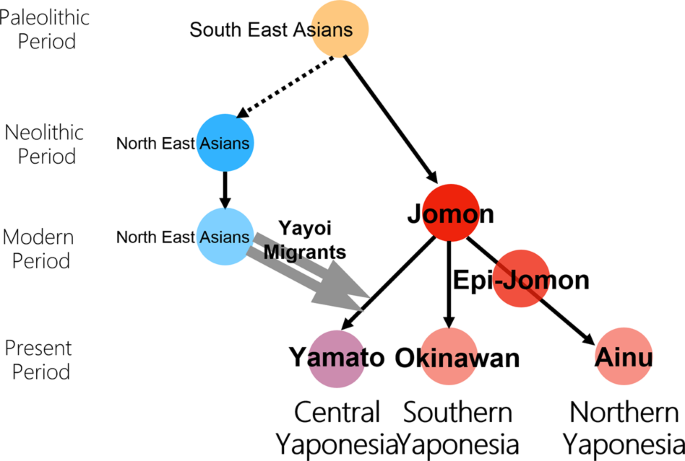 Fig. 2 However, most genetic data of Yamato people were from Tokyo and its surrounding Kanto region. There have been reports of substructure within Japanese people using genome-wide SNPs [9, 10] and HLA alleles [11, 12]. Nonetheless, some regions in Japan are under-represented in population genetics studies. We therefore generated new genome-wide SNP data from people in Izumo, Shimane Prefecture and Makurazaki, Kagoshima Prefecture, and together with data from other parts of Japan, we tested whether the “Dual Structure” model still applies to these populations. |
|
|
|
Post by Admin on Feb 15, 2021 23:28:29 GMT
Materials and methods
A total of 90 and 72 individuals from Izumo City of Shimane Prefecture and Makurazaki City of Kagoshima Prefecture, respectively (see Fig. 1), were recruited for this study.
It should be noted that individuals from Izumo were sampled in two periods and at different locations. We first collected blood samples at Department of Human Genetics, School of Medicine, the University of Tokyo in 2013 from 21 individuals who grew up in Izumo City and were at that time residents of Tokyo Area. Most of their grandparents also grew up in Izumo area. These data on 21 individuals were reported by Saitou and Jinam [13] as a preliminary study. We later collected saliva samples at the Archeological Museum of Kojindani, Izumo City in 2014 from 69 individuals. In total, only 51 DNA samples from Izumo contained enough good-quality DNA for genotyping.
As for the Makurazaki population, blood samples were collected from 72 individuals in 2015 at Makurazaki City with the help of the Makurazaki City Medical Association, and all 72 individual DNA samples were used for this study. Four grandparents of all these 72 individuals collected in Makurazaki grew up in the Southern Satsuma region. Both the Izumo and Makurazaki samples were genotyped using the Japonica array [14]. After filtering out SNPs based on genotyping call rate (<95%) and the Hardy-Weinberg equilibrium (p < 1 × 10⁻¹⁰), a total of 625,177 autosomal SNPs remained. Cryptic relatedness within each population was checked using KING software [15]. Six individuals from Izumo and eight from Makurazaki with up to 3rd degree relations (kinship coefficient more than 0.06) were omitted from further analysis. Therefore, 45 and 64 genome-wide SNP data for Izumo and Makurazaki, respectively, were used for subsequent data analyzes.
The Japonica-array SNP data for Izumo and Makurazaki were then merged with the following datasets: (1) BioBank Japan (BBJ) [16, 17] genome-wide SNP data (922,511 sites); (2) Affymetrix 6.0 micro-array data (641,314 SNP sites) of 20 Ainu, 35 Okinawa, 50 Yamato (mostly from Kanto region) [8], and 42 Chinese Han in Beijing (CHB) [18] individuals; (3) high-coverage whole genome data of 88 Koreans from the Korean Personal Genome Project [19]; (4) high-coverage whole genome data of Asian populations (CHB, Southern Han Chinese, Chinese Dai from China, Kinh from Vietnam) from the 1000 genomes project [20].
The BioBank Japan dataset (BBJ) [17] consisted of 182,546 individuals treated at hospitals in seven regions in Japan: Hokkaido, Tohoku, Kanto-Koshinetsu (Kanto for short), Tokai-Hokuriku (Tokai for short), Kinki, Kyushu, and Okinawa (Fig. 1). The genotyping data obtained by SNP array was downloaded from Japanese genotype-phenotype archive on the approval of NBDC Data Access Committee (JGA Accession ID: JGAD000123). The genotype data were converted into VCF format.
Whole genome sequence data were analyzed by the workflow recommended by the GATK best practice. We retrieved the mapped-read data in CRAM format for Asian population from the 1000 Genomes project (https://www.internationalgenome.org/). For Korean population, raw reads in fastq format were retrieved from The Personal Genome Project Korea (http://opengenome.net/Main_Page). The raw reads were then mapped to GRCh38 reference sequence by bwa-mem in order to consolidate with 1000 Genomes project data. Variant discovery was performed using the HaplotypeCaller algorithm implemented in GATK4.1 to perform joint calling. Joint calling was performed by GVCFtyper algorithm implemented in sentieon package [21] for computational efficiency. This program yields results compatible with GATK’s GenomicsDB and genotypeGVCFs programs. Each variant was scored using the VQSR algorithm to filter the variants. We applied VQSR by valCal and ApplyVarCal program of sentieon package. The HapMap and International 1000 Genomes Omni2.5 sites, the high-confidence SNPs of 1000-G sites, and the dbSNP151 sites are used as true datasets, training datasets, and known datasets, respectively. SNPs that passed the 99.9% sensitivity filter by VQSR were used for subsequent analyzes. The filtered genotype data in VCF were then merged with SNP array data of the BBJ, Izumo, and Makurazaki datasets by the merge function implemented in bcftools. SNPs that are missing in either dataset, minor allele frequency <1%, call rate <3%, or statistically significant deviation from Hardy-Weinberg equilibrium (p value < 0.00001) were filtered out. In total 106,237 SNPs remained. For the subsequent analyzes that require the independence of nearby SNPs, the linkage disequilibrium (LD)-based SNP pruning were performed by PLINK1.9 [22] with “--indep-pairwise 500 50 0.1”. We obtained 39,331 LD independent SNPs. After excluding duplicate samples and those with cryptic relatedness by KING, the principal component analysis (PCA) was performed using PLINK1.9 to remove outlier samples. The number of BBJ samples remaining after this step was 169,169. To reduce computation times for subsequent analyzes, we decided to further trim down the BBJ dataset. First, the mean values of the top 10 principal component values were calculated for each region, and the deviation of the principal component values from the mean were assessed for each sample by Euclidean distance. The top 1000 samples with the smallest Euclidean distances were selected from each region and used for subsequent analyses.
PCA was again performed using the trimmed down BBJ dataset using PLINK1.9, and Admixture [23] was used for admixture analysis. f4 test implemented in treemix [24] was used to test for gene flow between populations. GBR (British in England and Scotland) population from the 1000 Genomes dataset was used as outgroup for the f4 test. Phylogenetic analysis of populations was conducted using the neighbor-joining method [25] and Neighbor-Net [26] for phylogenetic tree and network construction, respectively. Pairwise Fst distances between populations calculated in smartpca [27] was used for tree and network construction.
|
|
|
|
Post by Admin on Feb 16, 2021 7:01:26 GMT
Results We first conducted PCA under various combinations of populations. Supplementary Fig. 1 shows that Makurazaki and Izumo cluster with Yamato when PCA was performed with Ainu, Okinawan, and CHB. Next, PCA was performed using Izumo, Makurazaki, BBJ, Korean, and 1,000 genomes project data (Fig. 3). A total of 106,237 SNP sites were used for this PCA. Non-Japanese individuals are represented by gray dots and the detailed positions are shown in Supplementary Fig. 2, while the nine Yaponesian populations (see Fig. 1 for their geographical locations) are shown as different colors in each panel. The left most cluster in each panel is made up of Okinawa (9) individuals, Yamato individuals in the middle cluster, while other continental Asians are located on the right side. Individuals from Hokkaido (1), Kanto (3), and Tokai (4) are distributed in the center of Yamato cluster, while Tohoku (2) and Kinki (5) individuals are slightly deviated from the central cluster. Interestingly, individuals sampled from Kyushu (7) are located both in Okinawa and Yamato clusters (shown as A and B, respectively). These Kyushu individuals who are within the Okinawa cluster (referred to as “Kyushu-A” hereafter) might have been sampled from islands that are geographically close to the Okinawa but are included administratively in Kagoshima prefecture of Kyushu. For BBJ data, geographical location of samples reflect the locations of hospitals where the patients were recruited from. In contrast, we collected DNA from Izumo and Makurazaki individuals only if all four grandparents were residents of their respective regions, a similar strategy employed in a study of British populations [28]. Makurazaki is located at the southern tip of Kyushu (see Fig. 1) and Fig. 3 shows that individuals of this city are located slightly nearer to the Okinawa cluster. Fig. 3 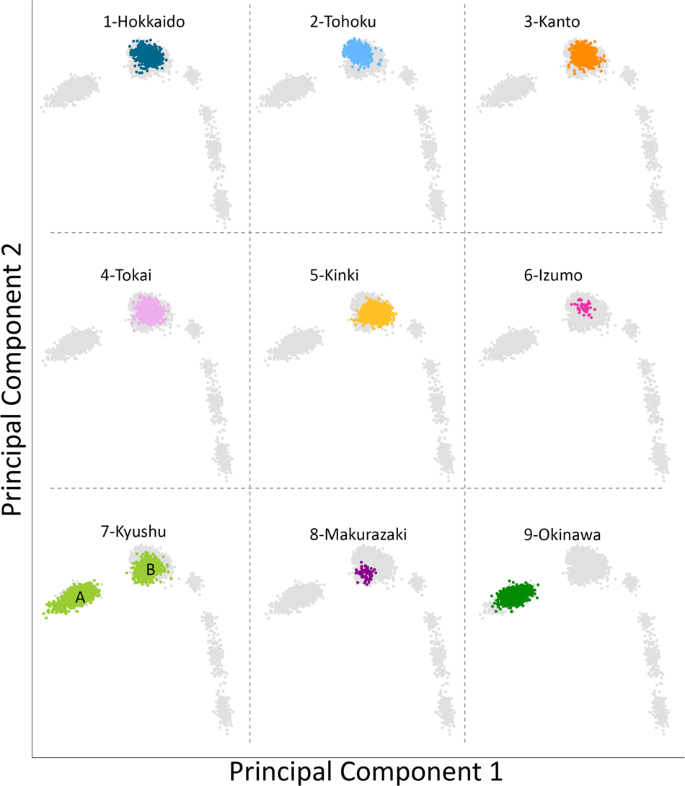 Principal component analysis (PCA) plots of individuals from various regions in Japan corresponding to Fig. 1 map. Non-Japanese individuals are indicated by gray dots. Two major clusters were observed in the BioBank Japan Kyushu cohort, labeled A and B, respectively The results of admixture analysis [23] when k (number of ancestral components) equals to nine is shown in Fig. 4. Cross validation errors for other values k are shown in Supplementary Fig. 3. The main ancestry components in Yaponesians (more than 10%) are indicated in brown, light blue and dark green colored ancestry components. The light blue ancestry component is highest in northern East Asians (CHB and Koreans) and on average 17% in Yaponesians except for individuals belonging to Okinawa and Kyushu-A. Another ancestry component (brown) is present at 42% in Yamato and 25% in Koreans but very low in Okinawa, Kyushu-A, and other Asian populations. The dark green ancestry component is highest in Okinawans, and Yamato populations consistently have this component, whereas the yellow ancestry component is highest among Kyushu-A population. |
|


