|
|
Post by Admin on Oct 28, 2015 13:14:40 GMT
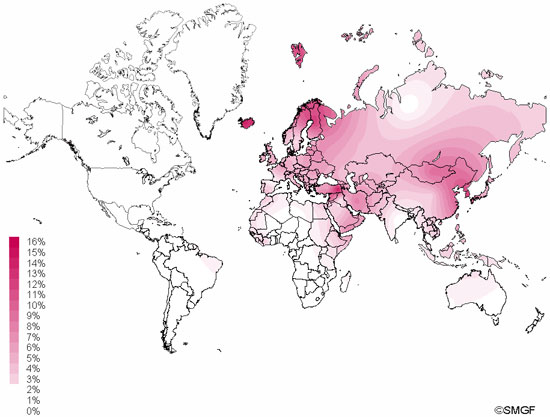 Haplogroup N (mtDNA) Haplogroup N (mtDNA) is the ancestral haplogroup to almost all European haplogroups and Jomon haplogroup frequencies are 50% (n = 2) for N9b and 50% (n = 2) for M7a2, which are called the Jomon genotype. While Haplogroup M is an Asian mtDNA haplogroup, Haplogroup N is a West Eurasian (Caucasian) mtDNA haplogroup, which can be also found at high frequencies in Scandinavia, and it can be considered that the Jomon people were half Caucasian in their genetic heritage. A 2003 sequencing on the mitochondrial DNA of two Cro-Magnons (Paglicci 52 and Paglicci 12) further identified the mtDNA as Haplogroup N. We investigated mitochondrial DNA haplogroups of four Jomon individuals from the Sanganji shell mound in Fukushima, Tohoku district, Japan. Partial nucleotide sequences of the coding and control region of mitochondrial DNA were determined. The success rate of sequencing increased when we analyzed short DNA sequences. We identified haplogroups from all four samples that were analyzed; haplogroup frequencies were 50% (n = 2) for N9b and 50% (n = 2) for M7a2. Haplogroup N9b has been previously observed in high frequencies in the other Tohoku Jomon, Hokkaido Jomon, Okhotsk, and Ainu peoples, whereas its frequency was reported to be low in the Kanto Jomon and the modern mainland Japanese. Sub-haplogroup M7a2 has previously been reported in the Hokkaido Jomon, Okhotsk, and modern Udegey (southern Siberia) peoples, but not in the Kanto Jomon, Ainu, or Ryukyuan peoples. Principal component analysis and phylogenetic network analysis revealed that, based on haplogroup frequencies, the Tohoku Jomon was genetically closer to the Hokkaido Jomon and Udegey people, than to the Kanto Jomon or mainland modern Japanese. The available evidence suggests genetic differences between the Tohoku and Kanto regions in the Jomon period, and greater genetic similarity between the Tohoku Jomon and the other investigated ancient (Hokkaido Jomon, Okhotsk) and modern (Siberian, Udegey in particular) populations. At the same time, the Tohoku and Hokkaido Jomon seem to differ in sub-haplotype representations, suggesting complexity in Jomon population structure and history. 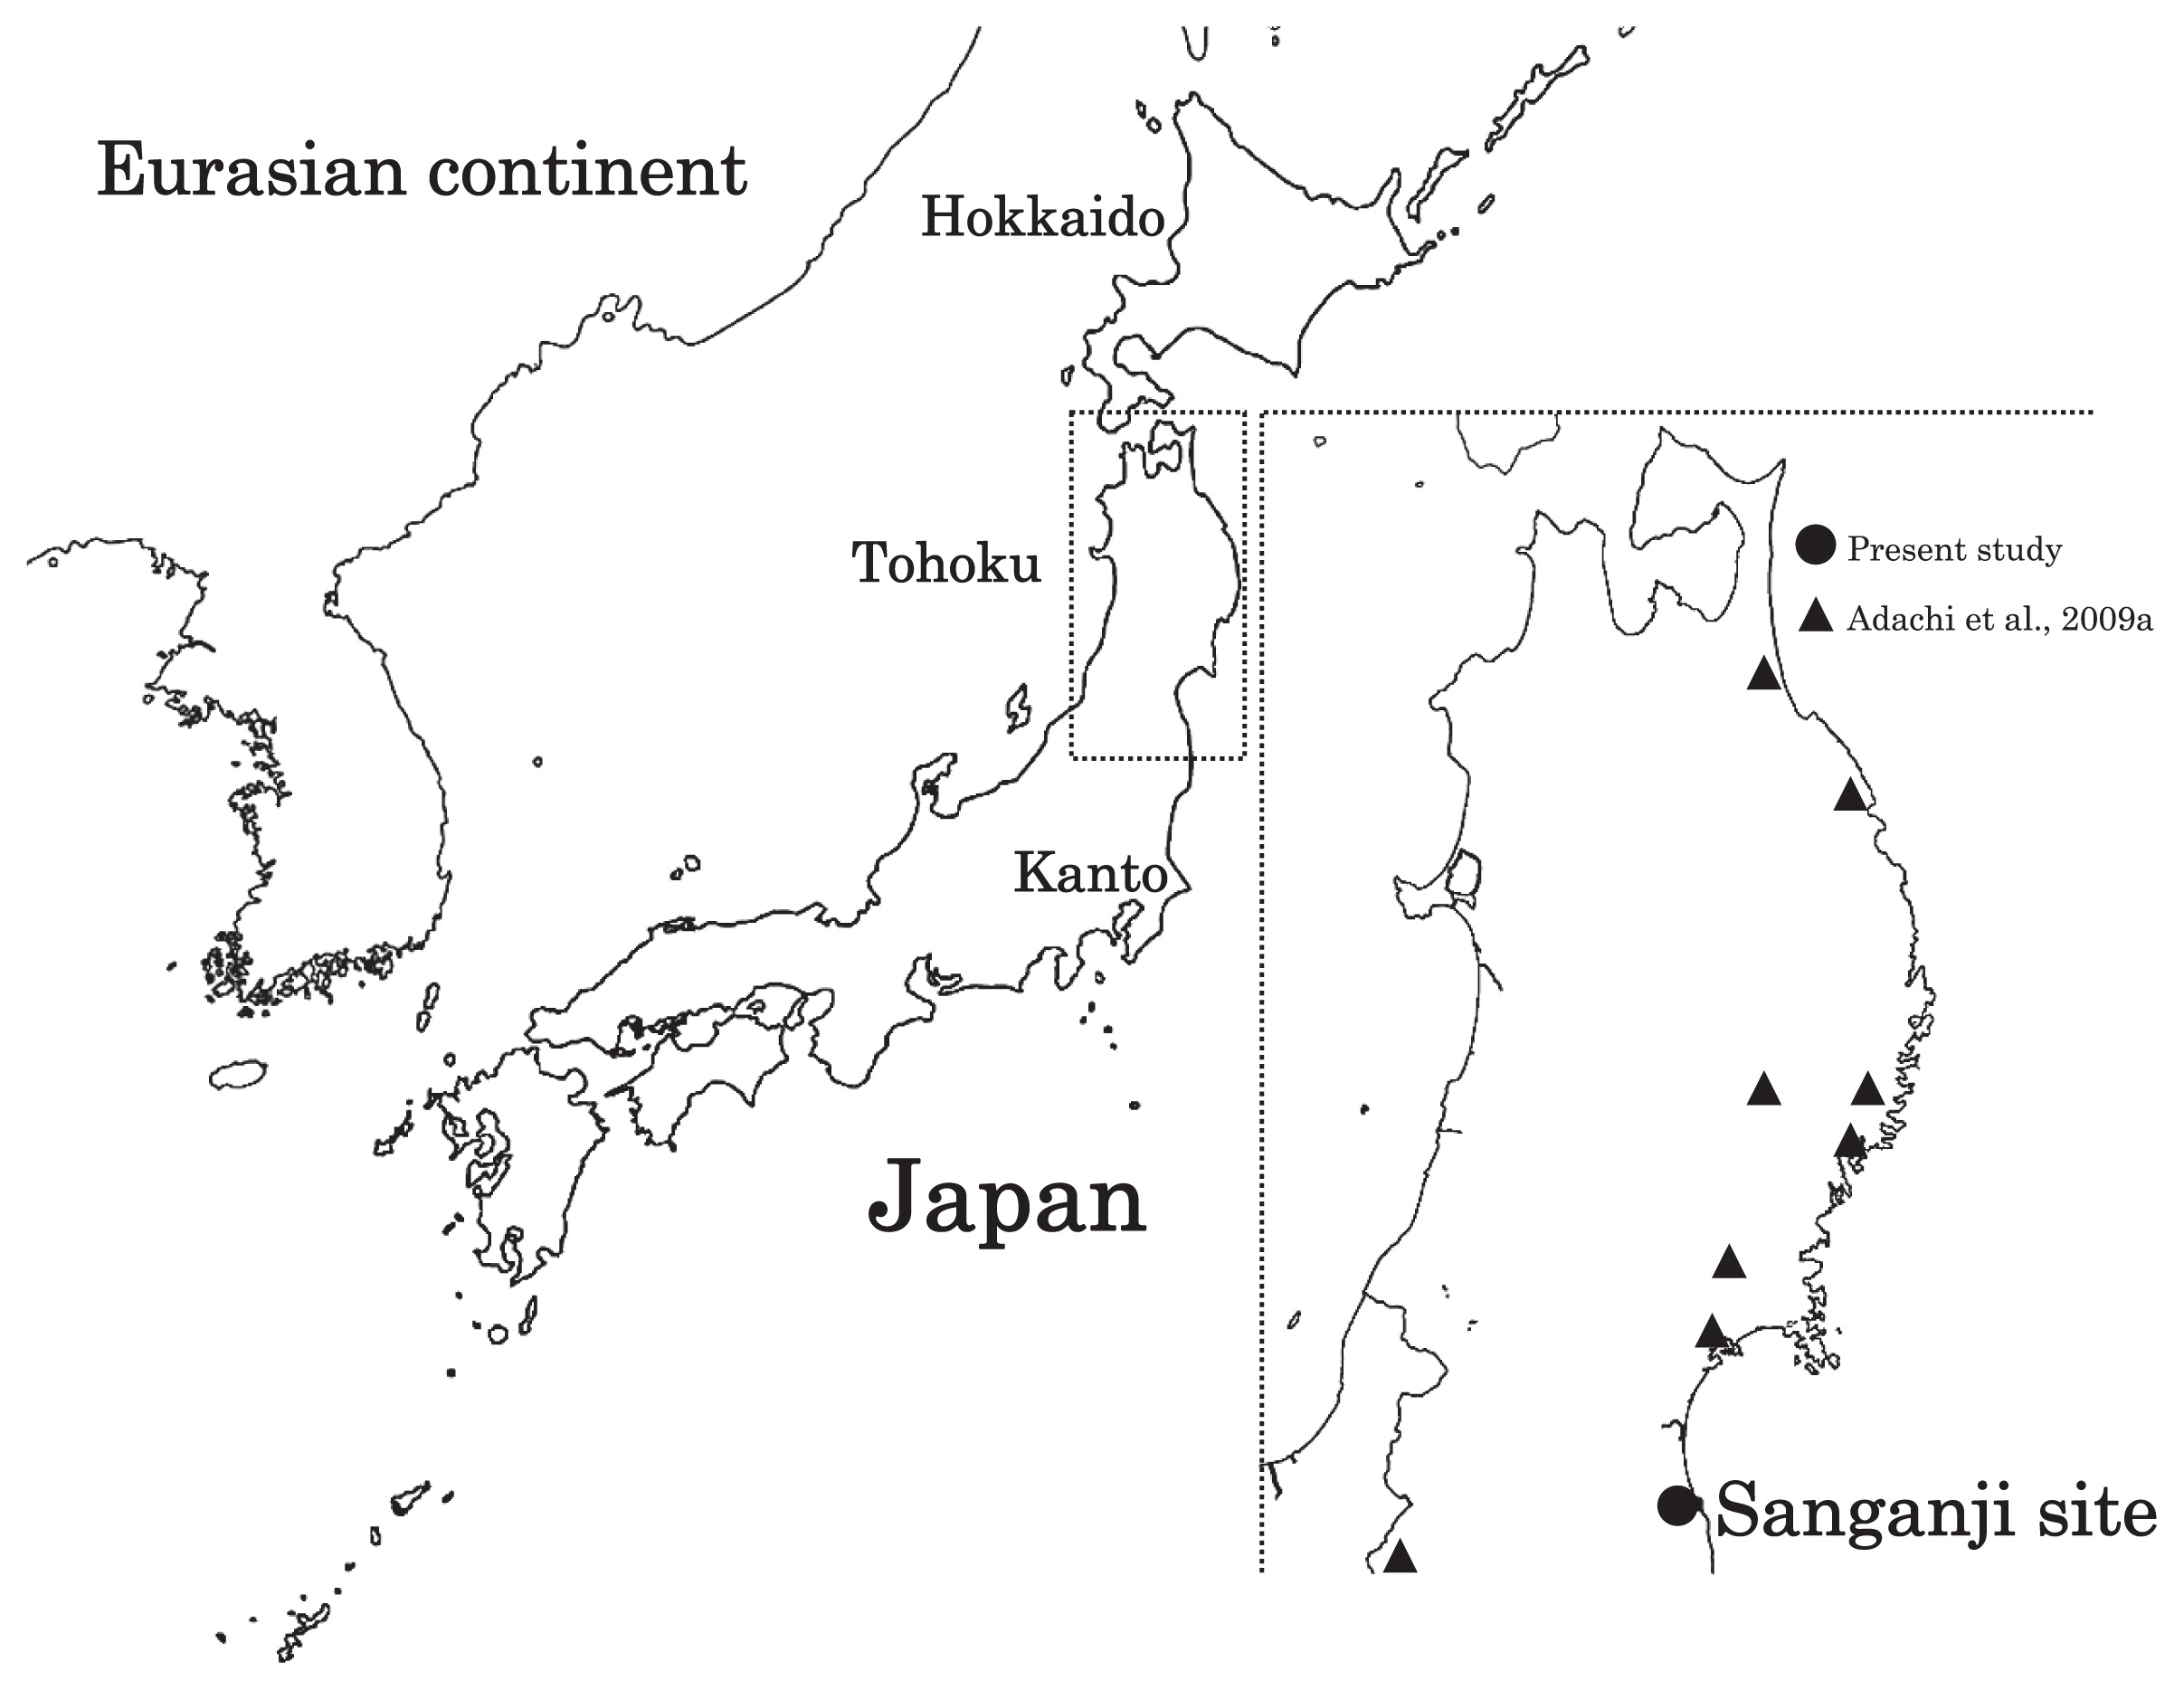 Figure 1 Geographical location of Sanganji site, and other sites of Tohoku Jomon people. Two of the four Sanganji Jomon individuals belonged to haplogroup N9b (Table 5, Table 6). Haplogroup N9b has been observed in the northern Jomon populations at high frequencies: Hokkaido Jomon, 64.8% (Adachi et al., 2011); Tohoku Jomon, 63.2% (Adachi et al., 2009a); and we found this haplogroup in high frequency (50.0%) in the Sanganji Jomon, although based on a small sample size. On the contrary, the frequency of haplogroup N9b was low in the Kanto Jomon at 5.6% (Shinoda and Kanai, 1999, Shinoda, 2003). In modern populations, haplogroup N9b is present in the Japanese archipelago at low frequencies (<10%) (Maruyama et al., 2003; Tajima et al., 2004; Umetsu et al., 2005), but at a high frequency (30.4%) in the Udegey from southern Siberia. It seems that haplogroup N9b was one of the main haplogroups in ancient and modern Northeast Asian populations. We further subdivided the haplogroup N9b observed in the two Sanganji Jomon individuals using specific primers into four sub-haplogroups (N9b1, N9b2, N9b3, and N9b*) (Table 4). Samples which could not be designated to sub-haplogroups N9b1, N9b2, and N9b3 were classified as sub-haplogroup N9b*. Of the two Sanganji Jomon samples, one was classified as sub-haplogroup N9b2 and another was classified as sub-haplogroup N9b*. In the Hokkaido Jomon, although sub-haplogroup N9b* was observed, sub-haplogroup N9b2 has so far not been observed. The Sanganji results may hint at some population differentiation among the northern Jomon populations. 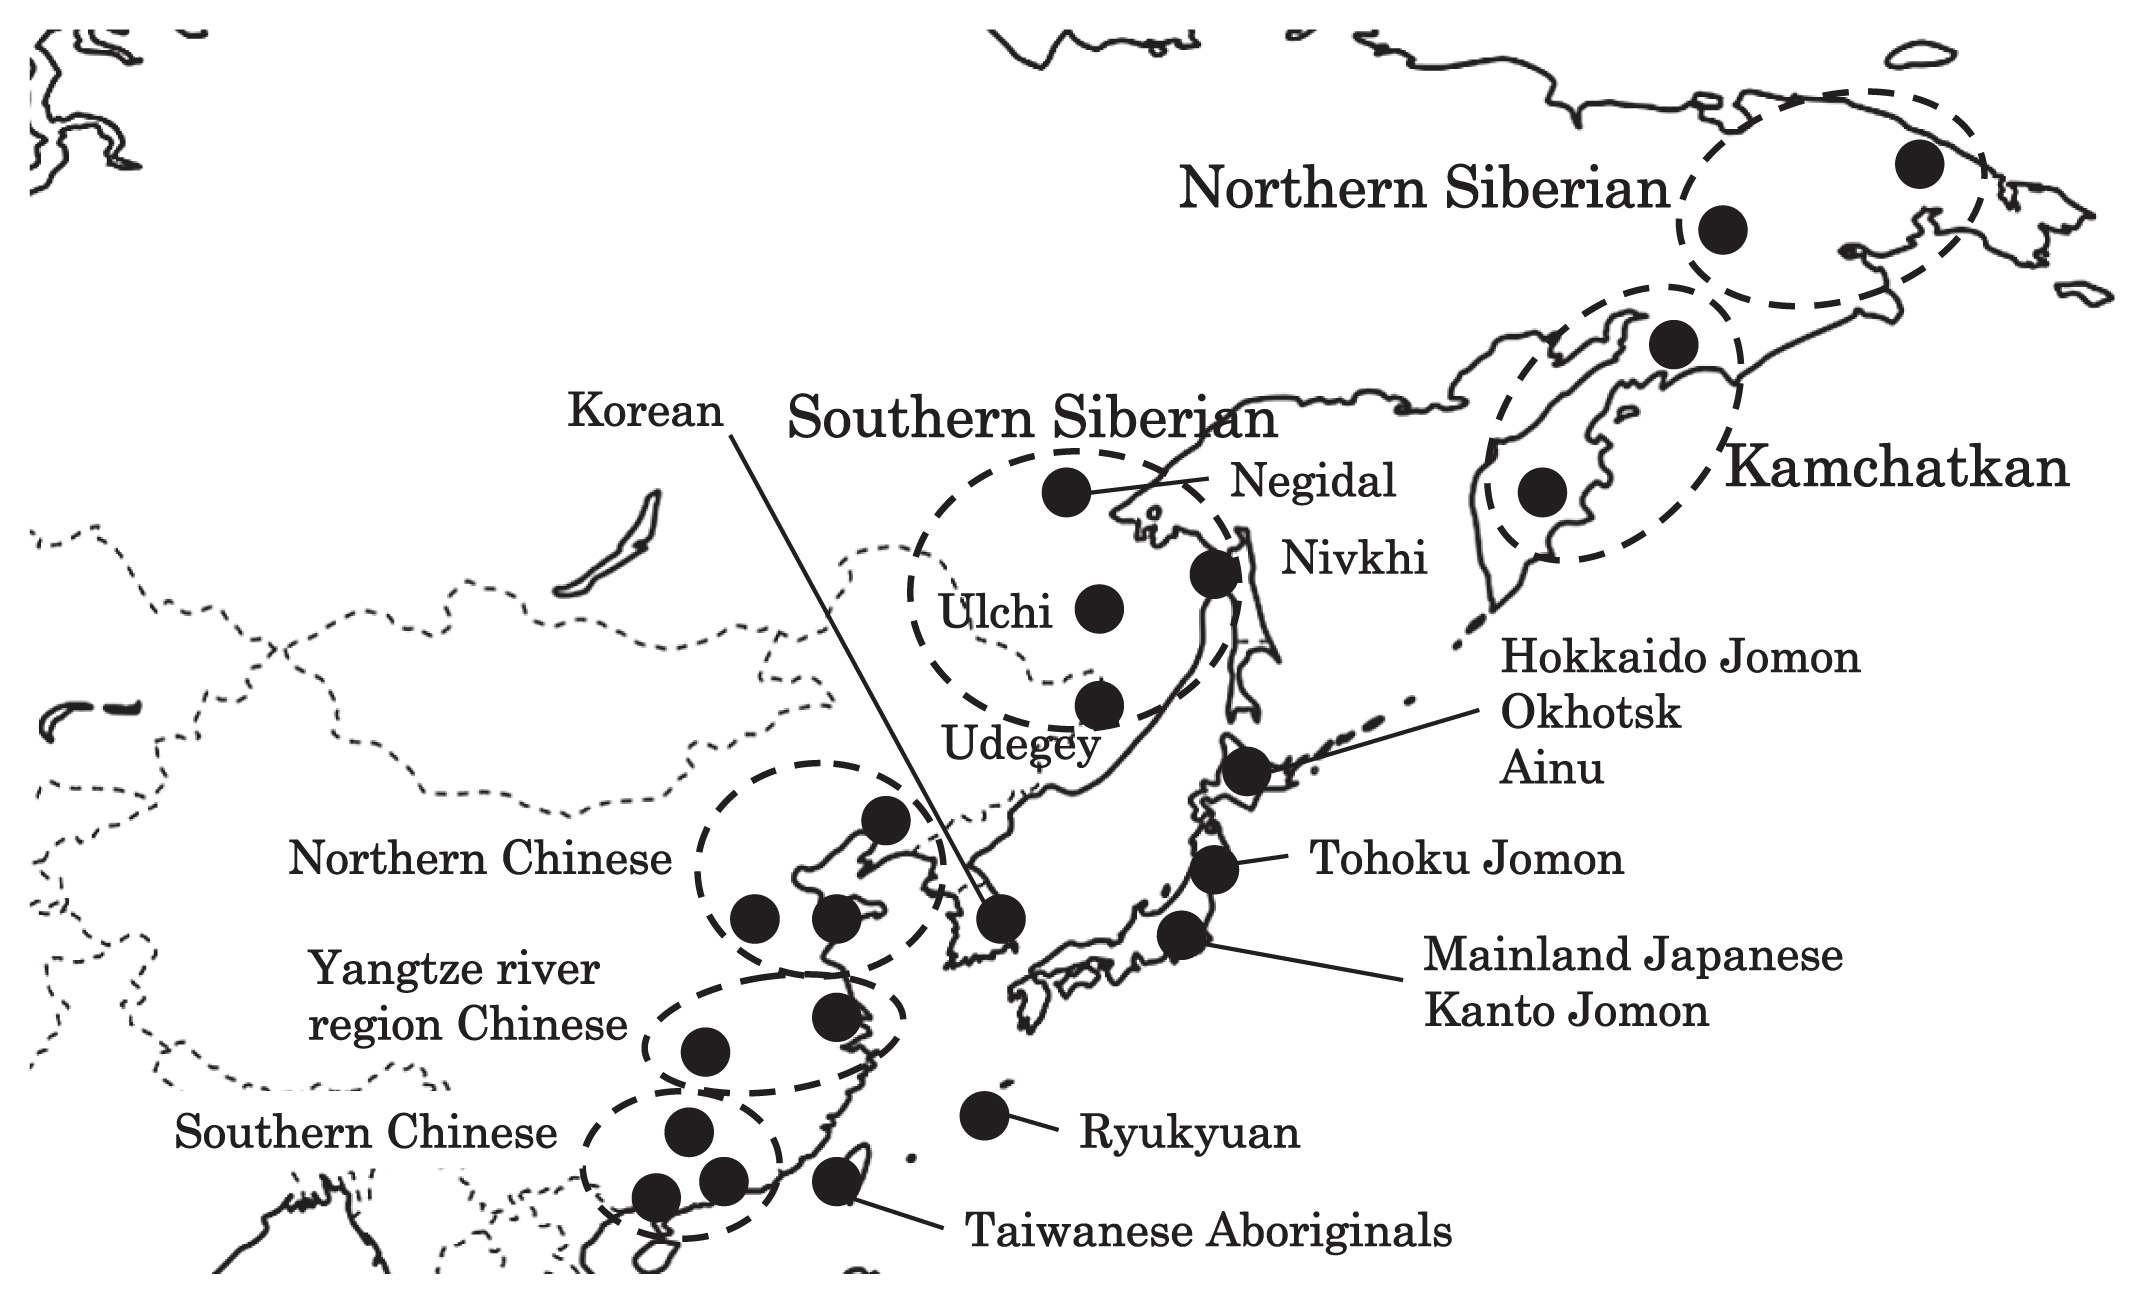 Figure 2 A map of East Eurasia and geographic locations of the East Asian and Siberian populations compared in the present study. Haplogroup M7a is classified into three sub-haplogroups, M7a1, M7a2, and M7a*. Individuals who were not classified into sub-haplogroups M7a1 and M7a2 were classified into sub-haplogroup M7a*. We found that two Sanganji individuals belonged to haplogroup M7a2 (Table 5, Table 7). In modern populations, haplogroup M7a1 was observed in modern Japanese populations at a high frequency: Ainu, 15.7% (Tajima et al., 2004); mainland Japanese, 9.5% (Maruyama et al., 2003); Ryukyuan, 26.6% (Horai et al., 1996, Matsukusa et al., 2010). However, haplogroup M7a2 was scarcely observed in the mainland Japanese (0.5%), and this haplogroup was not observed in the Ryukyuan. On the contrary, haplogroup M7a2 was observed in the Udegey from southern Siberia at high frequency (19.6%, Starikovskaya et al., 2005). Adachi et al. (2009a) mentioned that three regional Jomon populations shared some haplogroups (M7a and N9b), and that genetic similarity decreased gradually with increased geographical distance. However, since sub-haplogroups M7a2 and N9b2 have so far not been shown to be shared between the Tohoku and Kanto Jomon people, it may be that, in terms of the maternal lineage, the gene flow between the geographically close Tohoku and Kanto regions was limited in the Jomon period. In addition, in the population comparison analysis, although we found genetic similarity between the Hokkaido and Tohoku Jomon, so far they lack shared haplogroups at the sub-haplogroup level (M7a*, D4h2, and G1b of the Hokkaido Jomon were not seen in the Tohoku Jomon, and N9b2 and D4b of the Tohoku Jomon were not seen in the Hokkaido Jomon). Again, this may be indicating comparatively limited gene flow in the Jomon period. This interpretation is consistent with the results of the population differentiation test, and the observation of inter-regional heterogeneity among the ancient Japanese archipelago populations. However, the above interpretations need to be confirmed and refined by larger samples of sub-haplogroup determinations and better temporal control of the Jomon materials. Compared to modern East Asian populations, the Tohoku and Hokkaido Jomon people were genetically close to the Udegey of southern Siberia (Udegey and Tohoku Jomon, Fst = 0.088, P = 0.01; Udegey and Hokkaido Jomon, Fst = 0.138, P = 0.00) (Appendix 2). The Udegey is also geographically closer to the Jomon populations than are the other southern Siberian populations (Figure 2). In the phylogenetic network shown in Figure 4, based on shared mtDNA haplogroups M7a and N9b (Appendix 1), it seems possible that the Udegey represents admixture of southern Siberian populations and the northern (Hokkaido and Tohoku) Jomon people. This implies some degree of gene flow between the Udegey people ancestors and the northern Jomon. Moreover, as we mentioned earlier, haplogroups N9b and M7a2 are hardly observed in the other East Asian populations except in the Japanese archipelago (Table 6, Table 7). One interpretation would be that a northern population with haplogroups N9b and M7a2 migrated into the Tohoku region via Hokkaido, although a southern origin has been considered for the M7a haplotype (see above for discussion of the southern haplogroup hypothesis). This would be compatible with the conclusion of previous studies that the Jomon people were (largely) of northern origin (Nei, 1995; Omoto and Saitou, 1997; Hanihara and Ishida, 2009; Nakashima et al., 2010; Adachi et al., 2011). 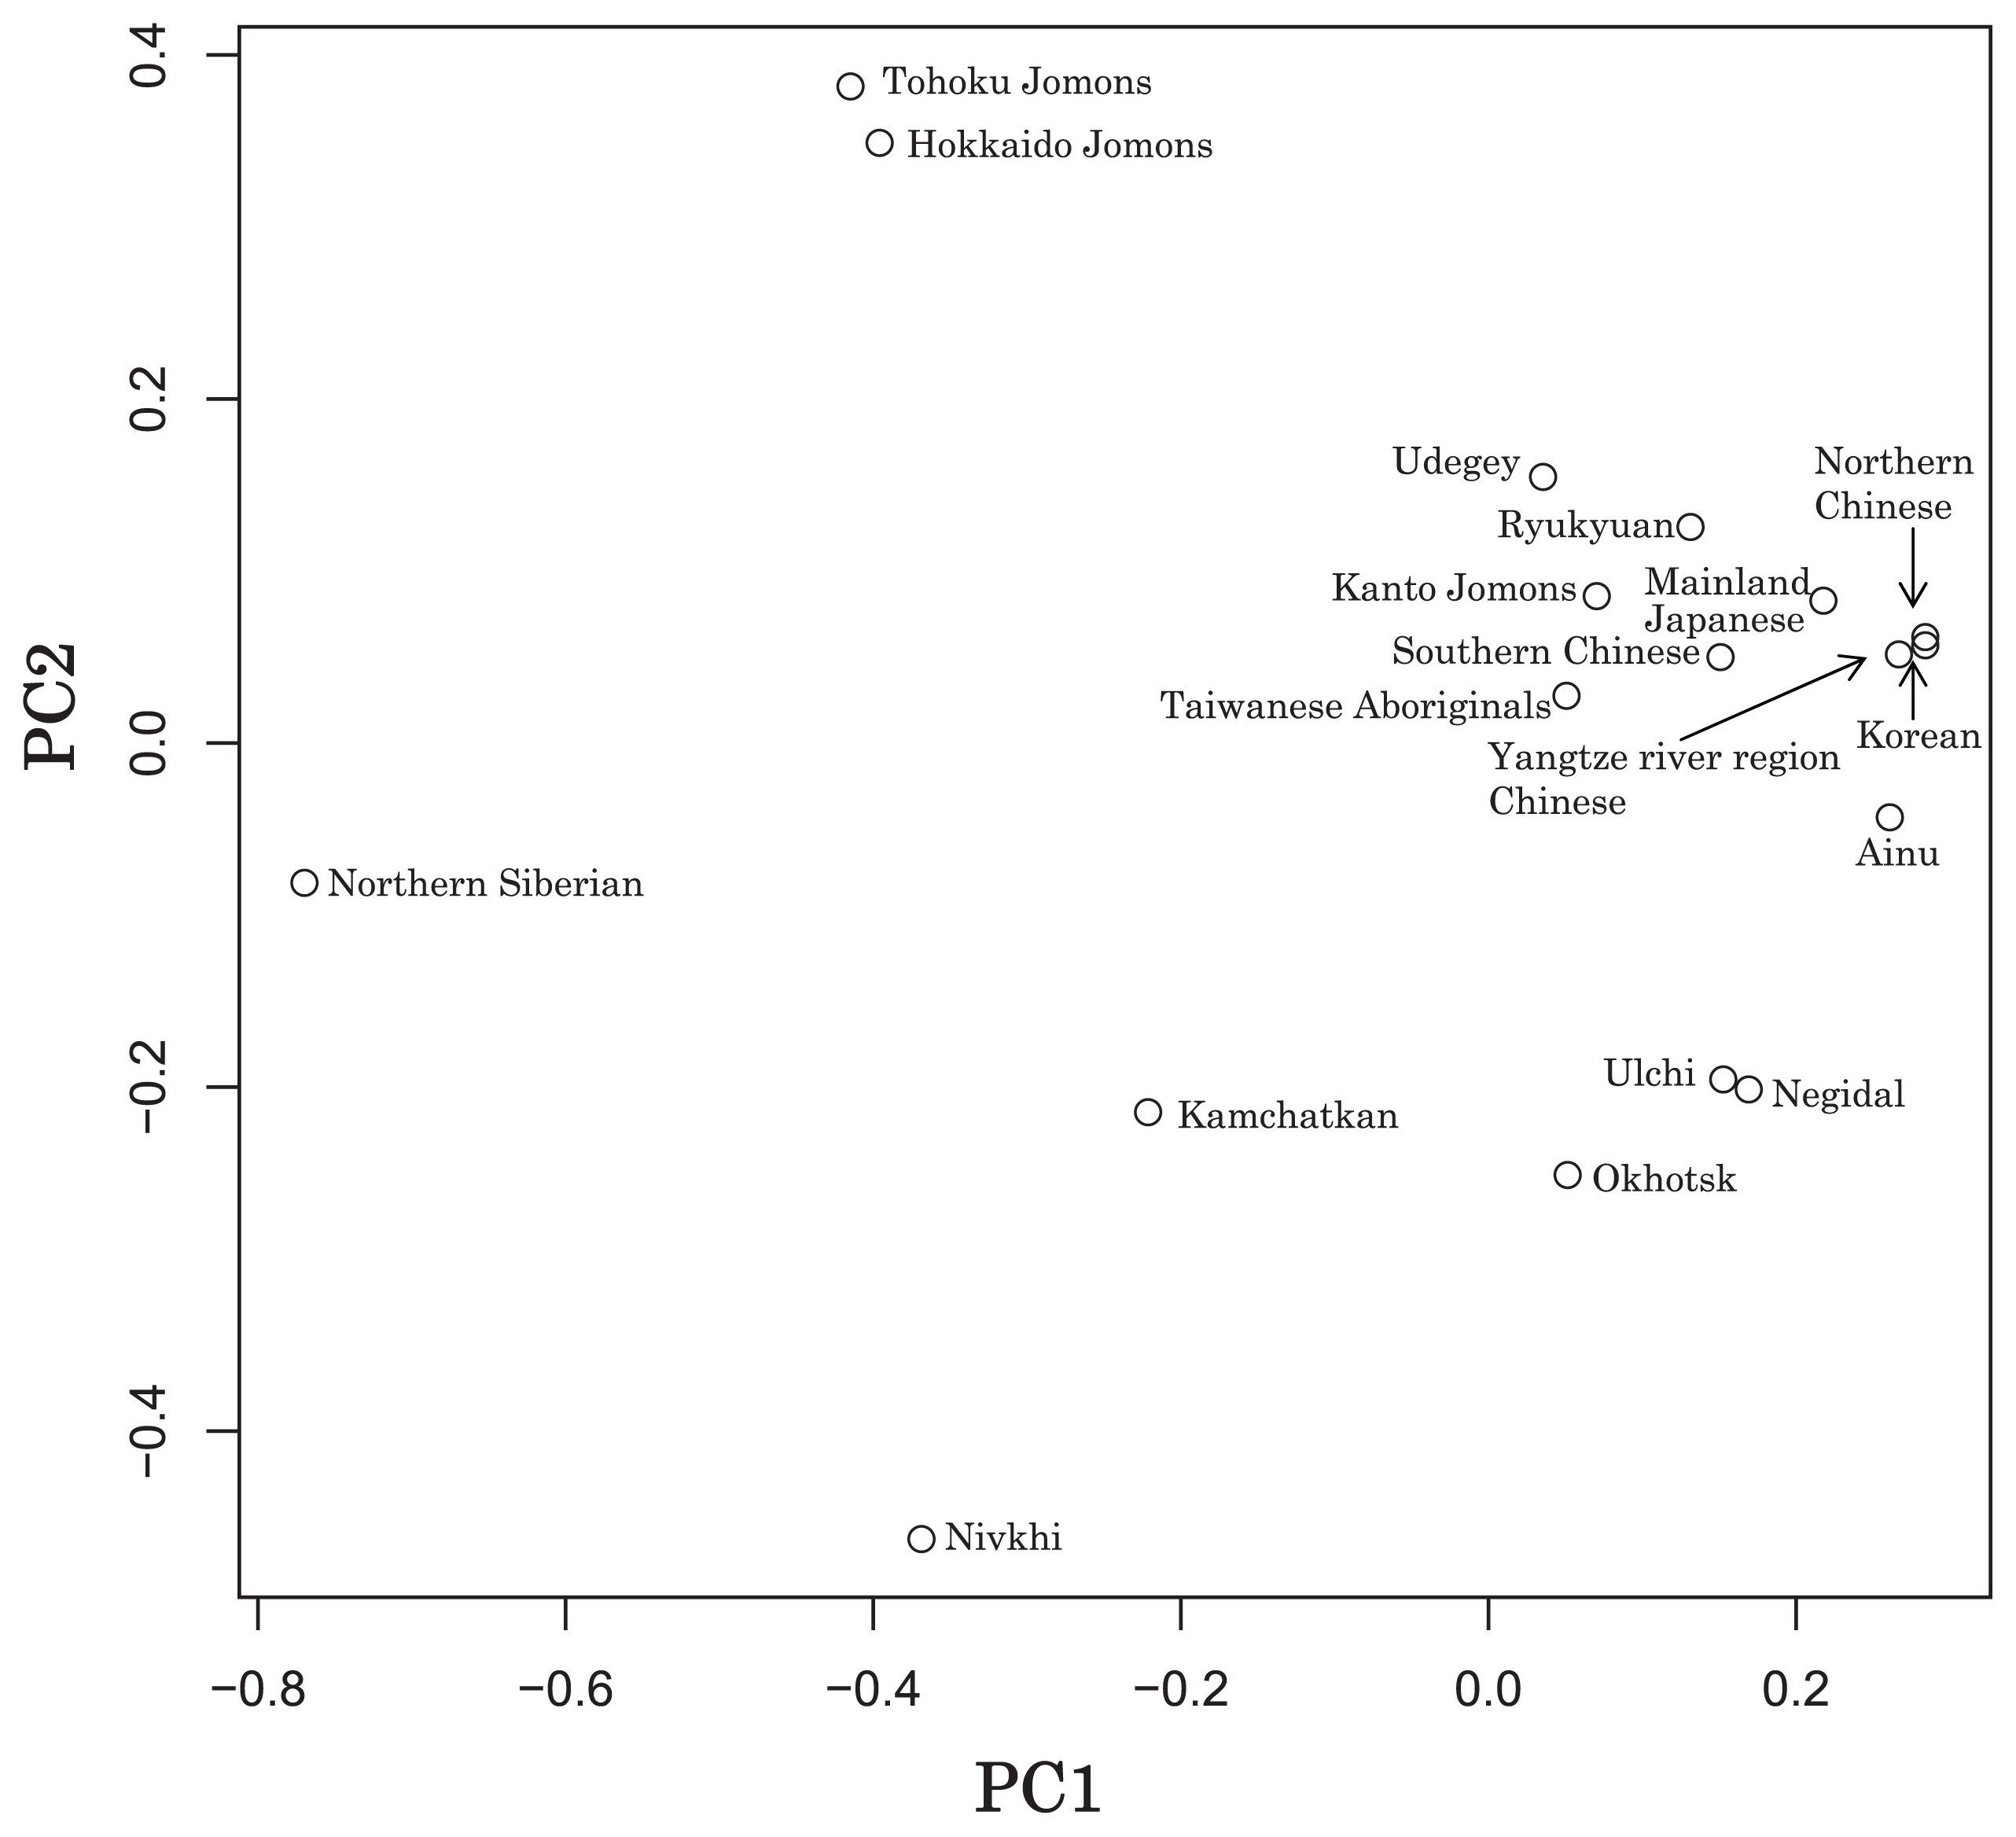 Figure 3 Principle Component Analysis of 18 East Asian populations based on Fst values. The Sanganji results and related analyses presented above suggest that the history of the Jomon people is more complex than previously considered (see also Adachi et al., 2011). Our knowledge of Tohoku and Kanto Jomon sub-haplogroup representations is still limited, and we do not know the genetic background of the Jomon people from west of the Kanto region or the Sea of Japan coastal areas. Therefore, further data accumulation, not only mitochondrial DNA but also nuclear DNA (Sato et al., 2010; Kazuta et al., 2011), and ancient DNA analysis based on larger samples with both adequate temporal control and more extensive geographical regions are necessary to clarify an apparently complex Jomon population history. Moreover, since next-generation sequencing technology makes it possible to analyze tiny amounts of ancient DNA (e.g. Green et al., 2010), it is quickly becoming practicable to analyze not only Jomon mtDNA, but also nuclear DNA, which contains much more genetic information. Since the success rate of mtDNA haplotyping of four Sanganji Jomon samples was 100%, skeletal remains materials from sites such as Sanganji may also contain nuclear DNA. With this prospect of an expanded range of materials suitable for ancient nuclear DNA analysis with the emergence of next-generation sequencing, further studies on the Tohoku and other Jomon materials may enable a better resolution to the issues discussed herein. 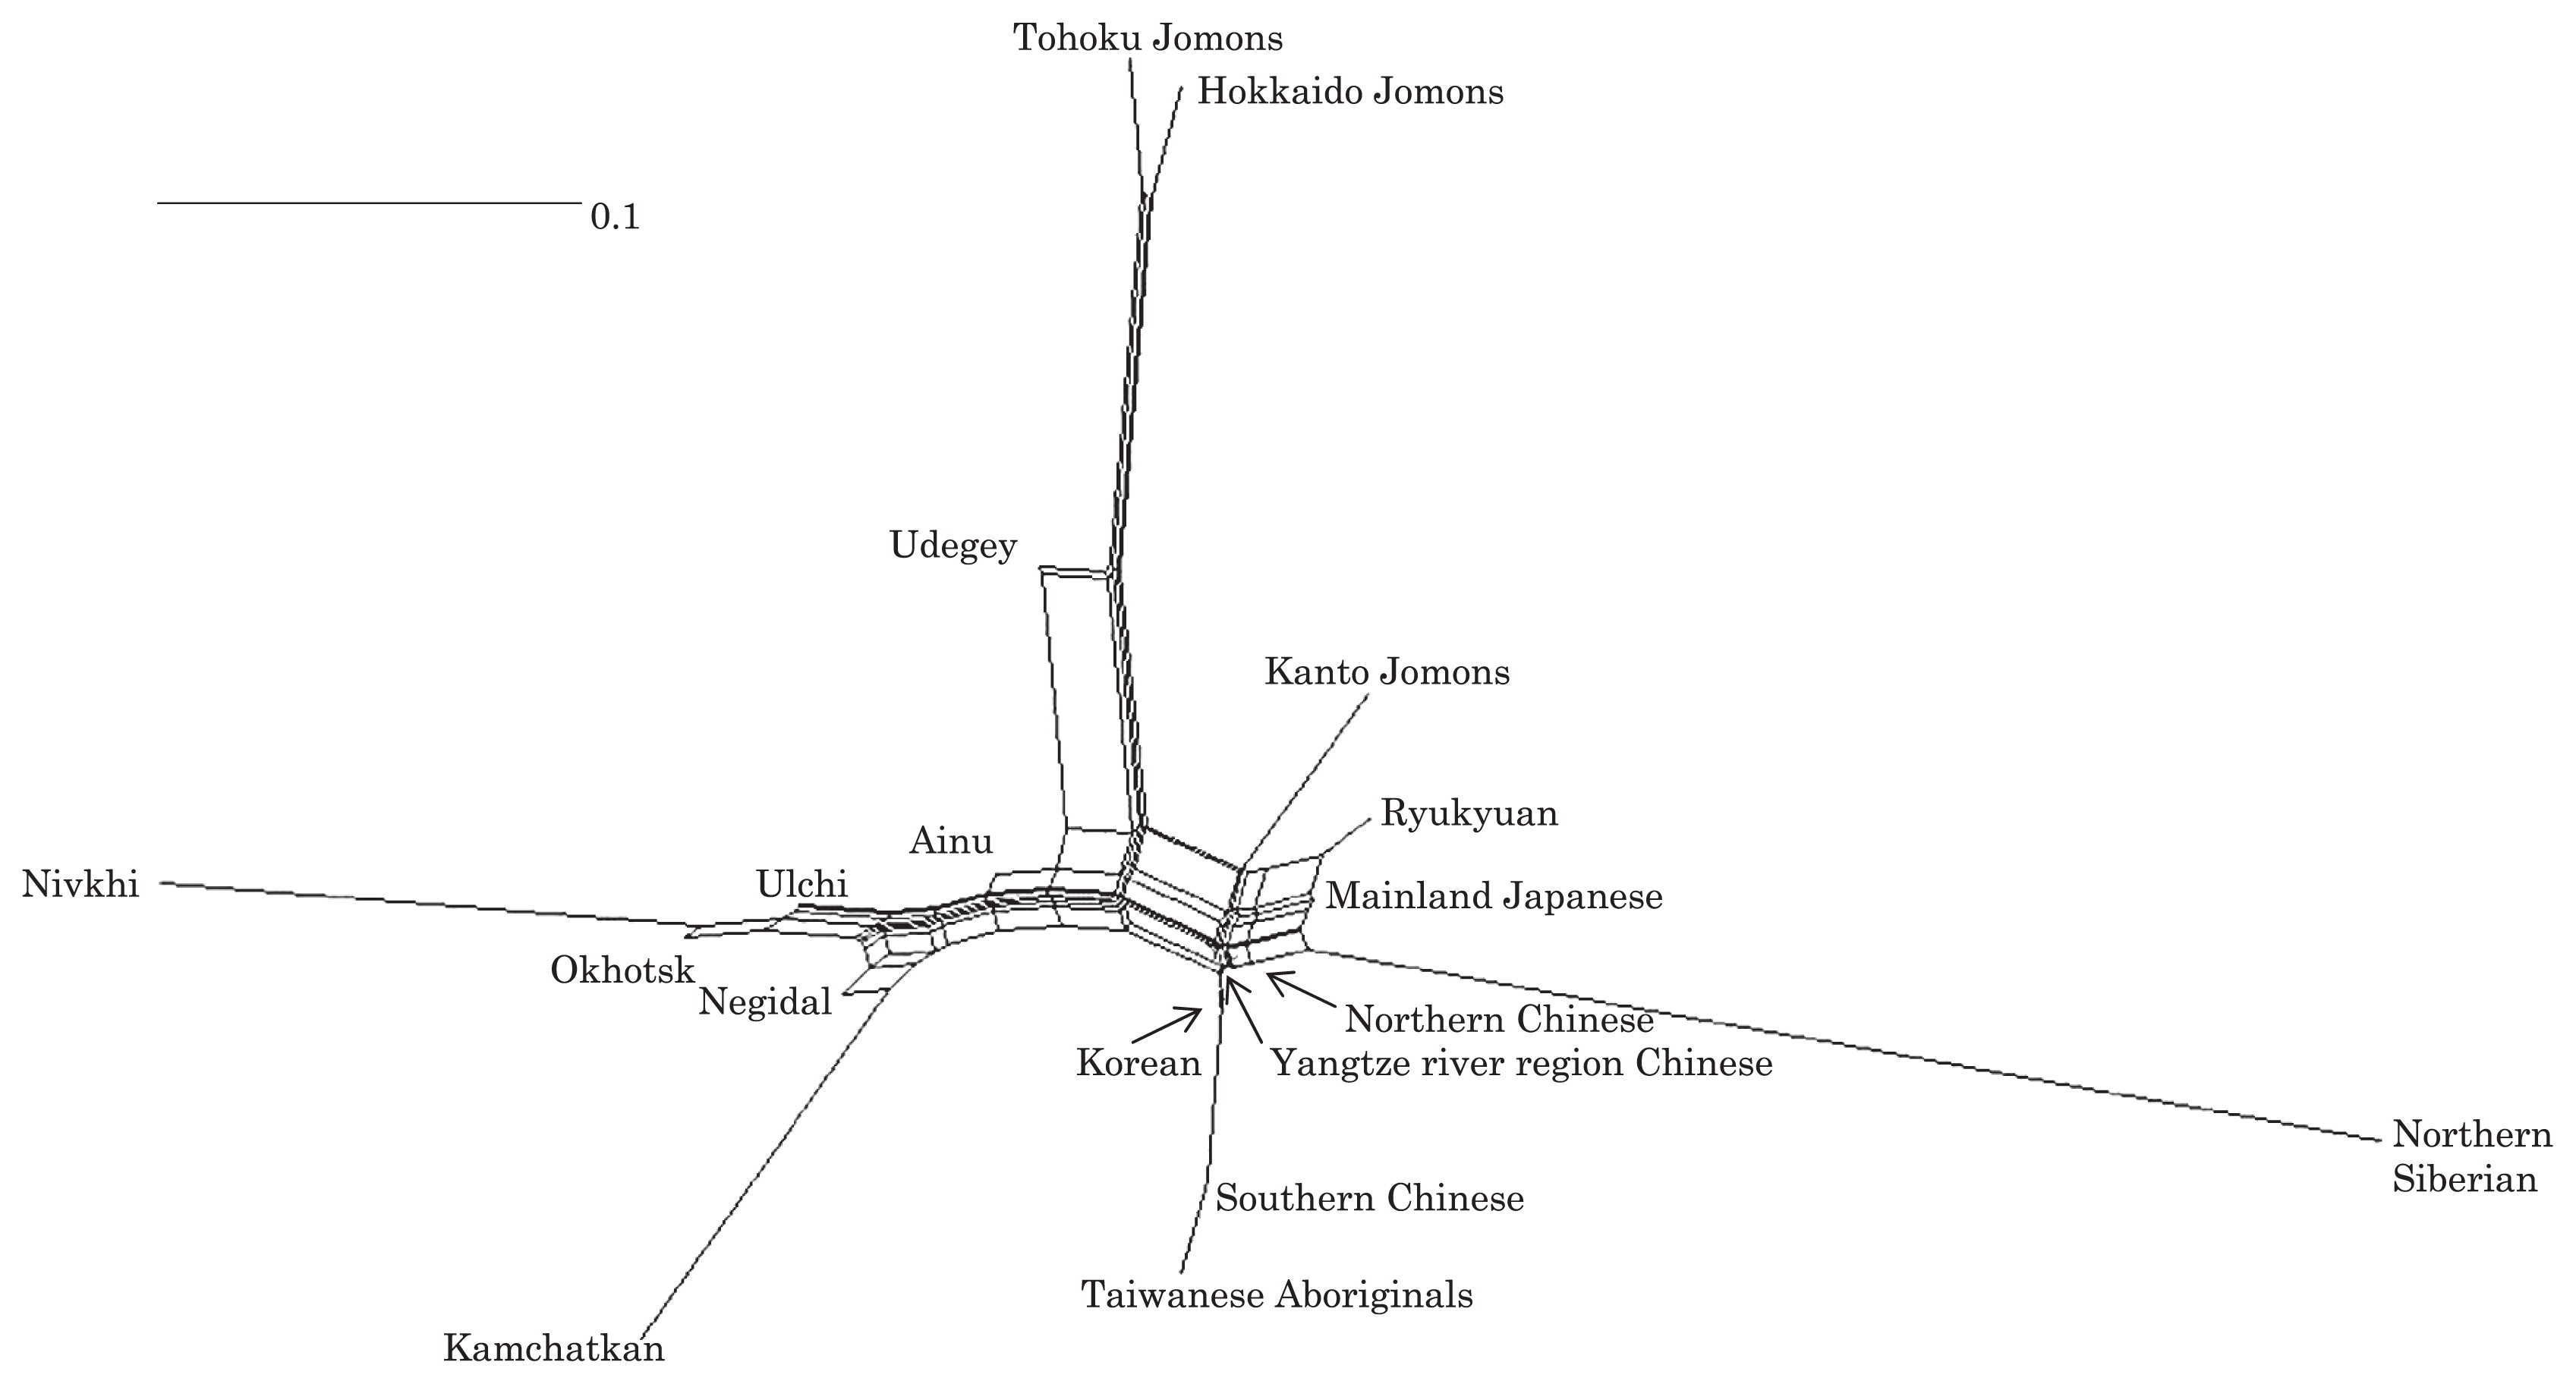 Figure 4 Phylogenetic network of 18 East Asian populations based on Fst values. Our observation of genetic similarity between the Tohoku Jomon and some of the indigenous southern Siberian peoples is compatible with previous interpretations that the Jomon people originated in Northeast Asia. However, statistical analysis of Jomon populations suggests: (1) the existence of inter-regional heterogeneity within the Jomon people; (2) genetic similarity among the two northern Jomon populations (Tohoku and Hokkaido) much more so than with the Kanto Jomon, implying comparatively limited gene flow between the Kanto and more northern regions; and (3) despite their relative closeness, the presence of sub-haplotype differences between the two northern Jomon populations. The emerging implication seems that the history of the Jomon people may have been more complex than previously considered. In the modern Japanese, mtDNA haplogroups N9b and M7a2, common in the Sanganji and Hokkaido Jomons, are uncommon. Therefore, it seems that the genetic influence of the northern Jomon populations to the modern mainland Japanese is limited in the maternal linage. However, the samples analyzed in the present study are limited, and current and previous reports are confined mostly to Jomon skeletal materials of the east coast of the Tohoku region. In order to clarify the characteristics of the Tohoku Jomon as well as their genetic influence on modern populations, larger and geographically wider-based samples need to be investigated. Anthropological Science Vol. 121 (2013) No. 2 p. 89-103 doi.org/10.1537/ase.121113 |
|
|
|
Post by Admin on Nov 16, 2015 9:04:20 GMT
 The genetic origins of Japanese populations have been controversial. Upper Paleolithic Japanese, i.e. Jomon, developed independently in Japanese islands for more than 10,000 years until the isolation was ended with the influxes of continental immigrants about 2,000 years ago. However, the knowledge of origin of Jomon and its contribution to the genetic pool of contemporary Japanese is still limited, albeit the extensive studies using mtDNA and Y chromosomes. In this report, we aimed to infer the origin of Jomon and to estimate its contribution to Japanese by fitting an admixture model with missing data from Jomon to a genome-wide data from 94 worldwide populations. Our results showed that the genetic contributions of Jomon, the Paleolithic contingent in Japanese, are 54.3∼62.3% in Ryukyuans and 23.1∼39.5% in mainland Japanese, respectively. Utilizing inferred allele frequencies of the Jomon population, we further showed the Paleolithic contingent in Japanese had a Northeast Asia origin. The upper Paleolithic populations, i.e. Jomon, reached Japan 30,000 years ago from somewhere in Asia when the present Japanese Islands were connected to the continent8. The separation of Japanese archipelago from the continent led to a long period (∼13,000 – 2,300 years B.P) of isolation and independent evolution of Jomon9. The patterns of intraregional craniofacial diversity in Japan suggest little effect on the genetic structure of the Jomon from long-term gene flow stemming from an outside source during the isolation10. The isolation was ended by large-scale influxes of immigrants, known as Yayoi, carrying rice farming technology and metal tools via the Korean Peninsula. The immigration began around 2,300 years B.P. and continued for the subsequent 1,000 years5. Based on linguistic studies, it is suggested that the immigrants were likely from Northern China, but not a branch of proto-Korean11. Genetic studies on Y-chromosome and mitochondrial haplogroups disclosed more details about origins of modern Japanese. In Japanese, about 51.8% of paternal lineages belong to haplogroup O6, and mostly the subgroups O3 and O2b, both of which were frequently observed in mainland populations of East Asia, such as Han Chinese and Korean. Another Y haplogroup, D2, making up 35% of the Japanese male lineages, could only be found in Japan6,12. The haplogroups D1, D3, and D*, the closest relatives of D2, are scattered around very specific regions of Asia, such as the Andaman Islands, Indonesia, Southwest China, and Tibet13. In addition, C1 is the other haplogroup unique to Japan6,12. It was therefore speculated that haplogroups D2 and O may represent Jomon and Yayoi migrants, respectively6. However, no mitochondrial haplotypes, except M7a, that shows significant difference in distribution between modern Japanese and mainlanders5. Interestingly, a recent study of genome-wide SNPs showed that 7,003 Japanese individuals could be assigned to two differentiated clusters, Hondo and Ryukyu, further supporting the notion that modern Japanese may be descendent of the admixture of two different components7. 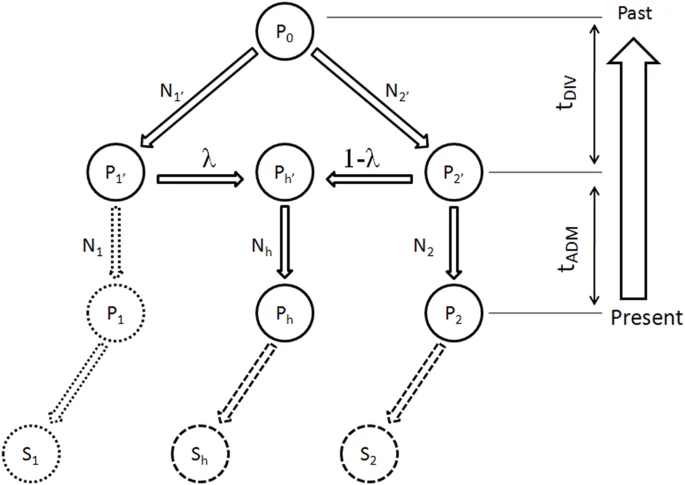 Figure 1: Demographic model of population admixture with missing population. The original genetic donor to Yayoi migration is still controversial, both Korean and Chinese (northern or southern Han) were potential candidates5,18. Since genetic difference exists between northern and southern Han Chinese populations19, we examined the possible contribution of both northern Han Chinese (NH, combining data of CHB in HapMap project and NHan in HGDP) and southern Han Chinese (SH, combining data of CN-SH in PanAsia SNP project and SHan in HGDP) respectively in this study. We also examined the contribution of northern East Asian population by combining data of NH and Korean (NHK, including NH and Korean population named KR-KR in PanAsia SNP project) since previous genetic studies differed on whether Koreans were the only immigrants in period of later Jomon and early Yayoi5. Therefore totally three potential genetic sources (NH, SH and NHK) were evaluated respectively as continental genetic donor. The estimated contribution of Jomon to modern Hondo Japanese ranges from 0.231 to 0.395 for different donors (Figure 2). The contribution of Jomon (0.231) is the lowest, when NHK (combination of Northern Han and Korean) was taken as the donor, with 95% confidential interval (C.I.) 0.215–0.266. When NH and SH were taken as donors, estimated contributions were 0.395 (C.I. 0.379–0.421) and 0.376 (C.I. 0.344–0.387), respectively. In contrast, Jomon's contribution in modern Ryukyuans is much greater than that in modern Hondo Japanese, regardless the choice of donors. The estimated contribution are 0.543 (95% C.I. 0.512–0.567), 0.605 (95% C.I. 0.605–0.648) and 0.623 (95% C.I. 0.623–0.671), for NHK, NH, and SH, respectively (Figure 2). 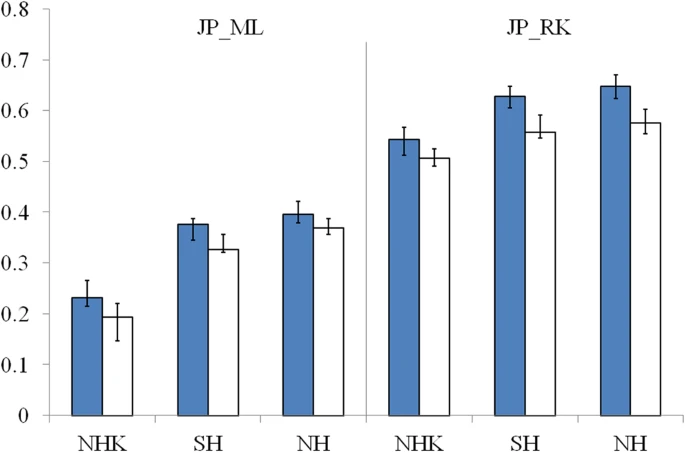 Figure 2: Estimated contributions of Jomon in different genetic scenarios. Combining lines of evidence from the above results and previous reports on both maternal and paternal lineages, none of the three possible donors can be excluded from the model for peopling of Japan. We therefore averaged the above estimations from all three possible donors to assess the proportion of Jomon contribution in modern Japanese. Thus, in Hondo Japanese, 33.4% of genetic component was derived from Jomon, whereas, 60.5% of its genetic component in Ryukyuans may come from Jomon. These estimations based on autosome data are consistent with previous studies using frequencies of Y haplogoups in modern Japanese populations. In particular, overall frequency of Japanese specific Y lineages, D2 and C1, is about 60% in Okinawa (Ryukyu) and 26.4∼46.2% in Japanese mainland6. 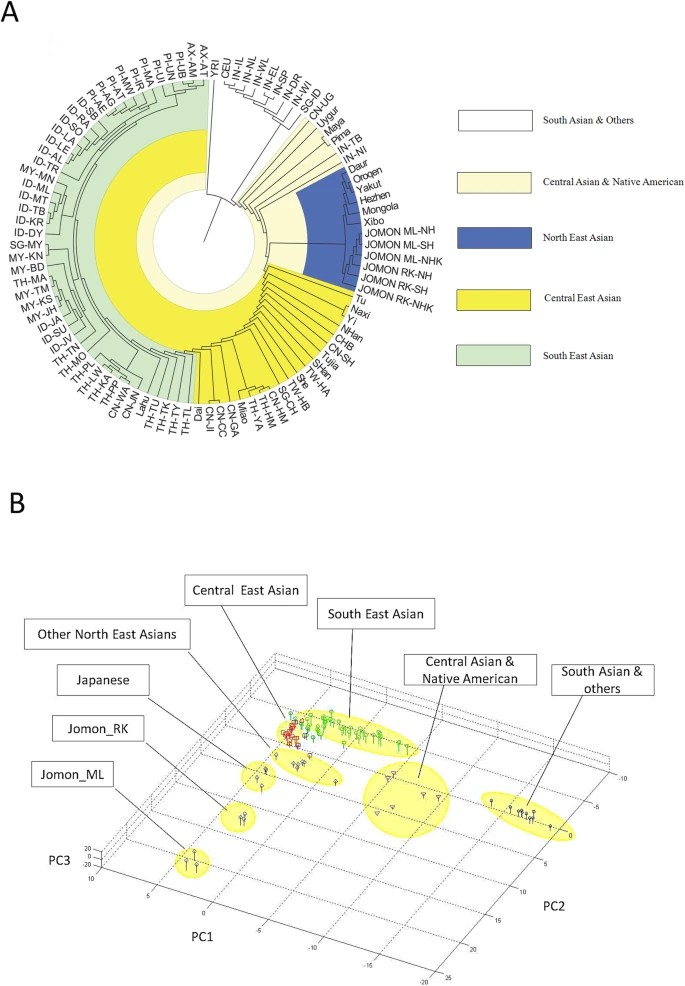 Figure 3: Genetic affinities between Jomon and other Asia populations. Genetic affinity of Jomons With the genetic contribution of Jomon in Ryukyuans and Hondo Japanese being 33.4% and 60.5% respectively, allele frequencies of SNPs of ancestral Jomon populations were inferred using the maximum likelihood (ML) method described in the Materials and Methods section. Overall allele frequencies in 6 virtual Jomon populations (JOMON ML-NH, JOMON ML-SH, JOMON ML-NHK, JOMON RK-NH, JOMON RK-SH and JOMON RK-NHK) were inferred based on two extant Japanese populations, i.e. Hondo and Ryukyuans, and three possible continental donors including NH, SH, and NHK. The inferred allele frequencies of Jomon populations allowed the reconstruction of the phylogeny including Jomon and the extant populations, using coancestry coefficient20 as the measurement of genetic distance and Neighbor-Joining method (NJ) for phylogeny reconstruction. Interestingly, all six inferred Jomon populations fell into the group of Northeast Asian populations but not that of the populations in South Asia or Southeast Asia (Figure 3A). The results of Principle Component Analysis (PCA) confirmed the genetic affinity shown in the NJ tree (Figure 3B). Jomon is therefore genetically closer to North Asian populations than it is to any other populations, suggesting that it is more likely of North Asian origin. The results based on autosomal data do not support the hypothesis of Southeast Asian origin which was proposed by Tuner 2nd (1976)4. In addition, PCA revealed that two modern Japanese are located between mainland Asian populations and Jomon populations, consistent with the notion that they are the descendents of the admixture of mainland Asians and Jomons (Figure 3B). Furthermore, the clustering of Jomon populations inferred from Hondo and Ryukyuan Japanese suggested that their respective Jomon components were of similar, if not identical, origins (Figure 3A &B). Scientific Reports 2, Article number: 355 (2012) doi:10.1038/srep00355 |
|
|
|
Post by Admin on Dec 26, 2015 7:21:11 GMT
 In the Neolithic era, Japan was home to a culture of people known as the Jōmon. A race of hunter-gatherers, the Jōmon are known for their distinctive pottery, which is, according to experts, the oldest pottery in Japan. The pottery, made with unrefined clay and decorated by pressing rope into the surface of the clay before firing, has been found in numerous archaeological sites across Japan. Radiologic dating has shown fragments of the pottery to date back as far as 12700 BCE, though many researchers theorize that it was made even earlier than that time.  It’s amazing that anything that old survives today, and it’s even more amazing that some of it still remains whole. James Koyanagi, a retired architect in Burlington, Ontario, is the owner of a Jōmon vase that dates back to 4000 BCE. Such an object leaves researchers salivating, but due to its extreme age and fragility, close study of the vase hasn’t been possible without incurring damage. Until now, that is.  It wasn’t a simple project. To scan the vase, a high resolution CT scanner would be needed, so the professors reached out to Trillium Health Partners – Mississauga Hospital and Siemens Healthcare, who provided them with the medical-grade scanner they needed. A Siemens SOMATOM Definition Flash CT scanner was used to scan both the inside and outside of the vase, and a 3D CAD model was created. The file was then used to 3D print a copy of the vase in Nylon 12. The result was a perfect replica that can now be examined and studied without the fear of damage. It can also be used to digitally recreate the missing pieces of the vase, which can then be 3D printed. The project involved a large team of people that included both students and professors from Mohawk College, along with healthcare professionals from Sunnybrook Hospital. Tremendous advancements in archaeological research have been made recently thanks to 3D scanning and printing, and the Jōmon project is an example of how archaeology is becoming a much more interdisciplinary field as the technology has advanced. |
|
|
|
Post by Admin on Feb 22, 2016 2:01:21 GMT
 I decided mitochondrial DNA haplotypes from four Sanganji Jomon individuals, and conducted statistical analyses. I found that their mitochondrial DNA haplotypes, M7a and N9b, were unique to modern Japanese. When I compared frequencies of mitochondrial DNA haplotypes of modern East Eurasians and other Jomon populations which were previously reported, I observed that Northern Jomon people were genetically closer to Udegey of Southern Siberia than other continental East Eurasians. This implies that Northern Jomon people originated from Northeast Asia. Microblade culture with Araya type burin was introduced from Northeast Asia into Japanese Archipelago via Sakhalin in the Upper Paleolithic period. The genetic similarity among Northern Jomon people and modern Southern Siberian is therefore plausible 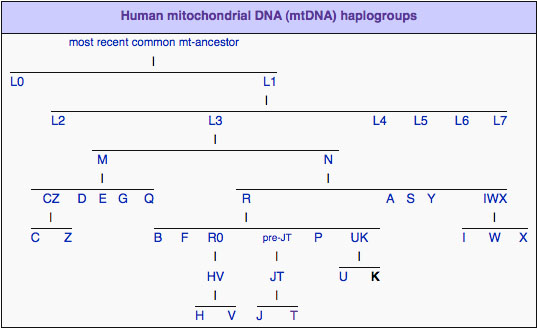 Two of four Sanganji Jomon individuals belonged to haplogroup N9b (Tables 2.6 and 2.7). Haplogroup N9b has been observed in the northern Jomon populations at high frequencies (Hokkaido Jomon, 64.8% (Adachi et al., 2011), Tohoku Jomon, 63.2% (Adachi et al., 2009a)), and I found this haplogroup in high frequency (50.0%) in the Sanganji Jomon, although the sample size was small. On the contrary, the frequency of haplogroup N9b was low in the Kanto Jomon at 5.6% (Shinoda and Kanai, 1999, Shinoda, 2003). In modern populations, haplogroup N9b is present in the Japanese Archipelago at low frequencies (<10%) (Maruyama et al., 2003; Tajima et al., 2004; Umetsu et al., 2005), but at a high frequency (30.4%) in the Udegey from Southern Siberia. It seems that haplogroup N9b was one of the main haplogroups in ancient and modern Northeast Asian populations.  I further subdivided the haplogroups N9b observed in the two Sanganji Jomon individuals using specific primers into four sub-haplogroups (N9b1, N9b2, N9b3, and N9b*) (Table 2.4). Samples which could not be assigned to sub-haplogroups N9b1, N9b2, and N9b3 were classified as sub-haplogroup N9b*. Of the two Sanganji Jomon samples, one was classified as sub-haplogroup N9b2 and another was classified as sub-haplogroup N9b* I also found that Jomon people were genetically heterogeneous in terms of their geographical regions. It is not clear whether this heterogeneity indicates the multi-origin or sub-structure of Jomon people. For investigating their origin and relationship with modern humans based on genomic DNAs, I sequenced 60 million base pairs of nuclear Jomon genomes with next generation sequencer, GAIIx and Hiseq 2000. The Jomon genomic DNA clearly evidenced that Neolithic Jomon people were genetically isolated from modern East Eurasians for a long time, and they diverged from the ancestors of both northern and southern East Eurasians but postdated the divergence of East Eurasian and Melanesians. It implies that the genetic structure of modern East Eurasians was formed after the divergence of Jomon people ancestors and other East Eurasians. 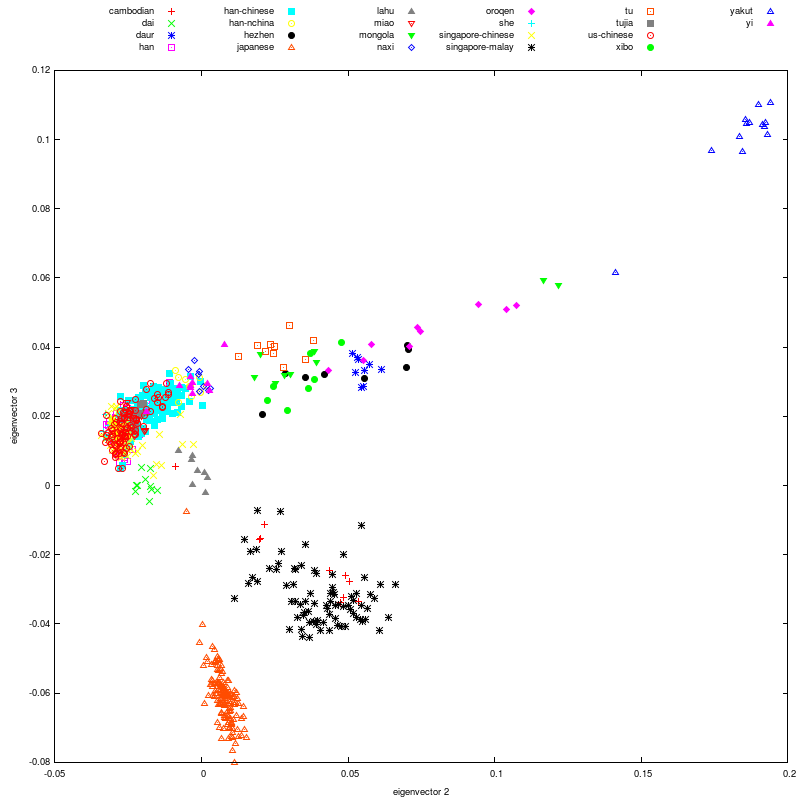 Compared to modern East Asian populations, the Tohoku and Hokkaido Jomon people were genetically close to the Udegey of southern Siberia (Udegey and Tohoku Jomon, Fst =0.088, P =0.01; Udegey and Hokkaido Jomon, Fst = 0.138, P =0.00) (Table 2.9). The Udegey is also geographically closer to the Jomon populations than are the other southern Siberian populations (Figure 2.1). In the phylogenetic network shown in Figure 2.3, based on shared mtDNA haplogroups M7a and N9b (Table 2.5), it seems possible that the Udegey represents admixture of southern Siberian populations and the northern (Hokkaido and Tohoku) Jomon people. This implies some degree of gene flow between the Udegey people ancestors and the northern Jomon. Moreover, as I mentioned earlier, haplogroup N9b and M7a2 are hardly observed in the other East Asian populations except in the Japanese Archipelago (Table 2.7 and 2.8). One interpretation would be that a northern population with haplogroups N9b and M7a2 migrated into the Tohoku region via Hokkaido, although a southern origin has been considered for the M7a haplotype.  Furthermore, I also detected Denisovan gene flow into not only Melanesians but also to Sanganji Jomon and Dai ethnic minority group of Southern China, while Ainu people as well as modern East Asians did not show a sign of the gene flow. This indicates that first migrants from Sundaland into East Asia had genetic components of Denisovan, but the remnants were diluted or disappeared in modern East Asians. The splits separating Vindija Neanderthal and Shikkariabe Jomon from Africans suggest the gene flow of Vindija Neanderthal into the ancestors of Shikkariabe Jomon. The result is consistent with the result of PCA (Figure 4.9). However, the Denisovan gene flow into Shikkariabe Jomon was not observed (Figure 4.13), which is incongruent result with phylogenetic network described in Chapter3. It is possible that the phylogenetic network doesn't show all the genetic relationship.  I also carried out PCA with Chimpanzee, Vindija Neanderthal, Denisovan, Shikkariabe Jomon, and modern humans to investigate the genetic relationship between the Shikkariabe Jomon and archaic humans. A total of 53,783 SNP sites were available. Present-day non-Africans were genetically closer to archaic humans than African people (Figure 4.9), and Vindija Neanderthal hauls Shikkariabe Jomon as well as other Eurasians and Native Americans. Denisovan pulls all East Asians and Melanesians, especially the contribution of Denisovan gene flow seems to be strong in Melanesians. This result is consistent with the result of Reich et al. (2011). Shikkariabe Jomon was within the cluster of East Eurasians, and no strong Denisovan gene flow was observed. If Shikkariabe Jomon and Sanganji Jomon were homogeneous, the result is inconsistent with the result of D-statistic analysis in Chapter 3. I conducted the same analysis by substituting Ainu people for Shikkariabe Jomon. A total of 16,496 SNP sites were available, and all the five individuals were within the cluster of modern European, East Eurasians and Native Americans (Figure 4.10). Because of the limitation of available SNPs, the separation between Europeans and East Eurasians was not observed. Since Ainu people seem to inherit many of their genetic components from Jomon people, the result is consistent with the result of Shikkariabe Jomon. 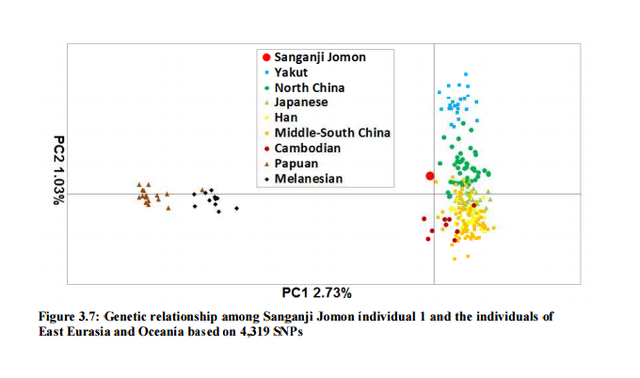 I also used genome wide SNP data instead of genomic sequencing data to detect gene flow with D-statistic analysis. A total of 285,716 SNP sites were available. I detected the gene flow between Vindija Neanderthal and Shikkariabe Jomon as well as other Non-Africans, while no Denisovan gene flow was detected (Table 4.10, Appendix Table 1). Even if I take the effect of post-mortem changes into account, the Zrevision(Chimpanzee, Denisovan; French, Shikkariabe Jomon) was not significant. This result is inconsistent with the result based on genomic sequences. There are two possibilities to explain this inconsistency: one is that the SNP sites are for investigating the differentiation among modern humans, not for that between modern human and archaic humans, and the dataset doesn t include informative SNP sites to detect Denisovan gene flow into East Eurasians. The second possibility is that post-mortem changes, low coverage of the genome inducing sequencing error, and short sequence reads mismapping to the reference genome caused false-positive signals in Shikkariabe Jomon. However, the inconsistency was observed not only for Shikkariabe Jomon but also for Dai. The similar pattern was observed in Cambodian (Reich et al., 2011) (Appendix Table 2). In addition, low frequency of post-mortem changes and small numbers of singleton in mapped reads support weak or negligible effect in D-statistic analysis. So, I suppose that first assumption is correct.  Presence or absence of the gene flow is a matter of controversy, but the observation of Denisovan gene flow into Jomon people is one of the keystones to explain the history of modern East Eurasians. I observed the genetic relationship between not only Jomon and Vindija Neanderthal but also Jomon and Denisovan. Since the current conclusion is only based on partial sequences of the Jomon genomes, further analyses with more genomic information and other statistical methods is essential in future studies. The existence of Denisovan DNA material in Jomon people will be one of the center of debate connected to not only the history of Japanese but also the origin and population structure of East Eurasian. KamiSawa Hideaki, and Kanzawa, Hideaki. "Ancient genomic DNA Analysis of Jomon People." Application / PDF (2014). www.docdroid.net/u5oq/a1684.pdf.html |
|
|
|
Post by Admin on Mar 11, 2016 1:09:53 GMT
 The gist of it is that the prehistoric Jomon people of Japan belonged to mtDNA haplogroups tying them to southeastern Siberia, but some haplogroups present there today were lacking in them. Then, the Ainu seem to have inherited the Jomon gene pool, but their major lineages tie them to the Okhotsk people. So, it seems that the deepest ancestry of Japan is not peculiar to it, but rather an extension of ancient Siberian variation with different population strata attributed to the Jomon, the Ainu, and (probably) the modern Japanese. 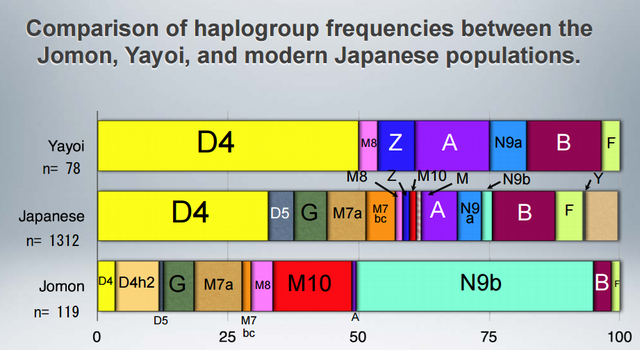 To clarify the colonizing process of East/Northeast Asia as well as the peopling of the Americas, identifying the genetic characteristics of Paleolithic Siberians is indispensable. However, no genetic information on the Paleolithic Siberians has hitherto been reported. In the present study, we analyzed ancient DNA recovered from Jomon skeletons excavated from the northernmost island of Japan, Hokkaido, which was connected with southern Siberia in the Paleolithic period. Both the control and coding regions of their mitochondrial DNA (mtDNA) were analyzed in detail, and we confidently assigned 54 mtDNAs to relevant haplogroups. Haplogroups N9b, D4h2, G1b, and M7a were observed in these individuals, with N9b being the predominant one. 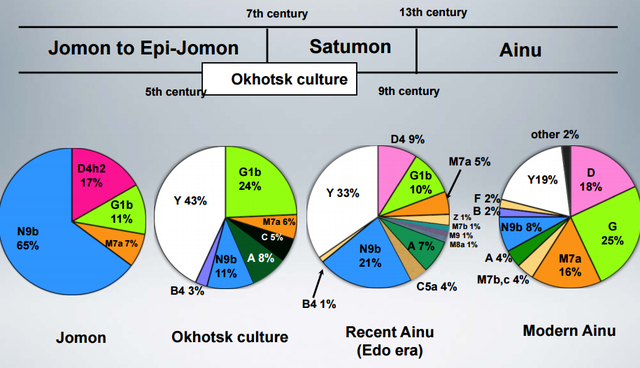 The fact that all these haplogroups, except M7a, were observed with relatively high frequencies in the southeastern Siberians, but were absent in southeastern Asian populations, implies that most of the Hokkaido Jomon people were direct descendants of Paleolithic Siberians. The coalescence time of N9b (ca. 22,000 years) was before or during the last glacial maximum, implying that the initial trigger for the Jomon migration in Hokkaido was increased glaciations during this period. Interestingly, Hokkaido Jomons lack specific haplogroups that are prevailing in present-day native Siberians, implying that diffusion of these haplogroups in Siberia might have been after the beginning of the Jomon era, about 15,000 years before present. DOI: 10.1002/ajpa.21561 |
|


