Post by Admin on Jan 21, 2018 18:58:21 GMT
Denisovan Introgression in East/South Asian, Siberian, and Native American Populations
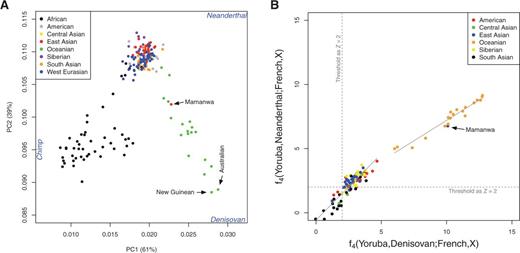
To detect Denisovan introgression in EE/NA populations, we computed the ratio of two f4f4 statistics ( RD(X)RD(X) ): f4(Yoruba,Denisovan;French, X)f4(Yoruba,Denisovan;French, X) and f4(Yoruba,Neanderthal;French, X)f4(Yoruba,Neanderthal;French, X) , for each EE/NA population. Populations with RD(X)>1RD(X)>1 are likely to have Denisovan ancestry (see Materials and Methods). Before we applied the approach to empirical data, we evaluated the performance of this statistic through simulations (see Materials and Methods and supplementary fig. S7, Supplementary Material online). For simulated populations with or without Denisovan ancestry, we applied a strict threshold of RD(X)>1,RD(X)>1, which yields low false positive rates and underestimates true Denisovan ancestry (supplementary fig. S8A and Supplementary Data, Supplementary Material online), and hence is a conservative indicator of Denisovan ancestry. Moreover, gene flow between African and European populations will not inflate the false positive rate and has no obvious impact on the performance of this indicator (supplementary fig. S8C–F, Supplementary Material online). We then computed RD(X)RD(X) for all EE/NA populations exhibiting significant admixture signals with Denisovans and/or Neanderthals in formal admixture tests (fig. 1B and supplementary table S3, Supplementary Material online). As expected, we observed large ratios (RD(X) > 1) in all Oceanian populations (fig. 4). Variable results were obtained for the other EE/NA populations, with RD(X) > 1 observed in several populations, including most Native American populations. Overall, this analysis indicates that there are EE/NA populations outside Oceania with a clear signal of Denisovan ancestry. Similar results are obtained with the use of different reference populations (supplementary table S6, Supplementary Material online).

FIG. 4.
Widespread Denisovan ancestry in EE/NA populations. Values of the RD(X)RD(X) ratio are plotted for all EE/NA populations which give significant signals of admixture with Neanderthal or Denisovan in formal tests; values greater than 1 (dashed line) are indicative of Denisovan ancestry.
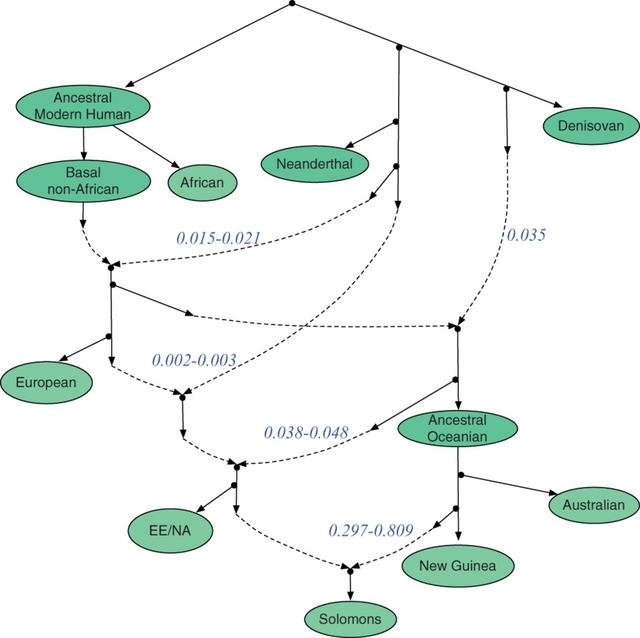
Is this presumptive Denisovan ancestry in EE/NA populations from the same admixture event that contributed Denisovan ancestry to Oceanian populations, or does it rather represent a separate admixture event (or events) between modern humans and Denisovans? We postulated that if it reflects the same event that contributed Denisovan ancestry to Oceanians, then the amount of Denisovan ancestry in EE/NA populations should be correlated with the amount of New Guinean ancestry. Because the estimated amount of Denisovan ancestry is quite small in EE/NA populations, and difficult to distinguish from Neanderthal ancestry, we instead compared the overall amount of archaic admixture in EE/NA populations (as a fraction of that in New Guinean), which is calculated by the ratio of f4(Yoruba,Denisovan;French,X)f4(Yoruba,Denisovan;French,X) and f4(Yoruba,Denisovan;French,NewGuinean)f4(Yoruba,Denisovan;French,NewGuinean) , to the statistic f4(Yoruba,NewGuinean;French,X)f4(Yoruba,NewGuinean;French,X) . These two values are significantly correlated (fig. 5A, Pearson R2=0.23R2=0.23 , P=2.5×10⁻³P=2.5×10⁻³ ). However, this analysis could be confounded by admixture between East Asians and New Guineans, which has occurred as a consequence of the Austronesian expansion (Wollstein et al. 2010; Duggan and Stoneking 2014) and perhaps other population movements. We therefore removed the East Asian populations and repeated the analysis just for Siberians and Native Americans, and obtained an even higher correlation (fig. 5B, Pearson R2=0.54R2=0.54 , P=3.8×10⁻⁶P=3.8×10⁻⁶ ). Thus, archaic ancestry in EE/NA populations is significantly correlated with their New Guinea ancestry, suggesting that the Denisovan ancestry in EE/NA and Oceanian populations reflects the same admixture event.
To detect Denisovan introgression in EE/NA populations, we computed the ratio of two f4f4 statistics ( RD(X)RD(X) ): f4(Yoruba,Denisovan;French, X)f4(Yoruba,Denisovan;French, X) and f4(Yoruba,Neanderthal;French, X)f4(Yoruba,Neanderthal;French, X) , for each EE/NA population. Populations with RD(X)>1RD(X)>1 are likely to have Denisovan ancestry (see Materials and Methods). Before we applied the approach to empirical data, we evaluated the performance of this statistic through simulations (see Materials and Methods and supplementary fig. S7, Supplementary Material online). For simulated populations with or without Denisovan ancestry, we applied a strict threshold of RD(X)>1,RD(X)>1, which yields low false positive rates and underestimates true Denisovan ancestry (supplementary fig. S8A and Supplementary Data, Supplementary Material online), and hence is a conservative indicator of Denisovan ancestry. Moreover, gene flow between African and European populations will not inflate the false positive rate and has no obvious impact on the performance of this indicator (supplementary fig. S8C–F, Supplementary Material online). We then computed RD(X)RD(X) for all EE/NA populations exhibiting significant admixture signals with Denisovans and/or Neanderthals in formal admixture tests (fig. 1B and supplementary table S3, Supplementary Material online). As expected, we observed large ratios (RD(X) > 1) in all Oceanian populations (fig. 4). Variable results were obtained for the other EE/NA populations, with RD(X) > 1 observed in several populations, including most Native American populations. Overall, this analysis indicates that there are EE/NA populations outside Oceania with a clear signal of Denisovan ancestry. Similar results are obtained with the use of different reference populations (supplementary table S6, Supplementary Material online).

FIG. 4.
Widespread Denisovan ancestry in EE/NA populations. Values of the RD(X)RD(X) ratio are plotted for all EE/NA populations which give significant signals of admixture with Neanderthal or Denisovan in formal tests; values greater than 1 (dashed line) are indicative of Denisovan ancestry.
Is this presumptive Denisovan ancestry in EE/NA populations from the same admixture event that contributed Denisovan ancestry to Oceanian populations, or does it rather represent a separate admixture event (or events) between modern humans and Denisovans? We postulated that if it reflects the same event that contributed Denisovan ancestry to Oceanians, then the amount of Denisovan ancestry in EE/NA populations should be correlated with the amount of New Guinean ancestry. Because the estimated amount of Denisovan ancestry is quite small in EE/NA populations, and difficult to distinguish from Neanderthal ancestry, we instead compared the overall amount of archaic admixture in EE/NA populations (as a fraction of that in New Guinean), which is calculated by the ratio of f4(Yoruba,Denisovan;French,X)f4(Yoruba,Denisovan;French,X) and f4(Yoruba,Denisovan;French,NewGuinean)f4(Yoruba,Denisovan;French,NewGuinean) , to the statistic f4(Yoruba,NewGuinean;French,X)f4(Yoruba,NewGuinean;French,X) . These two values are significantly correlated (fig. 5A, Pearson R2=0.23R2=0.23 , P=2.5×10⁻³P=2.5×10⁻³ ). However, this analysis could be confounded by admixture between East Asians and New Guineans, which has occurred as a consequence of the Austronesian expansion (Wollstein et al. 2010; Duggan and Stoneking 2014) and perhaps other population movements. We therefore removed the East Asian populations and repeated the analysis just for Siberians and Native Americans, and obtained an even higher correlation (fig. 5B, Pearson R2=0.54R2=0.54 , P=3.8×10⁻⁶P=3.8×10⁻⁶ ). Thus, archaic ancestry in EE/NA populations is significantly correlated with their New Guinea ancestry, suggesting that the Denisovan ancestry in EE/NA and Oceanian populations reflects the same admixture event.


