|
|
Post by Admin on Oct 16, 2023 9:26:11 GMT
According to over 100 samples from the Tatarstan DNA project, the most common Y-DNA haplogroup of the ethnic Volga Tatars is Haplogroup R1a (over 20%), predominantly from the R1a-Z93 subclade. Haplogroup N is the other significant haplogroup. According to different data, J2a or J2b may be the more common subclade of Haplogroup J2 in Volga Tatars. The haplogroups C and Q are among the more rare haplogroups. Haplogroups in Volga Tatars (122 samples): C2: 2% E: 4% (V13: 3%) G2a: 2% I1: 6% I2a1: 5% I2a2: 2% J2a: 7% J2b: 2% L1: 2% N1c2: 9% N1c1: 16% O3: 2% Q1: 2% R1a: 33% (Z282: 19%, Z93: 14%)  Volga Tatars, along with Maris, Finns, and Karelians, all cluster genetically with northern and eastern Russians, and are distinct from southern and western Russians. The scientists also found differences in relationships among some of the northern and eastern Russians. According to a genetic study on mitochondrial haplogroups, Volga Tatars reveal roughly 90% West-Eurasian and 10% East-Eurasian maternal haplogroups. According to a full genome study by Triska et al. 2017, the Volga Tatars are primarily descended from Volga Bulgar tribes "who carried a large Finno-Ugric component", Pechenegs, Kumans, Khazars, and Iranian peoples such as Alans. The Tatars IBD is shared with various Turkic and Uralic populations, primarily from the Volga-Ural region. The authors suggest that "when the original Finno-Ugric speaking people were conquered by Turkic tribes, both Tatar and Chuvash are likely to have experience language replacement, while retaining their genetic core". The Finno-Ugric groups themselves have previously be found to have formed from local Indo-Europeans and early Uralic-speaking groups. bmcgenomdata.biomedcentral.com/articles/10.1186/s12863-017-0578-3 |
|
|
|
Post by Admin on Oct 17, 2023 7:55:55 GMT
Between Lake Baikal and the Baltic Sea: genomic history of the gateway to Europe
Abstract
Background
The history of human populations occupying the plains and mountain ridges separating Europe from Asia has been eventful, as these natural obstacles were crossed westward by multiple waves of Turkic and Uralic-speaking migrants as well as eastward by Europeans. Unfortunately, the material records of history of this region are not dense enough to reconstruct details of population history. These considerations stimulate growing interest to obtain a genetic picture of the demographic history of migrations and admixture in Northern Eurasia.
Results
We genotyped and analyzed 1076 individuals from 30 populations with geographical coverage spanning from Baltic Sea to Baikal Lake. Our dense sampling allowed us to describe in detail the population structure, provide insight into genomic history of numerous European and Asian populations, and significantly increase quantity of genetic data available for modern populations in region of North Eurasia. Our study doubles the amount of genome-wide profiles available for this region.
We detected unusually high amount of shared identical-by-descent (IBD) genomic segments between several Siberian populations, such as Khanty and Ket, providing evidence of genetic relatedness across vast geographic distances and between speakers of different language families. Additionally, we observed excessive IBD sharing between Khanty and Bashkir, a group of Turkic speakers from Southern Urals region. While adding some weight to the “Finno-Ugric” origin of Bashkir, our studies highlighted that the Bashkir genepool lacks the main “core”, being a multi-layered amalgamation of Turkic, Ugric, Finnish and Indo-European contributions, which points at intricacy of genetic interface between Turkic and Uralic populations. Comparison of the genetic structure of Siberian ethnicities and the geography of the region they inhabit point at existence of the “Great Siberian Vortex” directing genetic exchanges in populations across the Siberian part of Asia.
Slavic speakers of Eastern Europe are, in general, very similar in their genetic composition. Ukrainians, Belarusians and Russians have almost identical proportions of Caucasus and Northern European components and have virtually no Asian influence. We capitalized on wide geographic span of our sampling to address intriguing question about the place of origin of Russian Starovers, an enigmatic Eastern Orthodox Old Believers religious group relocated to Siberia in seventeenth century. A comparative reAdmix analysis, complemented by IBD sharing, placed their roots in the region of the Northern European Plain, occupied by North Russians and Finno-Ugric Komi and Karelian people. Russians from Novosibirsk and Russian Starover exhibit ancestral proportions close to that of European Eastern Slavs, however, they also include between five to 10 % of Central Siberian ancestry, not present at this level in their European counterparts.
Conclusions
Our project has patched the hole in the genetic map of Eurasia: we demonstrated complexity of genetic structure of Northern Eurasians, existence of East-West and North-South genetic gradients, and assessed different inputs of ancient populations into modern populations.
|
|
|
|
Post by Admin on Oct 18, 2023 4:36:46 GMT
Background
The phenotypic diversity of modern humans was shaped under the combined pressure of environment and social relations. Placing the studies of human genetic variation into a geographical context provides powerful insights into how historical events, patterns of migration, and natural selection have led to genetic distinctions between various present-day populations [1, 2]. Moreover, genomic investigations may aid in resolving historic record discrepancies by confirming or rejecting hypotheses of ancient invasions and ethnic intermixing events.
While human genetic diversity has been sampled extensively in many areas of the globe [3,4,5,6], a sizeable gap remains in the region of Northern Eurasia (region including Russia and neighboring countries from the former Soviet Union) which spans from the Arctic Ocean down to Inner Asia, and from Eastern Europe to the Pacific Ocean. Though in total, human populations inhabiting this region were analyzed among others in several genome-wide studies [7,8,9,10,11,12,13,14,15,16,17,18,19,20,21,22] most of them were focused on other regions and included just a limited number of Northern Eurasian populations. Only five published studies were focused on the areas within North Eurasia: two papers of Yunusbayev [15, 19] investigated genetic composition of the Caucasus and Turkic speaking groups; [18] focused on Balto-Slavic speakers; [20] and [10] studies were even more limited in their geographic coverage. Thus, a panoramic genetic study covering all of Northern Eurasia is still lacking. The Russian Federation represents a unique setting for genetic studies because of its multitude of ethnicities with the evidence for admixture interspersed across several isolated communities. Further, its enormous space and considerable climatic variation created a range of distinct environmental niches which may have contributed to differential shaping of the genomes. However, the limited number of sampled populations in the published datasets translates into significantly less coverage incomparable to that for the western and central regions of Europe.
Here we present high-quality genome-wide analysis of 30 diverse populations from Russia and neighbouring countries (see Table 1). Some of these populations have been previously studied on a smaller scale, and some been sampled here for the first time. Though full genome sequences on population level started to accumulate worldwide extensively, only 246 full genomes were so far published for the Russian populations [10, 11, 16, 17, 23,24,25,26]. In contrast, genome-wide genotypes were published for 963 samples from 51 Russian populations [10, 16]. So, the genotyping arrays remain the most important source of genomic variation within Northern Eurasia. Here we double this aggregate dataset by publishing genome-wide genotype data on 1076 samples (1019 of them unrelated) from 30 populations of Russia and adjacent countries.
Certain unusually diverse areas were given special consideration, such as the Caucasus, where all the major ethnicities, including Abkhaz, Adygei, Chechen, Cherkes, Kabardian, Karachay, Megrel, and Ossetian were profiled. We have also sampled several unique populations, such as the Ket - an isolated, native Siberian people with a distinct language [10] and the Starover Russians, orthodox Old Believers who left western Russia in the seventeenth century and settled in the dense boreal forests of the banks of Volga and the Russian European North, as well as on the southern outskirts of Siberia [27]. Starovers maintain the liturgical and ritual practices of the Russian Orthodox Church as they existed prior to the reforms of Patriarch Nikon of Moscow between 1652 and 1666. In this work, we studied the descendants of Siberian Starovers, who presumably had limited admixture with other groups.
Several independent groups of researchers [1, 2, 8, 28,29,30,31,32,33] have analyzed the relation between genetic variation and geography, with a variety of biogeographical analysis techniques developed [2, 8, 32,33,34,35,36,37,38,39]. This relationship was extensively studied for European populations [32, 33, 35], for Indian casts [40,41,42], and, more generally, for world-wide populations [8]. Here we present a detailed analysis of Northern Eurasian populations inhabiting the territories of Russian Federation, and neighbouring countries.
|
|
|
|
Post by Admin on Oct 19, 2023 4:52:11 GMT
Methods Sample collection and quality controls DNA samples (N = 1076) were collected in course of study expeditions into different parts of Russia, Kazakhstan, Georgia, Uzbekistan and Kyrgyzstan. Samples were genotyped on the Illumina Infinium 370-Duo, 370-Quad, or 610-Quad arrays (https://support.illumina.com/downloads/humancnv370-duo_v10_product_files.html, support.illumina.com/downloads/humancnv370-quad_v30_product_files.html, support.illumina.com/array/array_kits/human610-quad_beadchip_kit.html). The number of samples per population, source of the samples, and the type of microarray used are given in the Table 1. All DNA samples were subjected to the following quality control procedures: samples with genotyping success rates <90% were removed, as were male samples with ≥1% heterozygous markers on the X chromosome or female samples with ≤20% heterozygous X chromosome markers. Across retained samples, 95% cut-off for SNP presence was imposed. (Further details are provided in the Additional file 1: Figure S1). According to the meta-data from questionnaires, all study volunteers were unrelated to each other. Nevertheless, the dataset was analysed for the presence of cryptic relatedness by calculating the kinship coefficients separately in each ethnic group using the King software [43], assuming the presence of population structure. For 29 related pairs of individuals with a threshold of kinship coefficient set at ≥0.177 [43], the sample with the lower genotyping-call rate was excluded from further analysis, thus, only 1019 samples remained out of 1076. To reduce the effect of missing data, the marker panel was limited to autosomal SNPs with genotyping success rates ≥99.5%. For each set of samples, more than 200,000 markers were analysed. Geographic locations of the sampled populations are presented in the Fig. 1 (samples from this study) or online at tinyurl.com/biengi (all samples used for the analysis). 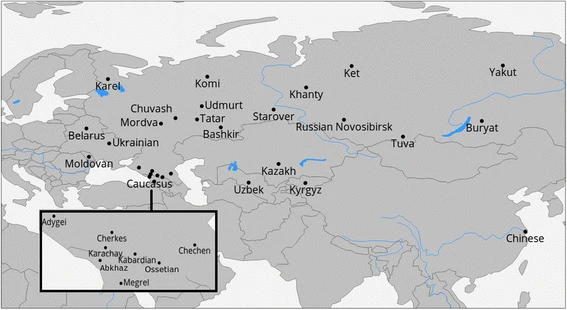 Fig. 1 Geographic position of samples in our study Origin of the samples To provide a uniform representation of ethnic diversity in Russia we sampled broadly over the country (see Fig. 1 and Table 1) and adjacent territories. In total, genome-wide variation was accessed in 1019 individuals from five countries across the former Soviet Union. All except one of the studied populations (Chinese) were covered by at least 20 samples (see Table 1). To limit influence of recent admixture, we ensured sampling of villagers who reportedly were settled in the sample place for at least three generations (up to grandparents). |
|
|
|
Post by Admin on Oct 20, 2023 5:20:08 GMT
Datasets
The collected data were assembled in three datasets.
1)
The “Extended” dataset includes all individuals genotyped in this study combined with selected previously published modern and ancient samples from Northern Eurasia, which extend geographic span of our study and provide necessary populational context for our analyses (1353 individuals from 55 populations, plus 11 ancient samples, shown in Additional file 3: Table S1a). The “Extended” dataset was used for ADMIXTURE analysis.
2)
The “Core” dataset contains samples genotyped in this study (1019 individuals shown in Additional file 3: Table S1b). The “Core” dataset was used to calculate IBD sharing and f3 statistics.
3)
The “Ancient” dataset includes all individuals genotyped in this study combined with European samples from “1000 Genomes” project as well as previously published ancient DNA samples (1232 individuals shown in Additional file 3: Table S1c). This dataset was used to calculate the f3 outgroup statistics.
ADMITURE
ADMIXTURE [44, 45] algorithm was used in unsupervised mode to determine the population structure. The number of components (K) was varied from 2 to 10, and cross-validation errors was recorded for all values of K.
For GPS [8] and reAdmix [39] analyses, the reference dataset was obtained from E Elhaik, T Tatarinova, D Chebotarev, IS Piras, C Maria Calò, A De Montis, M Atzori, M Marini, S Tofanelli, P Francalacci, et al. [8]. To enable the comparison with earlier published results, SNPs were converted to the 9-dimensional admixture vectors (“North East Asian”, “Mediterranean”, “South African”, “South West Asian”, “Native American”, Oceanian”, “South East Asian”, “Northern European”, “Sub-Saharan African”) using the ADMIXTURE [44, 45] algorithm in supervised mode.
IBD calculations
IBD blocks were identified for every pair of individuals in the “Core” dataset using fastIBD algorithm implemented in BEAGLE 3.3 [46]. For further analysis, the amount of shared IBD was calculated separately in two bins: short 1–3 cM blocks and longer 4–10 cM blocks. Total amount of shared IBD was then averaged per pair of individuals.
F3 calculations
The three-population statistics were calculated in threepop software included in Treemix [47] with the block size parameter (−k) set to 500 SNPs (other parameters set to default values).
GPS and reAdmix provenance identification
To validate compatibility of the genotyping technologies based on different platforms, we applied GPS [8] and reAdmix [39] to the combined dataset consisting of populations sampled in our study along with ones previously sampled by the National Genographic project, HapMap, and “1000 genomes”. Depending on the database coverage of a selected region and ethnic group, GPS/reAdmix accuracies differ. For example, in this analysis, self-identifications of all profiled Kyrgyz, 75% of Kabardian, and 60% self-reported Ket were correctly identified by GPS. For populations not covered by reference database, locations were triangulated using neighboring ethnic groups.
|
|

