Post by Admin on Oct 21, 2023 5:23:45 GMT
Results
Population structure
In our study, collection points spanned the latitudes from the Northern Europe to Caucasus and longitudes from Eastern Europe to far shores of Siberia. The results of unsupervised analysis of the “extended” dataset with ADMIXTURE [44, 45] varying the number of ancestral clusters (K) from 2 to 10 (Additional file 2: Figure S2) were most informative for K = 6 (Fig.2), which resulted in lowest cross-validation error and meaningful distribution of components between studied populations.
Fig. 2
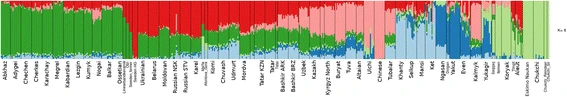
Admixture proportions in studied populations, K = 6. Populations from the Extended dataset. Abbreviated population codes: NSK - Russians from Novosibirsk; STV -Starover Russians; ARK: Bashkirs from Arkhangelskiy district; BRZ - Bashkirs from Burzyansky district
To enable direct comparison with previous world-wide studies by National Genographic Project [7, 8, 10, 31, 39, 48], ADMIXTURE analysis in supervised mode were performed for K = 9. For each chip type, we selected a subset of SNPs (~30 K and ~60 K for the two chip types) that matched National Genographic Project chip Geno 2.0 [7].
Among the profiled populations, the degrees of ancient admixture varied dramatically. While the populations residing in the Caucasus and East Siberia regions were mostly represented by a single component (dark green and dark blue, correspondingly), the samples from the Volga-Ural region exhibit substantial admixture of European and Asian components (red, dark green, and light blue). Importantly, for each of the populations, the ratio between components was characteristic of that population (Additional files 3: Tables S2 and S3). Moreover, we observed a subdivision of the European genetic component into two clusters, one most prevalent in the Caucasus (dark green) and another with highest frequency in Northern Europe (red). These two European components jointly account for 50% - 90% of admixture vectors in both Turkic and Uralic speakers of Volga-Ural region, while in Finno-Ugric speakers in Northeast Europe and in all Slavic populations these components account for almost 90% of the gene pool.
Slavic speakers – Russians, Ukrainians, and Belarussians - are similar in their genetic composition. Ukrainians and Belarusians have almost identical proportions of the two “European” components and have virtually no “Asian” admixture. Russians from Siberia - both Novosibirsk residents’ and Russian Eastern Orthodox Old Believers’ (Starover) samples - being genetically close to Slavs residing in Europe, also have between five to 10 % of Central Siberian ancestry (light blue).
Asian genetic ancestry of the profiled populations is represented by four components. Two of them, light green (Beringian) and dark blue (East Siberian), are geographically confined to Northeast Asia, while showing only minor impact on populations west of Ural Mountains. On the contrary, East Asian (pink) and Central Siberian (light blue) components are also present in populations to the west of Ural.
In Central Asian Turkic speakers, including Kazakh and Uzbek, East Asian genetic influence is dominant (>35%), while in Bashkir it is detected at somewhat lower levels (~ 20%). Importantly, in Western Turkic speakers, like Chuvash and Volga Tatar, the East Asian component was detected only in low amounts (~ 5%).
The light blue genetic component dominates genetic landscape of populations inhabiting West and Central Siberia: Ugric-speaking Khanty and Mansi, Samoyedic speaking Selkups and linguistically isolated Ket. However, this ancestry component is present not only in Siberia, but also on the western side of Ural Mountains, though at somewhat lower frequencies - 20-30% in Komi (16% on average) and Udmurt (27% on average) who belong to the Permic branch of Uralic languages. Interestingly, similar levels of this ancestry component (16–23%) are also exhibited by Turkic speaking Chuvash (20% on average) and Bashkir (17% on average), while Tatar, who also reside in the Volga region and have related linguistic and cultural profiles, only show at most 15% (10% on average) of this genetic component. Even lower levels of this ancestry component (<5%) were observed in Turkic speakers of Central Asia.
The Beringian component (light green) is confined exclusive to indigenous populations of Eskimo, Chukchi and Koryak. The East Siberian (dark blue) component is represented by Turkic and Samoyedic speakers of Central Siberian plateau: Yakut, Dolgan and Nganasan. This component is also found at moderate frequencies in Mongolic and Turkic speakers in Baikal region and Central Asia (5–15%), and, at low but discernible frequencies (1–5%), in Turkic speakers residing in Volga-Ural region.
Population structure
In our study, collection points spanned the latitudes from the Northern Europe to Caucasus and longitudes from Eastern Europe to far shores of Siberia. The results of unsupervised analysis of the “extended” dataset with ADMIXTURE [44, 45] varying the number of ancestral clusters (K) from 2 to 10 (Additional file 2: Figure S2) were most informative for K = 6 (Fig.2), which resulted in lowest cross-validation error and meaningful distribution of components between studied populations.
Fig. 2
Admixture proportions in studied populations, K = 6. Populations from the Extended dataset. Abbreviated population codes: NSK - Russians from Novosibirsk; STV -Starover Russians; ARK: Bashkirs from Arkhangelskiy district; BRZ - Bashkirs from Burzyansky district
To enable direct comparison with previous world-wide studies by National Genographic Project [7, 8, 10, 31, 39, 48], ADMIXTURE analysis in supervised mode were performed for K = 9. For each chip type, we selected a subset of SNPs (~30 K and ~60 K for the two chip types) that matched National Genographic Project chip Geno 2.0 [7].
Among the profiled populations, the degrees of ancient admixture varied dramatically. While the populations residing in the Caucasus and East Siberia regions were mostly represented by a single component (dark green and dark blue, correspondingly), the samples from the Volga-Ural region exhibit substantial admixture of European and Asian components (red, dark green, and light blue). Importantly, for each of the populations, the ratio between components was characteristic of that population (Additional files 3: Tables S2 and S3). Moreover, we observed a subdivision of the European genetic component into two clusters, one most prevalent in the Caucasus (dark green) and another with highest frequency in Northern Europe (red). These two European components jointly account for 50% - 90% of admixture vectors in both Turkic and Uralic speakers of Volga-Ural region, while in Finno-Ugric speakers in Northeast Europe and in all Slavic populations these components account for almost 90% of the gene pool.
Slavic speakers – Russians, Ukrainians, and Belarussians - are similar in their genetic composition. Ukrainians and Belarusians have almost identical proportions of the two “European” components and have virtually no “Asian” admixture. Russians from Siberia - both Novosibirsk residents’ and Russian Eastern Orthodox Old Believers’ (Starover) samples - being genetically close to Slavs residing in Europe, also have between five to 10 % of Central Siberian ancestry (light blue).
Asian genetic ancestry of the profiled populations is represented by four components. Two of them, light green (Beringian) and dark blue (East Siberian), are geographically confined to Northeast Asia, while showing only minor impact on populations west of Ural Mountains. On the contrary, East Asian (pink) and Central Siberian (light blue) components are also present in populations to the west of Ural.
In Central Asian Turkic speakers, including Kazakh and Uzbek, East Asian genetic influence is dominant (>35%), while in Bashkir it is detected at somewhat lower levels (~ 20%). Importantly, in Western Turkic speakers, like Chuvash and Volga Tatar, the East Asian component was detected only in low amounts (~ 5%).
The light blue genetic component dominates genetic landscape of populations inhabiting West and Central Siberia: Ugric-speaking Khanty and Mansi, Samoyedic speaking Selkups and linguistically isolated Ket. However, this ancestry component is present not only in Siberia, but also on the western side of Ural Mountains, though at somewhat lower frequencies - 20-30% in Komi (16% on average) and Udmurt (27% on average) who belong to the Permic branch of Uralic languages. Interestingly, similar levels of this ancestry component (16–23%) are also exhibited by Turkic speaking Chuvash (20% on average) and Bashkir (17% on average), while Tatar, who also reside in the Volga region and have related linguistic and cultural profiles, only show at most 15% (10% on average) of this genetic component. Even lower levels of this ancestry component (<5%) were observed in Turkic speakers of Central Asia.
The Beringian component (light green) is confined exclusive to indigenous populations of Eskimo, Chukchi and Koryak. The East Siberian (dark blue) component is represented by Turkic and Samoyedic speakers of Central Siberian plateau: Yakut, Dolgan and Nganasan. This component is also found at moderate frequencies in Mongolic and Turkic speakers in Baikal region and Central Asia (5–15%), and, at low but discernible frequencies (1–5%), in Turkic speakers residing in Volga-Ural region.