|
|
Post by Admin on Jul 7, 2016 22:49:56 GMT
It has been argued that the most ancient European mitochondrial DNA (mtDNA) haplogroup (hg), U5, arose among the first European settlers in the Upper Paleolithic [1],[2]. Recent molecular dating results suggest that the age of hg U5 oscillates around 36 thousand years (ky), and it has been suggested that any early migration of U5 or its ancestors into Europe might have occurred between ∼55 ky and ∼30 ky ago [3]. There are two U5 subhaplogroups, U5a and U5b, dating back to ∼27 ky each, thus implying that they both originated before the Last Glacial Maximum (LGM) [3]. The frequency of hg U5 in modern European populations is on average 7% [1],[4],[5], but recent studies of ancient mtDNA have shown that U5 haplotypes were common among Mesolithic and Neolithic Europeans, especially of central and eastern parts of Europe [6],[7]. For instance, a high incidence of U5 haplotypes (about 65%) has been detected in European hunter-gatherer individuals [7]. Analysis of mtDNA hypervariable segment I (HVS I) sequences in modern European populations revealed the presence of a bulk of hg U5 subclusters that demonstrated coalescence ages around 11–13 ky and less [8]. Expansions of such U5-subclusters are thought to be linked to favorable climatic changes of the Holocene, allowing re-occupation of large areas of northern Europe by humans from southern European refuges [8]. However, it is unclear whether this process was associated with human dispersals from eastern Europe - partly due to deficiency of the published complete mtDNA sequences from eastern European populations. Therefore, we provide here new information concerning the phylogeny of hg U5 in eastern European populations based on complete mtDNA variability data in Russians, Belorussians, Poles, Czechs and Slovaks, and compare these data with those obtained from western European populations.  Figure 1. Complete mtDNA phylogenetic tree of haplogroup U5. Complete mtDNA genome sequences from eastern European populations allows us to refine the hg U5 phylogeny (Figure 1, Table S1). Subhaplogroup U5a consists of two phylogenetic clusters, U5a1 and U5a2 (Figure S1). Within U5a1, six subclusters can be recognized (from U5a1a to U5a1f). In addition, the founder haplotype for cluster U5a1 has been found in the Czech population (CzIII55). Five subclusters were revealed in cluster U5a2 (from U5a2a to U5a2e). Subhaplogroup U5b is subdivided into three clusters, U5b1, U5b2 and U5b3 (Figure S2). The coalescence time estimate based on the average sequence divergence of the 213 U5 mitochondrial genomes is approximately 25–30 ky (Table 1). Subhaplogroup U5a dates to ∼16–20 ky, implying that it evolved during the LGM, in contrast to subhaplogroup U5b that suggests a pre-LGM time of divergence of 20–24 ky, depending on the mutation rate used. A similar age was found for subhaplogroup U5b2. Coalescence time estimates for several subclusters (U5a1, U5a1a1b, U5a1d, U5a2, U5a2c, U5b1, and U5b2) correspond to the end of the LGM, ∼18 kya, while the remaining U5a and U5b1 subclusters are characterized by lower coalescence ages (Table 1). Therefore, a post-LGM re-expansion of populations from refugial zones between the Pyrenees, the Balkans and the Ukraine, commencing at ∼15 kya, may explain the pattern observed [9]. It has been previously suggested that subcluster U5b1b1 reached northern Europe from an Iberian source, via central/eastern Europe, in the post-LGM times, sometime after ∼15 kya [5],[10]. Tambets et al. [10] have noted the considerable diversity of the U5b1b1 subcluster in western and southern Europe, suggesting that these regions, rather than eastern Europe, were the probable place of origin of U5b1b1. Analysis of complete mitochondrial U5b-genomes indicates that the origin of the whole U5b1 subcluster can be associated with southern and central parts of Europe, because each part of U5b1-phylogeny demonstrates the presence of earlier subclusters of Mediterranean prevalence (such as U5b1b1b, U5b1b1d, U5b1b1e, U5b1c, U5b1d), along with a central European cluster (U5b1a, U5b1b1c, U5b1e) (Figure 1, Figure S2). Among these, subcluster U5b1e is mainly present in central Europe among Czechs, Slovaks, Hungarians and southern Russians (Table S2). The rare subcluster U5b1a has been detected in Mediterranean, southeastern and central European populations, such as Italians, Greeks, Bosnians, Croatians, Slovaks, Hungarians (Table S2).  Table 1. Age estimates of hg U5 subclusters calculated using different mutation rates. It has been suggested that hg U5, or a genetically close ancestor to U5, arose among the first settlers of Europe, and subsequently spread all aver the continent along with the Aurignacian industry [1],[2]. According to archaeological data, this Upper Paleolithic industry spread rapidly across western and central Europe roughly 42 to 40 kya, and there is evidence for a slightly earlier influx in southern and central Europe [12]. It is also suggested that Upper Paleolithic occupation at archaeological sites on the Don River in the East European Plain (at Kostenki site) occurred a little earlier, around 45–42 kya [13]. However, taxonomic assignment of paleoanthropological material (teeth) from this site, as well as the relationship between the Kostenki industry and the earliest dated Upper Paleolithic remains in southern and central Europe, remains unclear [13]. A recent study of ancient DNA from the Kostenki site (∼30 kya) in Russia has shown that anatomically modern humans with haplogroup U2 might have populated the East European Plain at that time [14]. Therefore, as in southern and central Europe, only the youngest of the archaeological entities (Aurignacian) in eastern Europe is associated with skeletal remains that may be assigned unequivocally to anatomically modern humans [15],[16]. It is probable, however, that the first successful expansion of modern humans inhabiting the territory of the central part of East European Plain might have occurred at least 24 kya [17]. This follows from the fact that the density of precisely dated sites increased considerably in southern Russia during the Last Glacial Maximum (roughly 24–16 kya), and in north western Russia after degradation of the glacier ice ∼14 kya [18]. Therefore, the hypothesis of the eastern ‘Periglacial refugium’ postulated based on archaeological data [18],[19] is probably supported by genetic data presented here, as the coalescence times for some U5a subclusters (as well as for hg U4 [20]) in eastern Europe correspond to the post-LGM dates. However, we did not detect any mtDNA haplotypes of such antiquity that clearly identify early traces of the pre-LGM expansions in eastern Europe, originating from industries that can be traced back 40–30 ky (for instance, for the Spitsyn or Strelets Cultures assemblages). Evolutionary ages of ∼20–24 ky have been found for ancestors of subhaplogroups U5b and U5b2, which most probably were originated in southern and central part of Europe, because the majority of such haplotypes were revealed in Czechs, Slovaks and Poles and in the Mediterranean populations, based on a set of population data analyzed in the present study (Figure 1, Figure S2). 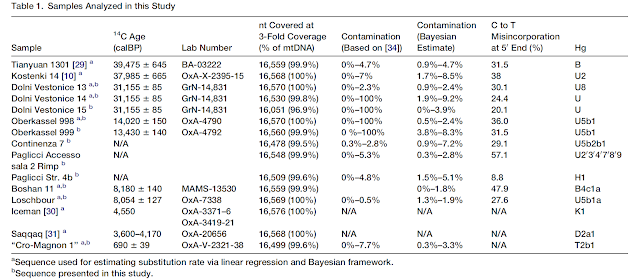 It is known that the Late Upper Paleolithic industries of central Europe are closely related to contemporaneous eastern European cultures [21],[22]. This probably reflects both the proximity of central Europe, and the presence of similar environments in the Carpathian Basin. The eastern Gravettian industry, which is represented in sites dated back ∼29–22 kya, is found in both central and eastern Europe [22]. However, climates were milder in the Carpathian Basin and, in contrast to the central East European Plain, settlements in central Europe appear to be continuous throughout the LGM [21]. Moreover, the eastern part of central Europe - the Carpathian Basin, is considered by archaeologists and ecologists as one of the European refugia that existed during the LGM [23],[24]. A recent ancient DNA study of Stone Age hunter-gatherers from central and eastern Europe has shown that most of the samples studied (>80%) shared mtDNA haplotypes belonging to haplogroups U5 and U4, haplogroups that notably are relatively rare in central Europe today [7]. Among them, sample 5830a from Hohlenstein-Stadel (Germany), defined as U5a2a, based on the HVS I sequence 16114A-16192-16256-16294-16311, was detected. Its closest HVS I relatives in modern populations can be found among eastern Europeans (in Latvians, Russians, Tatars and Mordvins). In the present study we have completely sequenced two U5a2a mitochondrial genomes with the characteristic transition at np 16311 in Russians (Figure S1). AMS radiocarbon dating of sample 5830a (at ∼7.8 ky old) allows determination of a minimum age for the subcluster U5a2a to which it belongs. Phylogenetic analysis revealed that the coalescent ages of this subcluster vary from 5.7±1.2 ky (for a complete mtDNA clock rate) to 9.3±2.6 ky (for a synonymous clock rate). Therefore, the age of sample 5830a falls within the intervals of these molecular phylogenetic dating. We should note, however, that Russian U5a2a-16311 samples share a mutation at np 9293 with a Belorussian sample, thus forming a subcluster with the age of ∼2.6 ky (Figure S1). Thus it is probable that similar HVS I sequences in Stone Age individuals and modern Russian individuals may be related only within the bounds of the whole subcluster U5a2a, defined, in fact, by parallel mutations at np 16311 originating independently. In addition, another ancient HVS I haplotype, 16192-16270, belonging probably to subcluster U5b1a, was found in skeletons dated to ∼5.6 ky old, from Lithuania [7]. We have found that the age of ancient mtDNAs does not exceed the coalescence time estimates of modern U5b1a sequences, falling within the range of 9.3±3.5 ky (for a complete mtDNA clock rate) to 6.8±4.8 ky (for a synonymous clock rate) (Figure S2). In general, it seems that the combining of phylogenetic and archaeological approaches will be useful for cross-checking data and improvement of human mitochondrial molecular clock estimates, as new information about modern and ancient mitochondrial genomes becomes available [3]. Malyarchuk B, Derenko M, Grzybowski T, Perkova M, Rogalla U, Vanecek T, et al. (2010) The Peopling of Europe from the Mitochondrial Haplogroup U5 Perspective. PLoS ONE 5(4): e10285. doi:10.1371/journal.pone.0010285 |
|
|
|
Post by Admin on Jul 11, 2016 22:47:05 GMT
 Analysis of the mitochondrial DNA (mtDNA) variation has been successfully used for reconstructing ancestral and modern human migrations. Most of the sub-Saharan African mtDNAs fall into one of the multiple subclades of macro haplogroup L (excluding M and N that derived from L3 and represent the branches from which the entire non-sub-Saharan mtDNA diversity arose). Previous studies (Salas et al. 2004) showed that L haplotypes account for <1% of mtDNAs in Europe (Fig. 1), with L1b being the most common haplogroup (Fig. 2). However, frequencies vary widely, ranging from 3% in Southern Europe (with a peak of 4%–6% in Iberia) to 0.7% in Central Europe and 0.5% in Northern Europe. Moreover, it has been proposed that their arrival into Europe most likely occurred in recent times, during the Romanization period, the Arab/Berber conquest of Iberia and South Italy, and more recently during the Atlantic slave trade. This hypothesis mainly relies on the observation that most of the L-mtDNAs in Europe represent patchy members of the African phylogeny as randomly taken from different African source populations (Fig. 3), without evidence indicating accumulation of molecular divergence within the European continent. The mitochondrial genetic imprint of the African trans-Atlantic slave routes to the Americas received substantial attention in the literature (Salas et al. 2004, 2005; Veeramah et al. 2010; Stefflova et al. 2011), but its impact on the European gene pool was poorly evaluated, probably due to the scantiness of the data. Salas et al. (2004) surveyed the mtDNA hypervariable segment I (HVS-I) of about 15,000 individuals from Europe and found 113 mtDNAs of African ancestry (including haplogroups U6, M1, and L). According to these investigators, African mtDNAs in Eurasia can be broadly attributed to gene flow from Eastern, Western, and Southeastern Africa, but neither the proportions nor their arrival time in Europe were estimated. Based on the analysis of control-region data compiled from the literature, Malyarchuk and Czarny (2005) proposed that most of the European L-lineages might have arrived in Europe very recently, with the exception of two monophyletic clusters of L1b and L3b that could be older (no more than 6.5 thousand years ago [kya]) (Malyarchuk and Czarny 2005). In a follow-up study, the initial findings were not replicated, but a new subclade was identified (L2a1k; initially named as L2a1a) that could have specifically evolved within Europe ∼10 kya (Malyarchuk et al. 2008). Other studies undertaken in populations from Iberia tried to explain the origin of the observed L lineages (Pereira et al. 2000; Larruga et al. 2001; A´lvarez-Iglesias et al. 2009), concluding that virtually all of these probably arrived in recent times, the majority as a result of the slave trade between the 15th and 19th Centuries. It is worth mentioning that genetic links between Europe and North Africa are well established, supporting ancient migratory event from the Franco-Cantabrian refuge toward the Mediterranean regions of Africa ∼9 kya (Achilli et al. 2005; Pereira et al. 2010).  Figure 1. Spatial haplogroup distribution of sub-Saharan African lineages in Europe based on control-region data. (A) Macro-haplogroup L; (B) haplogroup L1b. Green crosses in A indicate the sampled regions (see also Supplemental Data S1). L1b is by far the most common L-African lineage in Europe, 49% according to complete mitogenomes (a total of 34, of which 30 are newly reported here), and 23% according to control-region data. Previous studies mainly based on control-region sequences (Salas et al. 2002) showed that haplogroup L1b is most frequent and diverse in West-central Africa (Fig. 1).  Figure 2. Given the phylogeny, the frequency, and the diversity patterns observed in Africa for L1b, it is likely that this haplogroup arose in West Africa, from where it moved to other African and non-African locations. There is a subclade of L1b defined by the transition A16289G (Fig. 2) and named here L1b1a2a, which could have originated later in East Africa (represented by three divergent sequences from Ethiopia: GenBank accession numbers EU092952, EU092942, and EU092950). L1b1a2a could have moved from East Africa to the North downstream the Nile shores toward Egypt (represented by the complete genome EU092775). The immediate ancestral node, L1b1a2 (Fig. 2), is represented by a single mitogenome observed in Israel (the Bedouin sequence EU092672) (Behar et al. 2008). There are two representatives of L1b1a2a in Spain (one of them in Galicia; Northwest Spain), which could have arrived during the period of the Atlantic slave trade or the Arab invasion of the Iberian Peninsula.  Figure 3. Given the phylogeny, the frequency, and the diversity patterns observed in Africa for L1b, it is likely that this haplogroup arose in West Africa, from where it moved to other African and non-African locations. There is a subclade of L1b defined by the transition A16289G (Fig. 2) and named here L1b1a2a, which could have originated later in East Africa (represented by three divergent sequences from Ethiopia: GenBank accession numbers EU092952, EU092942, and EU092950). L1b1a2a could have moved from East Africa to the North downstream the Nile shores toward Egypt (represented by the complete genome EU092775). The immediate ancestral node, L1b1a2 (Fig. 2), is represented by a single mitogenome observed in Israel (the Bedouin sequence EU092672) (Behar et al. 2008). There are two representatives of L1b1a2a in Spain (one of them in Galicia; Northwest Spain), which could have arrived during the period of the Atlantic slave trade or the Arab invasion of the Iberian Peninsula. We have also identified a new subclade of L1b1a, here named L1b1a9, characterized by the transversion G185C and the transition T14040C (Fig. 2). In contrast to most of the L1b subclades, L1b1a9 has a clear North African and Mediterranean distribution. It perhaps originated in Northwest Africa (as represented by the Moroccan Jew sequence EU092667) and afterward moved to different European Mediterranean locations (mainly Iberia and Italy). Two L1b1a9 sequences were found in Iberia (Galicia and Catalonia), three in the Italian Peninsula, and one in France.  Figure 4. A panel of AIMs was genotyped in the same samples whose mtDNAs were completely sequenced (Supplemental Table S8) in order to estimate their three-way continental admixture genetic proportions (Africa, Asia, and Europe) and identify recent migrants whose presence in our data set would affect our results. Principal Component Analysis of AIM profiles identifies three clear-cut clusters (Fig. 4A), one of them grouping all Europeans (including L-European carriers with only one outlier; see comments below), and two other clusters representing East Asians and sub-Saharan Africans. Structure analysis on AIM profiles showed that the full sample of L-European donors analyzed in the present study harbored an average membership in the European cluster of ∼91% and reached ∼97% for the carriers of autochthonous L-European lineages (a value that is comparable with the average membership of other European populations in the same analysis, ∼98%). On the other hand, structure identifies only one European donor belonging to haplogroup L1b2 (the German individual #105 of Fig. 2) with a membership value of ∼98% in the sub-Saharan cluster (Fig. 4B: see the prominent orange bar in the European cluster of the structure bar plot). In addition, ancestry prediction was also performed based on maximum likelihood and the AIMs genotyping profiles (Supplemental Table S9). The results were again concordant with those obtained from PCA and structure (Pritchard et al. 2000): All of the L-European subjects were classified as Europeans, whereas the L1b2 German outlier was the only individual assigned to the African cluster (sample ID #32 in Supplemental Table S9).  Figure 5. A large proportion (65%) of the African-European mtDNAs investigated could be attributed to modern and well-documented demographic routes that existed during the Romanization period, the Arab conquest, and the trans-Atlantic slave trade. However, there is strong evidence pointing to the fact that the remaining 35% of the L-European mtDNAs stand as modern witnesses of sporadic population movements occurring between the two continents that might have begun as early as 11,000 yr ago (Fig. 5). These contacts were not only restricted to North Africa, but connected sub-Saharan regions to Europe directly via coastal routes or first crossing North African territories toward the Mediterranean Sea. Previous studies (Achilli et al. 2005; Ottoni et al. 2010; Pereira et al. 2010) provided evidences of mtDNA flow from Europe toward North Africa during the Holocene; thus, North Africa would represent the Southern African edge of post–Last Glacial Maximum expansions spreading from European refugee. Here, we show, for the first time, genetic evidence signaling prehistorical movements in the opposite direction, from sub-Saharan Africa toward Europe. It is likely that most of the signals in the nuclear genome of this ancestral gene admixture between African immigrants and local Europeans had been erased by historical recombination and genetic drift. Therefore, as demonstrated in the present study, the mtDNA genome (and perhaps the Y chromosome) (Capelli et al. 2009) is the source to rescue the echoes of prehistorical sub-Saharan movements into Europe. Genome Res. 2012. 22: 821-826 |
|
|
|
Post by Admin on Aug 22, 2016 21:24:56 GMT
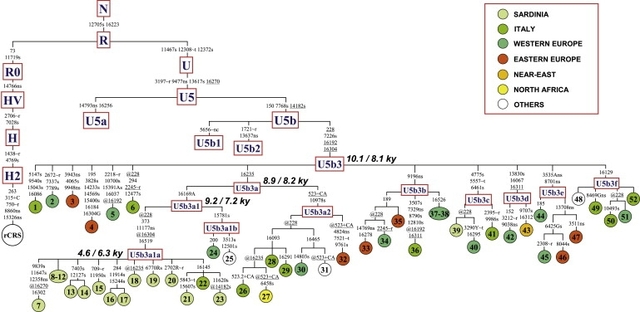 To define the phylogenetic relationships between the U5b3 mtDNAs from Sardinia and the U5 mtDNAs with the related control-region motif, we completely sequenced a total of 43 mtDNAs and, together with nine previously published sequences (Table S1 available online), incorporated them in a phylogeny of haplogroup U5 (Figure 1). All sequences clustered in a U5 clade that is defined by a transition at np 7226 in the coding region—a mutation whose presence can be easily tested at the population level by a survey with the restriction enzyme DdeI. This clade splits into different minor subsets with a clear star-like pattern, including one branch that corresponds to the previously defined U5b3. This finding prompted us to revise the nomenclature and name the entire clade as U5b3, six of its main subsets as U5b3a-f, and the branch encompassing the Sardinian mtDNAs as U5b3a1a (Figure 1). To evaluate the distribution of haplogroup U5b3 in modern European (and neighboring) populations, we performed a survey of all U5 control-region motifs reported in almost 35,000 subjects from 81 population samples. For published and unpublished data sets for which only hypervariable segment I (HVS-I) data were available, U5 mtDNAs were affiliated within U5b3 when lacking 16189 or 16256 and harboring 16304. The presence or absence of the mutations 16169A, 16192, and 16235 was also considered. The results of this survey are reported in Table S2 and illustrated in the spatial distribution of Figure 2. Haplogroup U5b3 is virtually absent in the Near East (the single U5b3 mtDNA found in Iraq was completely sequenced) and North Africa and is rare in Europe where, with the exception of the frequency peak in Sardinians (3.8%), its frequency barely reaches 1% only in some Mediterranean populations.  Out of the 55 U5b3 mtDNAs detected in Sardinians, all but one (sequence n. 39 in Figure 1) are characterized by the diagnostic control-region motif of sub-haplogroup U5b3a1a, whose coalescence time estimate is between 4.6 ky and 6.3 ky (Figure 1 and Table 1). The phylogeny of Figure 1 includes 17 complete sequences belonging to this sub-haplogroup and, with the possible exception of sequence n. 22 that is classified as a generic “Italian” without regional details,43 all are from Sardinia. A search for the U5b3a1a control-region motif in published data sets revealed only two matches (both 16169A-16192-16235-16270) outside Sardinia, one in Sicily44 and one in Rome.45 Details concerning the ancestry of the two subjects are not available, but the geographic proximity of Sardinia to the areas where they were detected makes it likely that they represent recent events of gene flow from the island. This would mean that U5b3a1a has arisen in situ in Sardinia after the arrival of an U5b3a1 founder mtDNA from somewhere else in Europe and that U5b3a1a affiliation is a marker of maternal Sardinian ancestry. The phylogeny of Figure 1 provides additional information concerning the entry time of the founder mtDNA; the upper limit is 9.2–7.2 ky (the age of U5b3a1 node), whereas the lower limit is 4.6–6.3 ky (the age of the U5b3a1a node), when the sub-haplogroup began to expand in Sardinia. The phylogeny of Figure 1 also indicates a possible ancestral source for the founder(s) of the Sardinian U5b3a1a. The Sardinian-specific branch harbors a sister clade (U5b3a1b) formed by two sequences (n. 24 and 25): one from Languedoc, a region of southern France, and the other from a U.S. subject of undefined European ancestry. A search for the U5b3a1b control-region motif (16169A-16192-16235-16270-16304) was able to detect only one additional mtDNA from the southwestern (French-speaking) part of Switzerland,46 matching such a motif. This preliminary observation suggests a stronger link between Sardinia and southern France than with other European regions, including continental Italy. Archaeological data from the period 5–10 kya show that the Monte Arci region of western Sardinia (Oristano province) was one of the four Mediterranean sources (together with the small islands of Palmarola, Lipari, and Pantelleria) of obsidian, the “black gold” of the Neolithic. In particular, a blooming trade of obsidian has been documented from Sardinia to other Mediterranean regions, including southern France. Moreover, it has been calculated that the obsidian employed in the Neolithic sites of the southern France was almost exclusively from a “single” Monte Arci subsource, suggesting not only a preferential link between French sites and Sardinia but also preferential transport mechanisms, different from those connecting Sardinia with other Mediterranean regions (Corsica and northern Italy) where this selection of specific subsources has not been detected.47  What about the ancestral homeland of the entire haplogroup U5b3? Its divergence is virtually identical to that reported for H1 and H3, thus indicating a population expansion at about the same time. Haplogroups H1 and H3 diffused from the Franco-Cantabrian refuge zone when climatic conditions improved;15,18 therefore, it is possible that also the founder U5b3 sequence expanded from the same area and the three haplogroups were involved in the same demographic processes. However, there is also an alternative scenario: the expansion of U5b3 could have still occurred at the same time as H1 and H3 when climatic conditions in Europe changed, but from a distinct geographical source. With consideration to the modern range distribution of U5b3 (Figure 2), the only other potential candidate for the latter scenario is the glacial refuge in the Italian Peninsula. In contrast to the more common mtDNA haplogroups H1 and H3, however, the U5b3 diversity in modern Europe suggests that the glacial refuge located in the Italian Peninsula8,48 rather than the Franco-Cantabrian refuge was the ancestral expansion source for haplogroup U5b3. Postglacial expansions of refugial populations from this area toward the North were restricted not only by cold phases but also by a geographical barrier—the Alps.49 Thus, the ancestral U5b3 haplotype could have expanded (at a low frequency) outside the Italian Peninsula only along the coasts of the Tyrrhenian and Adriatic Seas, mainly toward the nearby Provence (southern France), and from there further west. The root of U5b3a1 originated probably in the Mediterranean coast of southern France and the same haplotype then went into Sardinia some 7–9 kya, possibly as a result of the obsidian trade that linked the two regions. There it expanded at the middle of the Neolithic, giving rise to an mtDNA clade (U5b3a1a) that distinctively marks the people of the island. Remarkably, the events leading to the arrival and expansion of this maternal lineage in Sardinia are not only supported but also magnified by data from male-specific lineages. Indeed ∼37% of Sardinian Y chromosomes belong to haplogroup I2a2-M26,50 a lineage rare outside Sardinia, whose age, distribution, and postulated geographic source (southern France)28 strikingly match those of mtDNA haplogroup U5b3a1—a paradigmatic case of parallel founder events for both maternal and paternal lineages in the European context. Am J Hum Genet. 2009 Jun 12; 84(6): 814–821. |
|
|
|
Post by Admin on Aug 24, 2016 20:58:52 GMT
 To emphasize the cultural and genetic heterogeneity of Sardinia, the three large areas that reflect its ancient history and geography were considered (Figure 1): the northern zone delimited by the mountain chain crossing Sardinia from the central-west to the north-east and linguistically different from the rest of the island; the south-western zone, delineated by the presence of many Phoenician and Carthaginian archeological sites24 and the central-eastern zone, asylum land of the ancient Sardinian population during invasions and domain of pastoral culture. This zone includes the more conservative, or 'archaic' area, defined by archaeological and linguistic25 studies and, more recently, also by studies in geo-linguistics and genetics26 (for a more detailed subdivision of Sardinia on the basis of genes, languages and surnames, see Cavalli-Sforza et al27).  Figure 2 illustrates the world-wide Y-chromosome phylogeny (The Y-chromosome Consortium, 2002),28 where Sardinian Y chromosomes belonging to both monophyletic and polyphyletic surnames are introduced and compared with data from Italy and the Middle East. More than 95% of Sardinian samples fall into haplogroups E-M35, I-M170, J-12f2, G-201 and R-M173. Thus, the haplogroup composition of the Sardinian Y-chromosome pool is very similar to that of Italians and of other Europeans.9,17,29,30,31 The observed differences are therefore mainly quantitative, probably due to isolation and genetic drift. For example, haplogroup I-M170, which has its highest frequency in central-eastern Europe and lower frequencies in western Europe,9,17,32,33 is very frequent in Sardinia. Moreover, the majority of it harbor the additional mutation M26. As for the R-M173 chromosomes, the greater part belongs to the western European R-M269 subcluster, whereas the eastern European subcluster R-M17 is barely represented.  As the other European populations, almost all the Sardinian Y chromosomes belong to haplogroups E-M35, I-M170, G-M201, J-12f2 and R-M269. Haplogroups E, G and J, which are believed to have an African (E) or Middle Eastern (G and J) origin and entered Europe through different migrations,30,34,35 show frequencies in the same range as other Mediterranean populations. By contrast, haplogroups I-M170 and R-M269 harbor unusual frequencies. Haplogroup R-M269 represents 20.8% of the Sardinian Y chromosomes, which is the lowest frequency in Western Europe (50–80%).30 On the contrary, haplogroup I-M170 shows the highest incidence (41.6%) among western European populations (3–22%),30 and most of it (91.9%) is represented by the subclade I-M26 which in addition is characterized by the compound haplotype 49a,f-Ht12, YCAIIa-21, YCAIIb-11 and DYS19-17 previously proposed as a 'Sardinian' marker.36,37 Outside Sardinia, this subclade was only observed at a very low frequency in the Basques,9 the Iberian Peninsula32 and, as inferred by the presence of the YCAIIb-11 (only observed in haplogroup I, and in particular in its subclade M26), in Béarnais, few Corsican and central-southern Italian subjects.38,39,40,41,42 In order to search for genetic heterogeneity inside the island, the effect of migration in the last centuries had to be considered. Indeed, demographic studies on the population evolution of Sardinian communes43 demonstrated that, from 1861 to 1991, the mountain area lost 20% of its population in favor of the plain. The distribution of individuals by birth place compared with that of their ancestors' place of origin seems to reflect this process of homogenization (Figure 3).  So, results shown in Table 1 may enlighten the genetic history of the different parts of Sardinia. The 'Sardinian' subhaplogroup I-M26, which is currently distributed almost uniformly in all parts of the island, shows a high heterogeneity between the areas when samples were redistributed according to the ancestral location of surnames. Interestingly, most surnames of individuals carrying this haplogroup seem to have originated in the central-eastern zone, which includes the archaic area. This supports the antiquity of this haplogroup. Indeed, history tells that indigenous populations retreated to the archaic area when Phoenicians and, later, Carthaginians colonized the southern part of the island, and this was followed by centuries of isolation which allowed genetic drift to increase the haplogroup frequency. Moreover, sub-haplogroup I-M26 shows a frequency significantly lower than that expected in the north and a nonsignificant increase in the southwest. Thus, ancient migrations could have brought this haplogroup from the central area towards the more open southern regions, separated only by a failing cultural barrier, more frequently than towards the northern regions, separated by the less accessible geographic barrier. Afterward, recent migrations have dispersed I-M26 all over the island. The isolation of the central-eastern area could also explain the heterogeneous distribution of the R-M269 and G-M201 haplogroups. The low frequency of haplogroup R-M269 in the central-eastern area of Sardinia and its prevalence in the north suggest that R-M269 arrived to the Sardinian coasts from the continent, possibly after the occurrence and diffusion of the autochthonous I-M26 subhaplogroup, while the high frequency in the northern area of haplogroup G-M201, which is scarcely represented in Europe and in the Middle East,30 could be due to genetic drift. European Journal of Human Genetics (2003) 11, 802–807. doi:10.1038/sj.ejhg.5201040 |
|
|
|
Post by Admin on Feb 20, 2017 20:12:48 GMT
 Figure 1. Map of Eurasia showing the approximate location of ancient (uncalibrated dates) and present-day Eurasian samples. During the Upper Palaeolithic (∼30,000–40,000 years before present, yBP), the northernmost latitudes of Europe were covered by an ice sheet that prevented settlement by anatomically modern humans. With the glacial retreat at the end of the Ice Age (∼11,500 yBP) [21], small foraging groups progressed into NEE from southern periglacial refuges [22]–[23]. As climatic conditions improved in the early Holocene (8,000–10,000 yBP), the first human settlements appeared in the Kola Peninsula [24], and foraging activities intensified in the steppe-forest zone of Northern Europe leading to the widespread establishment of complex Mesolithic societies of fishermen and hunter-gatherers [23], [25]–[26]. At the same time, Western Europe and CE were undergoing the Neolithic transition, during which an agricultural lifestyle spread rapidly, largely due to favorable climatic and ecological conditions. The Neolithic transition is thought to have been slower and more gradual in NEE than in Western/Central Europe and to have involved little migration of early farmers from CE [27]. From the Neolithic onwards, contacts between populations of NEE and groups living in the South are evident in archaeological and historical records [24]. Around the Baltic, historical records describe numerous population movements that originated in Scandinavia (e.g., Viking incursions ∼800 Anno Domini, AD [28]), Western/Central Europe (e.g., the Slavic migrations ∼700–1,000 AD [29]) or Central/East Siberia (e.g., the Mongol invasions ∼500–700 AD [30]). The geographical position of NEE makes it subject to influences from both Western and Eastern Eurasia, which could explain the linguistic and cultural diversity, observed in the area today. Two different linguistic families are spoken: Indo-European languages (Slavic, Baltic and Germanic) and Finno-Ugric languages (e.g., Estonian, Finnish, Mari, Saami [31]). Saami people of Fennoscandia (northern Norway, Sweden, Finland and Russia) are considered unique among Europeans in terms of their nomadic lifestyle and their livelihood, which is mainly based on fishing and reindeer herding. The ethnogenesis of the Saami remains unclear and two origins in Western and Eastern Europe were proposed [24], [32]–[33]. The Saami differ from the rest of the European populations in their reduced genetic diversity [1], [34]–[35], and mtDNA lineages that are otherwise very rare in European populations (haplogroups or hgs, U5b1b1a, V, Z1 and D5). In particular, the Saami-specific U5b1b1a clade is defined by the so-called hypervariable region I (HVR-I) ‘Saami motif’ 16144C-16189C-16270T (numbering according [36]) [37]. These lineages are also detected at low frequencies in adjacent NEE populations [32], [38]–[40], which on the other hand fall within the European mtDNA diversity and appear rather homogeneous irrespective of their languages [3]–[5], [38], [40]. Subtle mtDNA differences are however observed among them due to variable influences from genetically differentiated neighboring populations: central Europeans in the West, Saami in the North, and people from the VUB in the East. 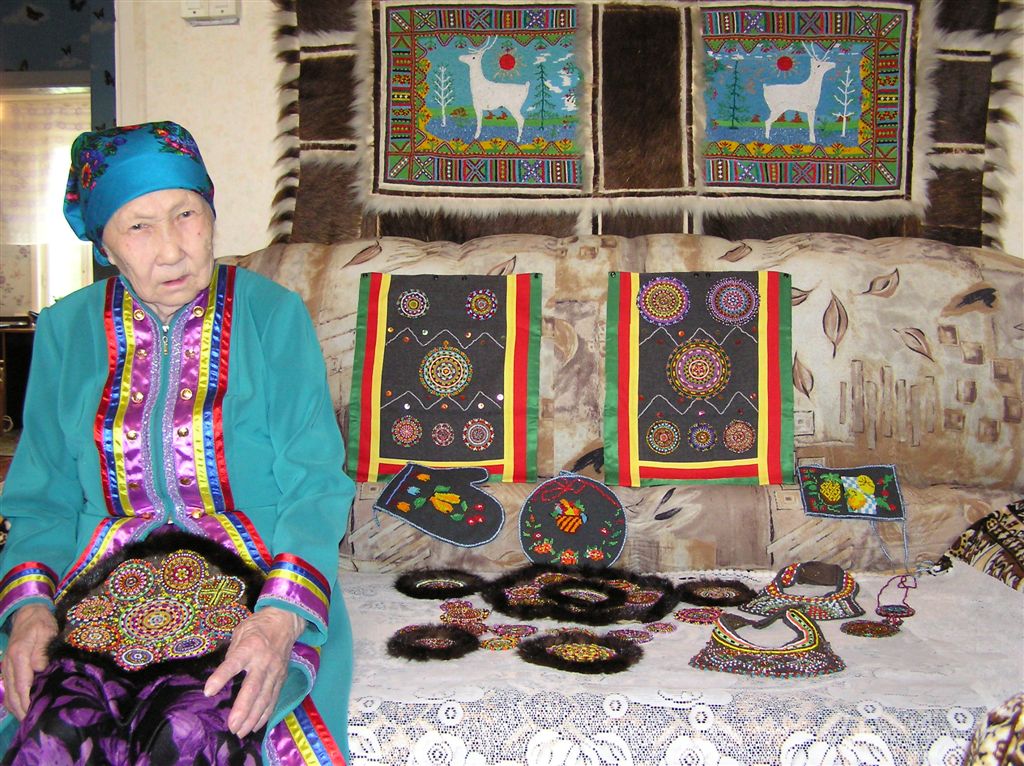 The absence of strong structure in the present-day mtDNA gene pool of NEE stands in contrast to the variety of languages and cultures, and to the complex history of how and when these were formed. Modern mtDNA data does not resolve the origins of the Saami either. Our aim was to provide answers to these questions and reconstruct events in the genetic history of NEE by generating and analyzing ancient DNA (aDNA) data from prehistoric human remains collected in northwest Russia (Figure 1). In particular, our objective was to characterize the genetic relationships between hunter-gatherer populations in NEE and Central/Northern Europe and to estimate the genetic legacy of ancient populations to present-day NEE and Saami. The oldest samples were collected in the Mesolithic graveyards of Yuzhnyy Oleni Ostrov (aUz; ‘Southern Reindeer Island’ in Russian) and Popovo (aPo), both dated around 7,000–7,500 uncalibrated. yBP, uncal. yBP. The sites of aUz and aPo are located along one of the proposed eastern routes for the introduction of Saami-specific mtDNA lineages [32]. Results from odontometric analyses suggested a direct genetic continuity between the Mesolithic population of Yuzhnyy Oleni Ostrov and present-day Saami [41]. We also analyzed human remains from 3,500 uncal. yBP site Bol'shoy Oleni Ostrov (aBOO; ‘Great Reindeer island’ in Russian) in the Kola Peninsula. This site is located within the area currently inhabited by the Saami. We compared the ancient mtDNA data from NEE with a large dataset of ancient and modern-day Eurasian populations to search for evidence of past demographic events and temporal patterns of genetic continuity and discontinuity in Europe.  Figure 2. Principal Component Analysis of mitochondrial haplogroup frequencies. The first two dimensions account for 41.5% of the total variance. Grey arrows represent haplogroup loading vectors, i.e., the contribution of each haplogroup. Red dots represent ancient populations described in this study: aUzPo, Yuzhnyy Oleni Ostrov and Popovo (7,500 uncal. yBP); aBOO, Bol'shoy Oleni Ostrov (3,500 uncal. yBP). Other ancient populations were labeled as follows: aEG, Confederated nomads of the Xiongnu (4,250-2,300 yBP); aHG, Palaeolithic/Mesolithic hunter-gatherers of Central/East Europe (4,250-30,000 yBP); aKAZ, Nomads from Kazakhstan (2,100–3,400 yBP); aKUR, Siberian Kurgans (1,600–3,800 yBP); aLBK, Neolithic individuals from Germany (7,000–7,500 yBP); aLOK, Lokomotiv Kitoi Neolithic individuals (6,130–7,140 yBP); aSP, Neolithic individuals from Spain (5,000–5,500 yBP); aPWC, Scandinavian Pitted-Ware Culture foragers (4,500–5,300 yBP); aUST, Ust'Ida Neolithic population (4,000–5,800 yBP). Extant populations were abbreviated as follows: ALB, Albanians; ale, Aleuts; alt, Altaians; ARM, Armenians; aro, Arorums; AUT, Austrians; AZE, Azerbaijani; BA, Bashkirs; bas, Basques; BEL, Belarusians; BGR, Bulgarians; BIH, Bosnians; BU, Buryats; CHE, Swiss; CHU, Chukchi; CU, Chuvashes; CYP, Cypriots; CZE, Czechs; DEU, Germans; esk, Eskimos; ESP, Spanish; EST, Estonians; eve, Evenks; evn, Evens; FIN, Finns; FRA, French; GBR, British; GEO, Georgians; GRC, Greeks; HRV, Croatians; HUN, Hungarians; ing, Ingrians; IRL, Irish; IRN, Iranians; IRQ, Iraqi; ISL, Icelanders; IT-88, Sardinians; ITA, Italians; JOR, Jordanians; kab, Kabardians; ket, Kets; kham, Khamnigans; khan, Khants; KK, Khakhassians; KO, Komi; kor, Koryaks; KR, Karelians; kur, Kurds; LTU, Lithuanians; LVA, Latvians; man, Mansi; ME, Mari; MNG, Mongolians; MO, Mordvinians; NEN_A, eastern Nenets; NEN_E, western Nenets; nga, Nganasans; niv, Nivkhs; nog, Nogays; NOR, Norwegians; POL, Poles; PRT, Portuguese; PSE, Palestinans; ROU, Romanians; RUS, Russians; SA, Yakuts; saa, Saami; SAU, Saudi Arabians; SE, Ossets; sel, Selkups; sho, Shors; SVK, Slovakians; SVN, Slovenians; SWE, Swedes; SYR, Syrians; TA, Tatars; tel, Telenghits; tof, Tofalars; tub, Tubalars; TUR, Turks; tuv, Tuvinians; UD, Udmurts; UKR, Ukrainians; ulc, Ulchi; vep, Vepses; yuk, Yukaghirs. In order to identify the genetic affinities of the two ancient populations with other ancient and present-day Eurasian populations, mtDNA hg distributions were compared by Principal Component Analysis (PCA). The PCA plot of the first two components (41.5% of the total variance, Figure 2) showed that present-day populations largely segregate into three main clusters: Europeans (in yellow), Middle Easterners (in grey) and Central/East Siberians (in blue). The spread of extant populations of Europe and Central/East Siberia along the first component axis (28.5% of the variance) appeared to reflect their longitudinal position, whereas Europeans and Middle Easterners were separated along the second component axis (13.0% of the variance). As shown previously, populations of the ‘Central/East Siberian’ cluster were predominantly composed of hgs A, B, C, D, F, G, Y, and Z, while in contrast populations of the ‘European’ cluster were characterized by higher frequencies of hgs H, HV, V, U, K, J, T, W, X, and I (e.g., [43]–[47]). The two ancient groups - aUzPo and aBOO - from two individual time periods appeared remarkably distinct on the basis of the PCA, suggesting a major genetic discontinuity in space and time. 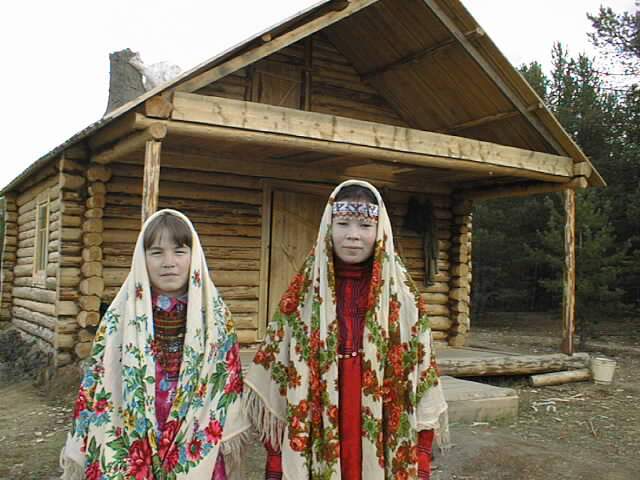 Khanty women The hg distribution in the Mesolithic aUzPo population: U4 (37%), C (27%), U2e (18%), U5a (9%), and H (9%), indicated an ‘admixed’ composition of ‘European’ (U4, U2e, U5a and H, 73%) and ‘Central/East Siberian’ (C, 27%) hgs, based on the PCA plot (Figure 2). Interestingly, the population of aUzPo did not group with modern NEE populations, including Saami, but fell instead between the present-day ‘European’ and ‘Central/East Siberian’ clusters on the PCA graph, and more precisely between populations of the VUB (in light green) and West Siberia (in dark green). The high frequency of hg U4 is a feature shared between Mesolithic aUzPo, present-day VUB (Komi, Chuvashes, Mari), and West Siberian populations (Kets, Selkups, Mansi, Khants, Nenets), with the latter group also being characterized, like aUzPo, by the presence of hg C. The genetic affinity between Mesolithic aUzPo and present-day West Siberian populations could be visualized on the genetic distance map of North Eurasia (Figure 3A), on which locally lighter colorings indicated low values of genetic distances, and therefore an affinity between aUzPo and extant West Siberians. |
|

