Post by Admin on Aug 27, 2014 21:05:57 GMT

Eastern Europeans and British Asians from India and Pakistan share the same haplogroup called R1a-M17. The R1b tribe originally migrated to Europe from West Asia from 4,000 BCE and the Indo-Europeans have shared ancestry that can be traced back to North India, which is why the Spaniards and some Europeans without Scandinavian admixture are physically similar to Asians.
Genetic structure of the studied regional population groups
We observed a total of 19 Y-haplogroups in our analyzed dataset of 621 Y-chromosomes (Table 1) defined by 31 informative polymorphisms out of 55 genotyped binary polymorphisms (Supplementary Figure 1). It has been argued in the literature that the Indian higher caste groups show relatively small genetic distances when compared with the West Eurasians,11 linking this to hypothetical migrations by Indo-Aryan speakers. Further, M17-R1a (presently designated as R1a1) was suggested as a potential marker with decreasing frequencies from Central Asia towards South India.23 On similar lines, it was suggested that a package of Y-HGs (J2, R1a, R2 and L) was associated with the migration of Indo-European people from Central Asia.7 Although our study observed a high frequency of Y-HGs, R1a1, J*/J2, R2 and L, it was not exclusively restricted to any region or population (Table 1). Moreover, most of the population groups from the studied regions showed a less frequency of the highly frequent haplogroups of Central Asia: C3, DE, I, G, J*, N and O, except for some population-specific distributions. Y-haplogroup G was observed to be present at high frequency in Gujarat Brahmins and Bihar Paswans, whereas Y-haplogroup O was more frequent in Uttar Pradesh Kols and Gonds (Table 1). In case of a recent gene flow (associated with the migration of Indo-European people), we expected the more frequent Central Asian Y-haplogroups (C3, DE, I, G, J*, N and O)12 to be present at least at similar frequencies, as observed for R1a1* in Northwest India, which, however, was not the case in this study.
Comparison of Brahmins and scheduled castes/tribals
To explore further, we analyzed the dataset (consisting of 510 Y-chromosomes), which could be classified as Brahmins (n=256) and scheduled castes/tribes (n=254) from the studied six regions of India (Jammu and Kashmir, Uttar Pradesh, Bihar, Madhya Pradesh, Maharastra and Gujarat) to evaluate regional distribution patterns between these two extreme end population groups of the Hindu caste hierarchy (Supplementary Table 1), where intermixing due to marriages has been absent because of social unacceptability. AMOVA showed no variation between different geographical regions (−2.3%), some variation between populations within regions (12.67%) and most of the variation within populations (89.63%). The percentage distribution of haplogroups (Supplementary Table 1) in Brahmins (n=256) showed a total of six most frequent (percentage >5%) haplogroups: R1a1* (40.63%), J2 (12.5%), R2 (8.59%), L (7.81%), H1 (6.25%) and R1* (5.47%), contributing to 81.25% of the total distribution in Brahmins. Tribals and scheduled castes (n=254) also showed six haplogroups: H1 (31.10%), R1a1* (20.47%), J2 (10.24%), L (7.87%), H* (7.87%) and O (6.69%), contributing in total to 84.25%. Interestingly, four of the haplogroups were overlapping in percentage (>5%) distribution with Brahmins. The haplogroup diversity and s.d. in each population are also given in Supplementary Table 1.higher resolution of R1a1* and confirm the present conclusions.
Study of the compiled dataset
The pooled percentage distribution of Y-haplogroups in the overall dataset of 2809 Y-chromosomes (767 Brahmins, 674 schedule castes and 1368 tribals) is summarized in Supplementary Table 2. All together (Brahmins, schedule castes and tribals), 22 Y-haplogroups were observed. The percentages of seven of these haplogroups (with percentage >5%) accounted for 85.5% of the total number of Y-chromosomes (n=2809). The haplogroups with their percentages in descending order were: R1a1* (21.1%), H1 (19.1%), R2 (10.5%), O (10.1%), L (9.5%), J*/J2 (8.3%) and F* (6.9%). These haplogroups remained the most frequent haplogroups even after the distribution of Y-chromosomes within respective groups of Brahmins, schedule castes and tribals, but with significant percentage differences (Supplementary Table 2). Five haplogroups out of 18 were found to be most frequent (>5%) in Brahmins (R1a1* (35.7%), J*/J2 (12.4%), L (11.3%), R2 (10.8%) and H1 (8.0%)) and represented 78.2% of the total number of samples (n =767), whereas haplogroup O was found to be very less frequent (0.7%) in Brahmin Y-chromosomes. Seven out of 14 haplogroups (with percentage >5%) (H1 (24.2%), R1a1* (17.2%), R2 (14.2%), L (12.2%), F* (9.8%), J*/J2 (6.4%) and K* (5.3%)) represented 89.3% of the total number of Dalit Y-chromosomes (n =674). Tribal Y-chromosomes represented by seven out of 20 haplogroups displayed percentages >5%: O (25.5%), H1 (25.3%), R1a1* (10.2%), F* (7.5%), R2 (6.4%), J*/J2 (6.1%) and L (5%) (86% of the total number of samples (n=1368)). All other observed haplogroups had their percentages <5% (Supplementary Table 2). The study was further extended, dividing the samples into four main linguistic categories (Indo-European (IE), Dravidian (DR), Tibeto-Burman (TB) and Austro-Asiatic (AA)) present in India as well as five regional categories (Central, East, North, South and West India). Y-haplogroup distributions as per these categories are presented in Supplementary Figures 3a and b. AMOVA was also done using the compiled dataset and by characterizing the populations into social, geographical and linguistic groups (Table 2). Geographical regions showed very less variation (0.79%) among the groups but higher variation between populations within groups (16.94%). In contrast, linguistic groups showed higher variation among the groups (15.56%) but lower variation between populations within linguistic groups (6.15%). Interestingly, when the TB linguistic group was removed from the analysis, the percentage variation among the groups reduced (9.43%) but variation between populations remained almost the same (Table 2). It was observed that by either of the grouping most of the variation was within the population groups.

Figure 1. The spatial distribution maps of Y-haplogroup R1a1 generated by the Kriging procedure using SURFER version 8.0. (a) Spatial frequency distribution of Y-haplogroup R1a1* across Eurasia, Central Asia and the Indian subcontinent. (b) Spatial distribution of Y-haplogroup R1a1*-associated diversity based on microsatellite markers.
Origin of Y-haplogroup R1a1*
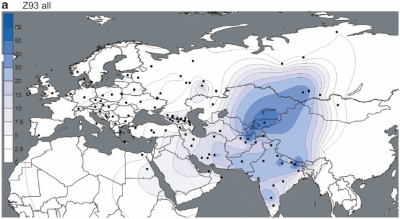
However, a peculiar trend in distribution of the highest frequency of Y-haplogroup R1a1* (Table 1) in Brahmins, H1 in tribals and schedule castes, and O in tribals was also observed. Whereas on the one hand a consensus has developed in the literature among all schools of thought in assigning Indian origin to haplogroup H1 and in the association of haplogroup O with either Austro-Asiatic or Tibeto-Burman tribals, the widespread geographic distribution of R1a1* and reasonably high frequency across Eurasia (Figure 1a), with scanty representation of its ancestral (R*, R1* and R1a*) and derived lineages (R1a1a, R1a1b and R1a1c) across the region, leaves obscure the question of origin of R1a1*. This becomes more complex with the claims7, 9, 12, 23 proposing a scenario of the recent major gene flow from Central Asia to India and the antagonistic observations9, 12 of its highest variance in India, suggesting the gene flow in opposite direction. Further, the observation of a very high frequency (upto 72.22%) in this study (Table 1) and in the literature (Supplementary Figures 3a and b) of this haplogroup in all of the Brahmins may indicate its presence as a founder lineage for this caste group (irrespective of the geographical and linguistic affiliation of Brahmins), thus making this haplogroup of extreme importance and a key haplogroup in answering the question of origin of caste systems in India.
Although the geographic origins of haplogroup expansions can be inferred from the frequencies, associated diversity51 and clinal patterns of distribution, past inferences from literature indicate that such relations are not so simple to interpret. It is observed that regions of high frequency and high variance are not always the same. Regions with highest haplogroup frequencies are not always sites of its origin and clinal patterns are not obvious in binary HG frequency data;33 also, the highly associated microsatellite variance, exclusively, may not always be an indicator of in-situ diversification and could result as a consequence of repeated gene flow from different sources52, 53 as observed by Y-chromosomal diversity in Central Asia.32 This suggests that many analytical parameters should be included and potential causes of a wrong interpretation should be taken care of before reaching any conclusion. All rival models of the origin of caste system were taken into consideration and results were analyzed to the highest Y-SNP marker resolution for the R1a haplogroup (Supplementary Figure 1), in addition to adding data and information from the literature, making a pooled dataset of the R1a1* haplogroup containing ~1030 individuals (530 Indians, 224 Pakistanis, and 276 Central Asians and Eurasians) from around the Indian-subcontinent, Central Asia and Europe. Using different phylogenetic tools and parameters (mentioned in Materials and methods) and concentrating on the distribution of R1a1* and its ancestral lineages, the answer to the source and expansion of this haplogroup, across the globe, was explored.
Spatial frequency and molecular diversity distribution of R1a1* in Eurasia, Central Asia and the Indian subcontinent
The spatial frequency distribution of R1a1* across Eurasia along with spatial representation of associated diversity based on microsatellite markers within the haplogroup are given in Figures 1a and b. It was interesting to find that by adding information regarding the frequency and diversity of R1a1* from different population groups of North India (Information from North Indian population groups was scanty in earlier publications from India.) to the pooled data from different published sources, a clearer picture emerged, with overlapping high frequency and molecular diversity of R1a1* within India.
Admixture and diversity analysis
Considering the very high frequency of R1a1* (upto 72.22% as in WB) in Brahmins, irrespective of their geographical and linguistic affiliations, admixture analysis41 based on pooled data was performed. Three models of potential parental contributions of R1a1* (Figure 2) were tested, to evaluate the concepts of Central Asian introduction of the Indian caste system7 by Indo-Aryans (appointing themselves to the castes of higher ranks),14 as well as of rank-related West Eurasian admixture.11, 21 The observed proportions of contributions, taking all populations (Europeans (EU), Central Asians (CA) and Indian Brahmins (IB)) alternatively as source populations under different models (Figure 2), suggested model 3 (CA+IB → EU) as the best fit model (tested by 1000 bootstraps) and model 2 also as a possibility, for contributions of R1a1*, based on both proportion of frequency distribution as well as molecular divergence. Admixture analysis in light of other genetic evidences from this study did not seem to favor either Central Asian origin of the haplogroup or rank-related Eurasian admixture; instead it supported the Indian origin of this haplogroup and its contributions to other regions.

Figure 2. Unfortunately we are unable to provide accessible alternative text for this. If you require assistance to access this image, please contact help@nature.com or the author
Admixture proportions were estimated using ADMIX2 software under different models. All populations (Europeans (EU), Central Asians (CA) and Indian Brahmins (IB)) were considered alternatively as source populations and the respective proportions of contributions were estimated. mY1 and mY2 are the estimated admixture coefficients, corresponding to the relative contribution to the hybrid population (Hyb) from the parental populations (P1 and P2, respectively).
Further, the average diversity of the R1a1* haplogroup in Central Asians, Europeans and Indians was also calculated. The highest diversity of 0.52 (for both sampling and stochastic processes s.d.=0.32) was observed in Indians when compared with Europeans (0.40, s.d.=0.27) and Central Asians (0.32, s.d.=0.23). The calculation of Spearman's rank correlation coefficients46 between the latitude and longitude with haplogroup R1a1* frequency (r2=−0.13, 0.30) did not show any significant correlation, The same observation for R1a1* diversity (r2=−0.25, 0.20) has been reported earlier as well.9 This observation is again in favor of the suggestion that there has been no bulk migration from Central Asia to India.
Molecular evidences for the origin of R1a1* in the Indian subcontinent
The median joining network40 was also constructed. This algorithm provides the best results when applied on datasets of multi-state markers but within closely related haplotypes54 as is the case, using pooled data of R1a1* haplogroup. The inferences from the analysis (Figure 3) were again in favor of our earlier observations. The Indian haplotypes were observed to be the most diverse, and haplotypes spanning Central Asia and Eurasia, along with some Indian regional haplotypes, seemed to be derived as a subset of this diversity. The extremely high level of sharing of haplotypes across the regions as well as reticulations, mostly with one step difference, in this subset suggests parallel evolution of different haplotypes, which appears more plausible after their geographical distribution and expansions. However, the diversity within the Indian populations, represented by the long branches and links connecting many haplotypes, is also an indicator of their ancestry, geographical differentiation and severe bottlenecks within India, suggesting loss of many of the intermediate haplotypes, thus reducing the reticulation and increasing the branches’ length. The observed genetic distances FST38 and 1−PSA44 within the R1a1* haplogroup, between Central Asians (CA), Europeans (EU), as well as pooled populations of the Indian subcontinent (IS) showed overlapping trends of distribution. FST is based on the total variance in allele frequencies among populations and 1−PSA considers shared allele frequencies. IS populations showed less sharing with the CA (FST=0.095, 1−PSA=0.61) as compared with the EU (FST=0.021, 1−PSA=0.73) populations. AMOVA for these three pooled population groups (EU, CA, IS) showed that 94.07% of the total variation is present within the population, whereas only 5.93% of the differences are observed among population groups.

Figure 3. Unfortunately we are unable to provide accessible alternative text for this. If you require assistance to access this image, please contact help@nature.com or the author
Median joining network based on Y-STR haplotypes within Y-haplogroup R1a1*, showing the relationship between Indian, Central Asian and Eurasian population groups. *Biallelic marker M17 was included with the highest weight. The root of the network represents an individual with SRY10831b-R1a* (x M17-R1a1).
Age estimates for Y-haplogroup R1a1*
The age of microsatellite variations was re-calculated using Y-STRs data and by applying mutation rates and generation times (discussed in Materials and methods) within R1a1* lineage in Central Asia, Eurasia, Pakistan, as well as Indian populations (Table 3), and compared with the already published ages. The ages of the haplogroup, within the various population groups of India as well as after distributing them to social groups, were also calculated (Table 3). It was observed that the age of R1a1* was the highest in the Indian subcontinent. Interestingly, among different groups, the age of Y-haplogroup R1a1* was highest in scheduled castes/tribes when compared with Central Asians and Eurasians. These observations weaken the hypothesis of introduction of this haplogroup and the origin of Indian higher most castes from Central Asian and Eurasian regions, supporting their origin within the Indian subcontinent. Further, a particular population group of northern India, the Kashmiri Pandits (KPs), showed the highest variance (0.52) and thus the respective age (Table 3). Another north Indian population group, Himachal Brahmins, also showed higher variance (0.43) than that of the average Indian population.
High frequency of Y-haplogroup R1a1* in tribal populations and ancestral Y-haplogroup R1a* in the Indian subcontinent
Y-haplogroup R1a1* has been reported to be present in the tribal population in many of the earlier studies, but with very less frequency. In this study, a tribe named Saharia from Madhya Pradesh (Central India) showed the presence of R1a1* with high diversity in 19/71 males (26.76%), negating the idea of later admixture or some founder effect. Similar observations were made in the Chenchu tribe of Andhra Pradesh,24 with a high percentage (26.82%) of R1a1*.

Figure 4. Unfortunately we are unable to provide accessible alternative text for this. If you require assistance to access this image, please contact help@nature.com or the author
Median joining network based on Y-STR haplotypes showing the relationship between Kashmiri and Saharia Y-chromosomes bearing Y-haplogroups R1a* and R1a1*. Biallelic markers M17 and SRY10831b were also included and given the highest weight. The root of the network represents an individual with M173-R1* (x SRY10831b-R1a).
Apart from the observation of a simultaneous presence of R1a*, the ancestral haplogroup of R1a1* was also observed in this study with a highest ever known frequency in the two population groups KPs and Saharia. Incidentally, KPs are Brahmins, whereas Saharia is a tribal population group. Scanty representation of the R1a* haplogroup and its ancestral lineages (R*, R1*) in any of the geographical regions and the presence of the R1a1* haplogroup at high frequency across Central Asia and Eurasia had kept alive the question of the origin of R1a1* and associated conflicts. With the high-resolution analyses of the haplogroup (R1) in some population groups that were absent in the earlier studies and with the addition of published datasets, we were able to provide a clearer picture of the origin of R1a1* haplogroup and solve the existing conflict in literature. The calculated age for the haplogroup R1a* in both the population groups showed fascinating results. It was observed that the variance (0.43) of R1a*, and hence the respective age of this ancestral haplogroup, was far less in Kashmiris than the observed variance (0.52) and age of the derived R1a1*. However, a variance of 0.6 was observed in the Saharia tribe for R1a*, providing the age of 21 739.13 with 95% CI 15 789.47–34 883.72 years to this haplogroup. The haplogroup R1a1* was found to have an age of 13 043.48 and 95% CI 9473.68–20 930.23 years. To resolve the contradiction in these observations, we tried to explore the whole of the R1a lineage in these two population groups. By providing higher weight to the SNP (M17 that defines R1a1*) in the median joining network of Y-STR haplotypes within the R1a lineage among KPs and Saharia (Figure 4), we were able to elucidate some important inferences based on the clustering of the haplotypes. Two main clusters differentiating R1a* and R1a1* haplogroups were observed at the first instance. Further, subclustering based on population groups could be seen within these major clusters. However, few individuals belonging to KPs were seen in the Saharia population group clusters and vice versa, representing both R1a* and R1a1* haplogroups. It was particularly interesting to observe close overlaps in R1a1* cluster. Further, the long branches and less networking in both of the clusters (R1a* and R1a1*) again indicated bottlenecks and expansions, eliminating many of the haplotypes and resulting in long branches in the median joining tree. The exclusive high presence of the ancestral R1a* lineage in KPs and Saharias, their level of sharing, observed by way of a PSA of 0.51 (based on the average of Y-STRs within R1a*) and clustering in the network, suggested their deep common ancestry, a probable source population for the origin of R1a1* and for Brahmins, which later on differed in the two population groups. This observation of a close relationship was reflected in the MDS plot based on FST values obtained from a haplotypic analysis of 6Y-STRs within R1a1* (Supplementary Figure 5). Some of the other evidences hinting at this closeness are reflected in the cultural practices as well as folklores of these population groups.
Conclusions
The observation of R1a* in high frequency for the first time in the literature, as well as analyses using different phylogenetic methods, resolved the controversy of the origin of R1a1*, supporting its origin in the Indian subcontinent. Simultaneously, the presence of R1a1* in very high frequency in Brahmins, irrespective of linguistic and geographic affiliations, suggested it as the founder haplogroup for the population. The co-presence of this haplogroup in many of the tribal populations of India, its existence in high frequency in Saharia (present study) and Chenchu tribes, the high frequency of R1a* in Kashmiri Pandits (KPs—Brahmins) as well as Saharia (tribe) and associated phylogenetic ages supported the autochthonous origin and tribal links of Indian Brahmins, confronting the concepts of recent Central Asian introduction and rank-related Eurasian contribution of the Indian caste system.
However, there is a scanty representation of Y-haplogroup R1a1 subgroups in the literature as well as in this study. The known subgroups (R1a1a, R1a1b and R1a1c), which are defined by binary markers M56, M157 or M87, respectively (Supplementary Figure 1), were not observed. In such a situation, it is likely that this haplogroup (R1a1*) is a polyphyletic (or paraphyletic) group of Y-lineages. It is, therefore, very important to discover novel Y chromosomal binary marker(s) for defining monophyletic subhaplogroup(s) belonging to Y-R1a1* with a higher resolution to confirm the present conclusion. Further, the under-representation of phylogenetic data of the population groups of North India in the literature and our observations hint at the immense need of phylogenetic explorations in the northern most Himalayan regions of India, which might have acted as an incubator of many ancient lineages, to obtain a clearer picture of the peopling of India and Eurasia.
Sharma, Swarkar, et al. "The Indian origin of paternal haplogroup R1a1* substantiates the autochthonous origin of Brahmins and the caste system." Journal of human genetics 54.1 (2009): 47-55.


