Post by Admin on Nov 13, 2016 20:54:36 GMT
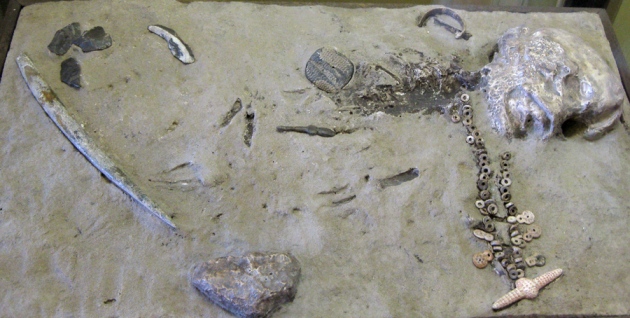
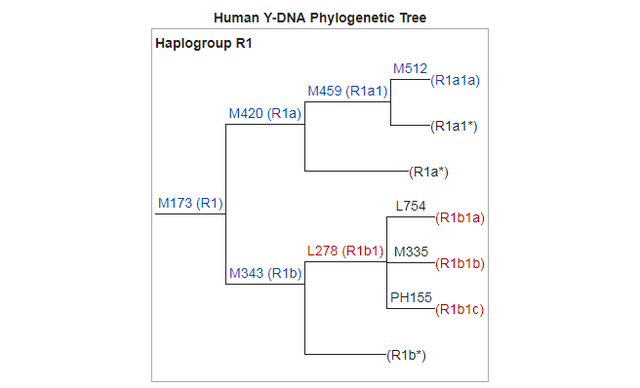
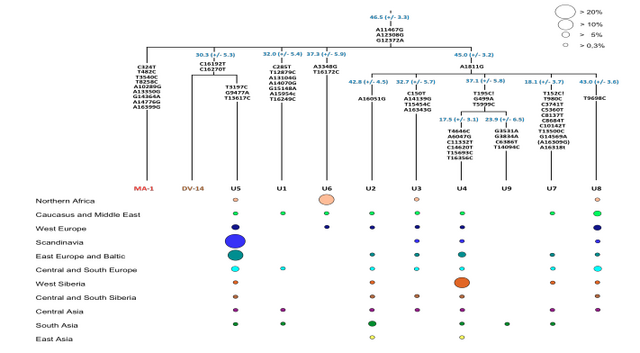
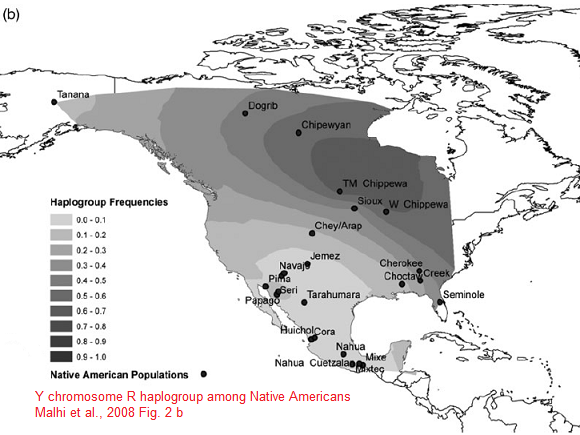
Y-DNA Haplogroup R1 (specially R1b) is the second most predominant Y haplotype found after Q. Western Eurasian genetic signatures in modern-day Amerindians such as R1b derive mostly from a mixed ancestry of the First Americans or Canadians, rather than post-Columbian admixture as it's commonly thought. Raghavan et al. (2014) found that 14 to 38% of Native American ancestry may originate through gene flow from an ancient European population (MA-1). MA-1 had haplogroup R* (Y-DNA) that diverged before the hg R1 and R2 split. MA-1 belongs to Y-DNA haplogroup R* and mtDNA haplogroup U. Haplogroup U is a typical haplogroup of European hunter-gatherers and Y-DNA haplogroup R* is the ancestral haplogroup for R1a and R1b and no East Asian haplogroup such as Q was present in the MA-1 genome. West Siberian populations such as Mansi and Khants have the high frequency of hg U4, which is a West Eurasian haplogroup inherited from ancient European hunting-gatherers. The presence of hg C, which is a typical Asian haplogroup, is a result of population admixture which goes back to 6,000–10,000 years ago. Ancient Siberians who lived around 24,000-10,000 years ago had no East Asian admixture. Raghavan et al. (2014) found that MA-1 is basal to modern-day western Eurasians and it's also related to modern-day Native Americans (14-38%). Native Americans carry a high frequency of R1 (R-M173), which may be partly derived from the Mal'ta boy (MA-1) in addition to post-Columbian admixture. Haplogroup R-M173 (R1) is common among some Native American tribes (38-79%) and R1 is also widespread among certain south-central Siberian groups.
The origins of the First Americans remain contentious. Although Native Americans seem to be genetically most closely related to east Asians1–3, there is no consensus with regard to which specific Old World populations they are closest to4–8. Here we sequence the draft genome of an approximately 24,000-year-old individual (MA-1), from Mal’ta in south-central Siberia9, to an average depth of 13. To our knowledge this is the oldest anatomically modern human genome reported to date. The MA-1 mitochondrial genome belongs to haplogroup U, which has also been found at high frequency among Upper Palaeolithic and Mesolithic European hunter-gatherers10–12, and the Y chromosome of MA-1 is basal to modern-day western Eurasians and near the root of most Native American lineages5. Similarly, we find autosomal evidence that MA-1 is basal to modern-day western Eurasians and genetically closely related to modern-day Native Americans, with no close affinity to east Asians. This suggests that populations related to contemporary western Eurasians had a more north-easterly distribution 24,000 years ago than commonly thought.
Furthermore, we estimate that 14 to 38% of Native American ancestry may originate through gene flow from this ancient population. This is likely to have occurred after the divergence of Native American ancestors from east Asian ancestors, but before the diversification of Native American populations in the New World. Gene flow from the MA-1 lineage into Native American ancestors could explain why several crania from the First Americans have been reported as bearing morphological characteristics that do not resemble those of east Asians2,13. Sequencing of another south-central Siberian, Afontova Gora-2 dating to approximately 17,000 years ago14, revealed similar autosomal genetic signatures as MA-1, suggesting that the region was continuously occupied by humans throughout the Last Glacial Maximum. Our findings reveal that western Eurasian genetic signatures in modern-day Native Americans derive not only from post-Columbian admixture, as commonly thought, but also from a mixed ancestry of the First Americans.

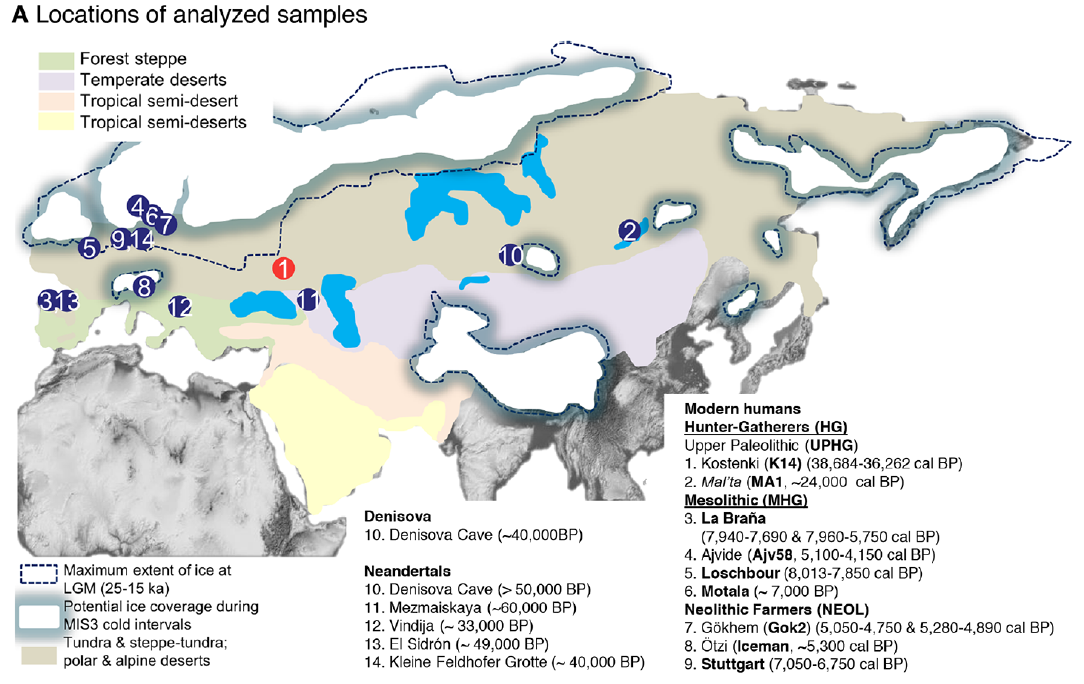
In 2009 we visited Hermitage State Museum in St. Petersburg, Russia, and sampled skeletal remains of a juvenile individual (MA-1) from the Mal’ta Upper Palaeolithic site in south-central Siberia. Mal’ta, located along the Belaya River near Lake Baikal, was excavated between 1928 and 1958 (ref. 9) and yielded a plethora of archaeological finds including 30anthropomorphic Venus figurines, which are rare for Siberia but found at a number of Upper Palaeolithic sites across western Eurasia15–17 (Fig. 1a and Supplementary Information, section 1). Accelerator mass spectrometry (AMS) 14C dating of MA-1 produced an age of 20,240 ± 60 14C years before present or24,423–23,891calendar years before present (cal. bp) (Supplementary Information, section 2).
DNA from 0.15 g of bone from MA-1 was sequenced to an average depth of 13 (Supplementary Information, section 3). From one library (referred to as MA-1_1stextraction in Supplementary Information, section 3.1), approximately 17% of the total reads generated mapped uniquely to the human genome, in agreement with good DNA preservation (see Supplementary Information Table 2). Low contamination rates were inferred for both mitochondrial DNA (mtDNA) (1.1%) and the X chromosome (1.6 to 2%; MA-1 is male) (Supplementary Information, section 5). The overall error rate for the data set was estimated to be 0.27%, with the most dominant errors being transitions typical of ancient DNA damage deriving from post-mortem deamination of cytosine18 (Supplementary Information, section 6.1).
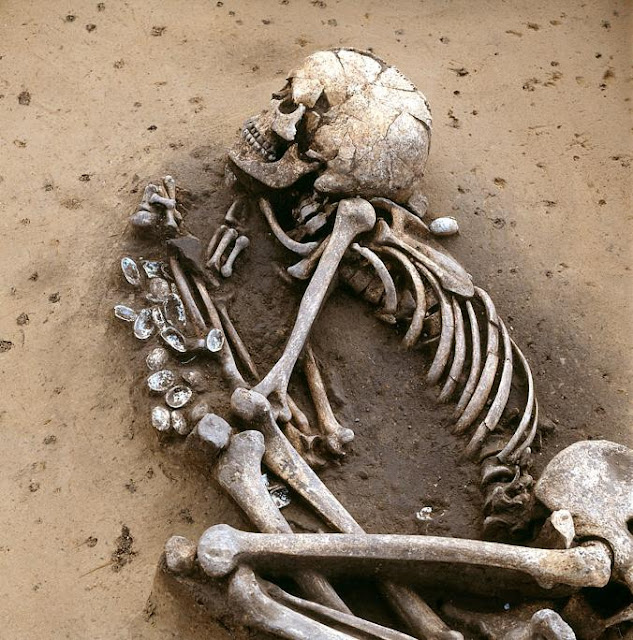
Phylogenetic analysis of the MA-1 mtDNA genome (76.6X) places it within mtDNA haplogroup U without affiliation to any known subclades, implying a lineage that is rare or extinct in sampled modern populations (Supplementary Information, section 7 and Supplementary Fig. 4a). Present-day distribution of haplogroup U encompasses a large area including North Africa, the Middle East, south and central Asia, western Siberia and Europe (Supplementary Fig. 4b), although it is rare or absent east of the Altai Mountains; that is, in populations living in the region surrounding Mal’ta. Haplogroup U has also been found at high frequency (>80%) in ancient hunter-gatherers from Upper Palaeolithic and Mesolithic Europe10–12. Our result therefore suggests a connection between pre-agricultural Europe and Upper Palaeolithic Siberia. The Y chromosome of MA-1 was sequenced to an average depth of 1.5X, with coverage across 5.8 million bases. Acknowledging the low depth of coverage, we determined the most likely phylogenetic affiliation of the MA-1 Y chromosome to a basal lineage of haplogroup R (Supplementary Information, section 8 and Supplementary Fig. 5a). The extant sub-lineages of haplogroup R show regional spread patterns within western Eurasia, south Asia and also extend to the Altai region in southern Siberia (Supplementary Fig. 5b). The sister lineage to these extant sub-lineages of haplogroup R, haplogroup Q, is the most common haplogroup in Native Americans5 and it was recently shown that, in Eurasia, haplogroup Q lineages closest to Native Americans are found in southern Altai7.

We reconstructed admixture graphs using TreeMix21 to relate the population history of MA-1 to 11 modern genomes from worldwide populations22, 4 new genomes from Eurasia (Mari, Avar, Indian and Tajik ancestry) and the Denisova genome22 (Supplementary Information, section 11). The maximum-likelihood population tree inferred without admixture events places MA-1 on a branch that is basal to western Eurasians (Supplementary Fig. 12). However, a significant residual was observed between the empirical covariance for MA-1 and Karitiana, a Native American population, and the covariance predicted by the tree model (Supplementary Fig. 12). Consequently, gene flow between these lineages was inferred in all graphs incorporating two or more migration events (Fig. 2 and Supplementary Fig. 13). Bootstrap support for the migration edge from MA-1 to Karitiana, rather than from Karitiana to MA-1, was 99% in this analysis.
We investigated further the population history of MA-1 by conducting sequence read-based D-statistic tests23 on proposed tree-like histories comprising MA-1 and combinations of 11 modern genomes (Supplementary Information, section 13). In agreement with the TreeMix results, these tests reject the tree ((X, Han), MA-1) where X represents Avar, French, Indian, Mari, Sardinian and Tajik, consistent with the MA-1 lineage sharing more recent ancestry with the western Eurasian branch after the split of Europeans and east Asians (Supplementary Table 13). This result also holds true when the Han Chinese is replaced with Dai, another east Asian population (Supplementary Table 13). Notably, we can also reject the tree ((Han, Karitiana), MA-1) (Z 5 10.8), suggesting gene flow between MA-1 and ancestral Native Americans, in accordance with the admixture graphs (Supplementary Table 13). This result is consistent with allele frequency-based D-statistic tests20 on SNP arrays for 48 Native American populations of entirely First American ancestry19, indicating that all tested populations are equally related to MA-1 and that the admixture event occurred before the population diversification of the First American gene pool (Fig. 3a, Supplementary Information, section 14.4 and Supplementary Fig. 24).

The genetic affinity between Native Americans and MA-1 could be explained by gene flow after the split between east Asians and Native Americans, either from the MA-1 lineage into Native American ancestors or from Native American ancestors to the ancestors of MA-1. However, MA-1, at approximately 24,000 cal. bp, pre-dates time estimates of the Native American–east Asian population divergence event24,25. This presents little time for the formation of a diverged Native American gene pool that could have contributed ancestry to MA-1, suggesting gene flow from the MA-1 lineage into Native American ancestors. Such gene flow should also be detectable using modern-day western Eurasian populations in place of MA-1. Consistent with this, D-statistic tests estimated from outgroup-ascertained SNP data20 reveal significant evidence (Z == 3) for Middle Eastern, European, central Asian and south Asian populations being closer to Karitiana than to Han Chinese20 (Fig. 3b and Supplementary Information, section 14.5).
Similar signals were also observed when we replaced modern-day Han Chinese with data from chromosome 21 from a 40,000-yearold east Asian individual (Tianyuan Cave, China), which has been found to be ancestral to modern-day Asians and Native Americans26 (Supplementary Information, section 14.5). Thus, if the gene flow direction was from Native Americans into western Eurasians it would have had to spread subsequently to European, Middle Eastern, south Asian and central Asian populations, including MA-1 before 24,000 years ago. Moreover, as Native Americans are closer to Han Chinese than to Papuans (Fig. 3c), Native American-related gene flow into the ancestors of MA-1is expected to result in MA-1 also being closer to Han Chinese than to Papuans. However, our results suggest that this is not the case (D (Papuan, Han; Sardinian, MA-1) = 20.002 ± 0.005 (Z = 20.36)), which is compatible with all or almost all of the gene flow being into Native Americans (Supplementary Information, section 14.6). Similar results are obtained when MA-1 is replaced with most modern-day western Eurasian populations, except populations with recent admixture from east Asia (Russian, Adygei and Burusho) and Africa (Middle Eastern populations) (Fig. 3c). The most parsimonious explanation for these results is that Native Americans have mixed origins, resulting from admixture between peoples related to modern-day east Asians and western Eurasians. Admixture graphs fitted with MixMapper27 model Karitiana as having 14–38% western Eurasian ancestry and 62–86% east Asian ancestry, but we caution that these estimates assume unadmixed ancestral populations (Supplementary Information, section 12).
Importantly, in addition to the low contamination rates and rare or extinct uniparental lineages, we exclude modern DNA contamination as being the source of the observed population affinities of MA-1 for three reasons. First, we corrected the sequence read-based D-statistics tests for differing amounts of contamination, using a European individual as the contamination source (Supplementary Information, section 13.5). We find similar outcomes for corrected and uncorrected tests (Supplementary Fig. 20), even when contamination levels larger than that estimated for MA-1 are considered, confirming that our results are not affected by contamination from a European source. Second, restricting the PCA to sequences with evidence of post-mortem degradation gives results that are comparable with those using the complete data set (Supplementary Information, section 15). Finally, the genome sequence of the researcher (Indian ancestry) who carried out DNA extraction and library preparation of MA-1 enables us to exclude the researcher as a source of contamination (Supplementary Information, sections 11 and 13). In addition, we exclude post-Columbian European admixture (after 1492 ad) as an explanation for the genetic affinity between MA-1 and Native Americans for three reasons. First, for SNP array-based analyses, we take recent European admixture into account by using a data set masked for inferred admixed genomic regions19. Second, allele frequency-based D-statistic tests20 show that all 48 tested modern-day populations with First American ancestry19 are equally related to MA-1 within the resolution of our data (Supplementary Information, section 14.4), which would not be expected if the signal was driven by recent European admixture. Third, MA-1 is closer to Native Americans than any of the 15 tested European populations (Supplementary Information, section 14.8).
Human dispersals in northeast Asia immediately before and after the LGM are most likely to have led to the settlement of Beringia, and ultimately the Americas28. As MA-1 pre-dates the LGM, we investigated whether the genetic composition of southern Siberia changed during the LGM by generating a low-coverage data set (~0.1X) of a post-LGM individual from Afontova Gora-2 (AG-2) (ref. 14), located on the western bank of the Enisei River in south-central Siberia (Fig. 1a). We obtained a direct AMS 14C date of 13,810 ± 35 14C years before present or 17,075–16,750 cal. bp for AG-2 (Supplementary Information, section 2). Despite substantial present-day DNA contamination in this sample (Supplementary Information, section 5), we find that AG-2 shows close similarity to the genetic profile of MA-1 on a PCA (Supplementary Information, section 15 and Supplementary Fig. 29) and is significantly closer to Karitiana than to Han (D (Yoruba, AG-2; Han, Karitiana) = 0.078 ± 0.004, Z = 19.9) (Supplementary Information, section 15). We observe consistent results when restricting analyses to sequences with evidence of post-mortem degradation (Supplementary Information, section 15 and Supplementary Fig. 29), implying that southern Siberia may have experienced genetic continuity through the environmentally harsh LGM.

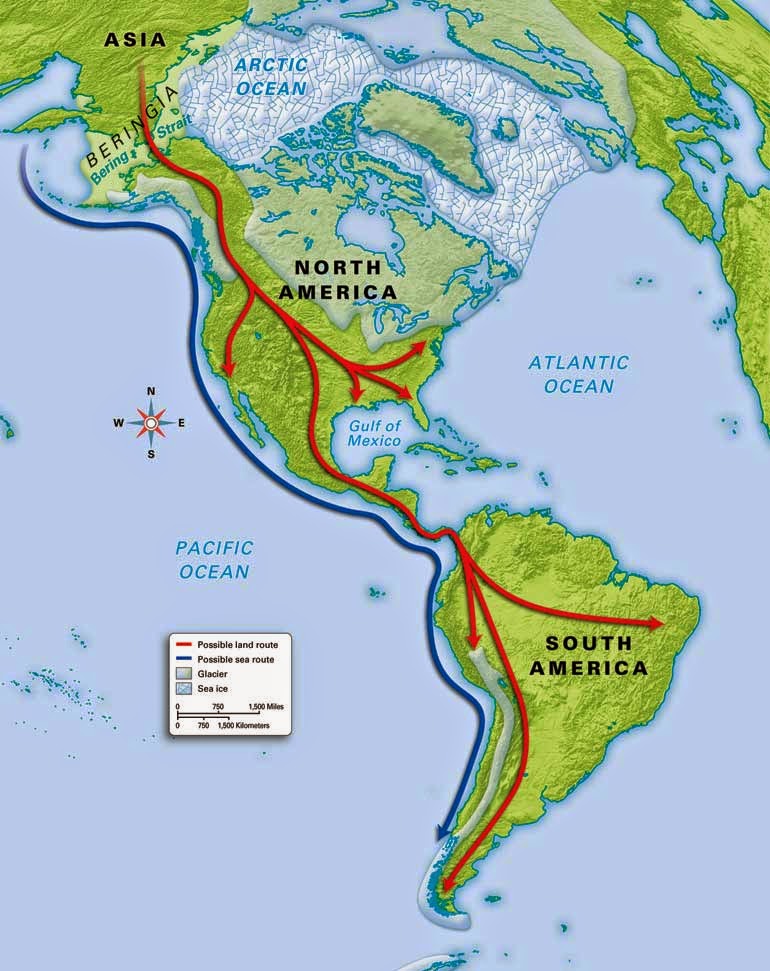
Our study has four important implications. First, we find evidence that contemporary Native Americans and western Eurasians share ancestry through gene flow from a Siberian Upper Palaeolithic population into First Americans. Second, our findings may provide an explanation for the presence of mtDNA haplogroup X in Native Americans, which is related to western Eurasians but not found in east Asian populations29. Third, such an easterly presence in Asia of a population related to contemporary western Eurasians provides a possibility that non-east Asian cranial characteristics of the First Americans13 derived from the Old World via migration through Beringia, rather than by a trans-Atlantic voyage from Iberia as proposed by the Solutrean hypothesis30. Fourth, the presence of an ancient western Eurasian genomic signature in the Baikal area before and after the LGM suggests that parts of south-central Siberia were occupied by humans throughout the coldest stages of the last ice age.
Nature. 2014 Jan 2; 505(7481): 87–91.

