

Post by Admin on Feb 8, 2020 21:44:00 GMT
The settlement of the Americas occurred at least 15,000 years ago through Beringia, a land bridge between Asia and America that existed during the ice ages1,2,3,4,5. Most analyses of Native American genetic diversity have examined single loci, particularly mitochondrial DNA or the Y chromosome, and some interpretations of these data model the settlement of America as a single migratory wave from Asia6,7,8. We assembled native population samples from Canada to the southern tip of South America, genotyped them on single nucleotide polymorphism (SNP) microarrays, and merged our data with six other data sets. The combined data set consists of 364,470 SNPs genotyped in 52 Native American populations (493 samples; Fig. 1a and Supplementary Table 1), 17 Siberian populations (245 samples; Supplementary Fig. 1 and Supplementary Table 2) and 57 other populations (1,613 samples) (Supplementary Notes).
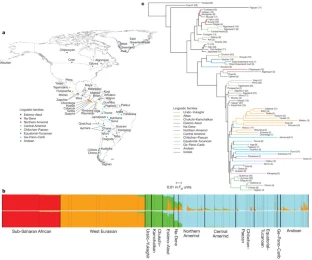
Figure 1: Geographic, linguistic and genetic overview of 52 Native American populations.
A complication in studying Native American genetic history is admixture with European and African immigrants since 1492. Cluster analysis16 shows that many of the samples we examined have some non-native admixture (an average of 8.5%; Fig. 1b and Supplementary Tables 1 and 3). This admixture is a challenge for learning about the historical relationships among the populations, and to address this complication we used three independent approaches. First, we restricted analyses to 163 Native Americans from 34 populations without evidence of admixture (Supplementary Notes). Second, we subtracted the expected contribution of European and African ancestry to the statistics we used to learn about population relationships (Supplementary Notes). Third, we inferred the probability of non-native ancestry at each genomic segment and ‘masked’ segments with more than a negligible probability of this ancestry (Fig. 1b, Supplementary Notes and Supplementary Fig. 2). Our inferences from these three approaches are concordant (Supplementary Figs 3 and 4).
We built a tree (Fig. 1c) using Fst distances between pairs of populations, which broadly agrees with geography and linguistic categories17 (trees based on masked and unmasked data were similar; Supplementary Fig. 3). An early split separates Asians from Native Americans and extreme northeastern Siberians (Chukchi, Naukan, Koryak), which is consistent with studies that have identified pan-American variants shared with some northeastern Siberians6,7,10,18. Eskimo–Aleut speakers and far-northeastern Siberians form a cluster that is separated from other Native American populations by a long internal branch. Within America the tree shows a series of splits in an approximate north–south sequence beginning with the Arctic, followed by northern North America, northern/central and southern Mexico and lower Central America/Colombia, and ending in three South American clusters (the Andes, the Chaco region and eastern South America). This pattern of splits is consistent with a north–south population expansion, an inference that is also supported by the negative correlation between heterozygosity and distance from the Bering Strait (r = −0.48, P = 0.007). This correlation increases if we use ‘least cost distances’ that consider the coasts as facilitators of migration19,20,21, and persists if we exclude four Native North American populations with ancestry from later streams of Asian gene flow (Supplementary Notes and Supplementary Fig. 5).
Trees provide a simplified model of history that does not accommodate the possibility of gene flow after population separation. Circumstantial evidence that some Native American populations may not fit a simple tree comes from cluster analysis, which infers Siberian-related ancestry in some northern North Americans (Fig. 1b), and from single-locus studies that have identified genetic variants shared between Eurasia and North America that are absent from South America11,22,23. The advent of genome-wide data sets has allowed the development of a formal four-population test for whether sets of four populations are consistent with a tree. This test is robust to the ascertainment bias affecting SNP arrays24. For each of the 52 Native American populations in turn, we tested the hypothesis that they conform to the tree: ((test population, southern Native American), (outgroup1, outgroup2)) for 45 pairs of ten Asian outgroups. We used a Hotelling T-test to evaluate whether all four-population test f4 statistics of this form are consistent with the expectation of zero (Supplementary Notes). The test is not significant for 47 populations, which is consistent with their stemming from the same, presumably first, wave of American settlement; we call this ancestry ‘First American’ (Table 1). In contrast, four populations from northern North America show highly significant evidence of ancestry from additional streams of gene flow from Asia, subsequent to the initial peopling of America, which we confirm through the Hotelling T-test and a complementary test (Supplementary Notes): East Greenland Inuit (P
Examination of the values of the f4 statistics allows us to infer the minimum number of gene flow events from Asia into America consistent with the data. Each stream of gene flow is expected to produce a distinct vector of f4 statistics, constituting a ‘signature’ of how the ancestral migrating population relates to present-day Asian populations. By finding the minimum number of vectors whose linear combinations are necessary to produce the vector observed in each population, we infer that a minimum of three gene flow events from Asia are necessary to explain the data from all Native American populations jointly, including the Saqqaq Palaeo-Eskimo (Supplementary Notes). These three episodes correspond to First American ancestry (distributed throughout the Americas) and to two additional streams of gene flow detected in a subset of northern North Americans (East Greenland Inuit, West Greenland Inuit, Aleutian Islanders, Chipewyan and Saqqaq). Table 1 shows that f4 statistics in the Inuit and Aleutian islanders are consistent with deriving the non-First-American portions of their ancestry from the same later stream of Asian gene flow, providing support for deep shared ancestry between these linguistically linked groups12,26. The Na-Dene-speaking Chipewyan have a different pattern of f4 statistics from Eskimo–Aleut speakers, implying that they descend at least in part from a separate stream of Asian gene flow (P
To develop an explicit model for the settlement of the Americas, we used the admixture graph (AG) framework24. AGs are generalizations of trees that accommodate the possibility of a limited number of unidirectional gene flow events. They are powerful tools for learning about history because they make predictions about the values of f-statistics (such as f4) that can be used to test the fit of a proposed model24 (Supplementary Notes). Figure 2 presents an AG relating selected Native American and Old World populations that is a good fit to the data in the sense that none of the f-statistics predicted by the model are more than three standard errors from what is observed. This supports the hypothesis of three deep lineages in Native Americans: the Asian lineage leading to First Americans is the most deeply diverged, whereas the Asian lineages leading to Eskimo–Aleut speakers and the Na-Dene-speaking Chipewyan are more closely related and descend from a putative Siberian ancestral population more closely related to Han (Fig. 2). We also arrive at the finding that Eskimo–Aleut populations and the Chipewyan derive large proportions of their genomes from First American ancestors: an estimated 57% for Eskimo–Aleut speakers, and 90% in the Chipewyan, probably reflecting major admixture events of the two later streams of Asian migration with the First Americans that they encountered after they arrived (Supplementary Notes). The high proportion of First American ancestry explains why Eskimo–Aleut and Chipewyan populations cluster with First Americans in trees like that in Fig. 1c despite having some of their ancestry from later streams of Asian migration, and explains the observation of some genetic variants that are shared by all Native Americans but are absent elsewhere6,7,10,18. We also infer back-migration of populations related to the Eskimo–Aleut from America into far-northeastern Siberia (we obtain an excellent fit to the data when we model the Naukan and coastal Chukchi as mixtures of groups related to the Greenland Inuit and Asians (Fig. 2 and Supplementary Notes)). This explains previous findings of pan-American alleles also in far-northeastern Siberia6,7,10,18.
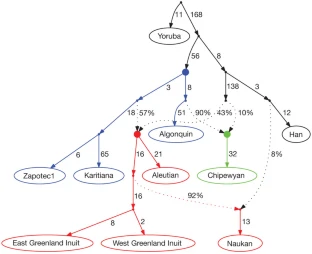
Figure 2: Distinct streams of gene flow from Asia into America.
We next used AGs to develop a model for the history of populations who derive all their ancestry from the First American migration, with no ancestry from subsequent streams of Asian gene flow. Figure 3 presents an AG we built for 16 selected Native American populations and two outgroups, which is a good fit to the data in that the largest |Z|-score for a difference between the observed and predicted f-statistics is 3.2 from among the 11,781 statistics we tested (Supplementary Notes) (The AG of Fig. 3 used masked data; however, a consistent set of relationships is inferred for unadmixed samples (Supplementary Fig. 4).) This model provides a greatly improved statistical fit to the data compared with the tree of Fig. 1c and leads to several novel inferences. First, a relatively large fraction of South American populations fit the AG without a need for admixture events, which we speculate reflects a history of limited gene flow among these populations since their initial divergence. In contrast, only a small fraction of Meso-American populations fit into the AG, which could reflect either a higher rate of migration among neighbouring groups or our denser sampling in Meso-America allowing us to detect more subtle gene flow events. Second, some Meso-American populations have experienced very little genetic drift since divergence from the common ancestral population with South Americans (adding up the genetic drifts along the relevant edges of Fig. 3, we infer Fst = 0.014 between the Zapotec and a hypothetical population ancestral to all of Central and South America), suggesting that effective population sizes in Meso-America have been relatively large since settlement of the region. Third, the model infers three admixture events consistent with geographic locations and linguistic affiliations (Supplementary Notes). The Inga have both Amazonian and Andean ancestry, which is consistent with their speaking a Quechuan language but living in the eastern Andean slopes of Colombia and thus interacting with groups in the neighbouring Amazonian lowlands. The Guarani stem from two distinct strands of ancestry within eastern South America. The most striking admixture event is in the Costa Rican Cabecar (Fig. 3) and other Chibchan-speaking populations (Supplementary Notes) from the Isthmo-Colombian area. One of the lineages that we detect in these populations occurs definitively within the radiation of South American populations, and so the presence of these populations in lower Central America suggests that there was reverse gene flow across the Panama isthmus after the initial settlement of South America. There has been controversy about whether Chibchan speakers of lower Central America represent direct descendants of the first settlers in the region or more recent migration across the isthmus, and our results support the view that more recent migration has contributed most of these populations’ ancestry27.
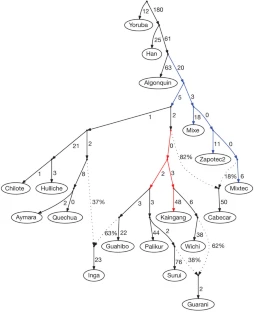
Figure 3: A model fitting populations of entirely First American ancestry.
This is the most comprehensive survey of genetic diversity in Native Americans so far. Our analyses show that the great majority of Native American populations—from Canada to the southern tip of Chile—derive their ancestry from a homogeneous ‘First American’ ancestral population, presumably the one that crossed the Bering Strait more than 15,000 years ago6,7,8. We also document at least two additional streams of Asian gene flow into America, allowing us to reject the view that all present-day Native Americans stem from a single migration wave6,7,8, and supporting the more complex scenarios proposed by some other studies9,10,11,12,13,14,15. In particular, the three distinct Asian lineages we detect—‘First American’, ‘Eskimo–Aleut’ and a separate one in the Na-Dene-speaking Chipewyan—are consistent with a three-wave model proposed9 mostly on the basis of dental morphology and a controversial interpretation of the linguistic data. However, our analyses also document extensive admixture between First Americans and the subsequent streams of Asian migrants, which was not predicted by that model, such that Eskimo–Aleut speakers and the Chipewyan derive more than half their ancestry from First Americans. Further insights into Native American history will benefit from the application of analyses similar to those performed here to whole-genome sequences and to data from the many admixed populations in the Americas that do not self-identify as native28,29,30.
Nature volume 488, pages 370–374 (16 August 2012)
Figure 1: Geographic, linguistic and genetic overview of 52 Native American populations.
A complication in studying Native American genetic history is admixture with European and African immigrants since 1492. Cluster analysis16 shows that many of the samples we examined have some non-native admixture (an average of 8.5%; Fig. 1b and Supplementary Tables 1 and 3). This admixture is a challenge for learning about the historical relationships among the populations, and to address this complication we used three independent approaches. First, we restricted analyses to 163 Native Americans from 34 populations without evidence of admixture (Supplementary Notes). Second, we subtracted the expected contribution of European and African ancestry to the statistics we used to learn about population relationships (Supplementary Notes). Third, we inferred the probability of non-native ancestry at each genomic segment and ‘masked’ segments with more than a negligible probability of this ancestry (Fig. 1b, Supplementary Notes and Supplementary Fig. 2). Our inferences from these three approaches are concordant (Supplementary Figs 3 and 4).
We built a tree (Fig. 1c) using Fst distances between pairs of populations, which broadly agrees with geography and linguistic categories17 (trees based on masked and unmasked data were similar; Supplementary Fig. 3). An early split separates Asians from Native Americans and extreme northeastern Siberians (Chukchi, Naukan, Koryak), which is consistent with studies that have identified pan-American variants shared with some northeastern Siberians6,7,10,18. Eskimo–Aleut speakers and far-northeastern Siberians form a cluster that is separated from other Native American populations by a long internal branch. Within America the tree shows a series of splits in an approximate north–south sequence beginning with the Arctic, followed by northern North America, northern/central and southern Mexico and lower Central America/Colombia, and ending in three South American clusters (the Andes, the Chaco region and eastern South America). This pattern of splits is consistent with a north–south population expansion, an inference that is also supported by the negative correlation between heterozygosity and distance from the Bering Strait (r = −0.48, P = 0.007). This correlation increases if we use ‘least cost distances’ that consider the coasts as facilitators of migration19,20,21, and persists if we exclude four Native North American populations with ancestry from later streams of Asian gene flow (Supplementary Notes and Supplementary Fig. 5).
Trees provide a simplified model of history that does not accommodate the possibility of gene flow after population separation. Circumstantial evidence that some Native American populations may not fit a simple tree comes from cluster analysis, which infers Siberian-related ancestry in some northern North Americans (Fig. 1b), and from single-locus studies that have identified genetic variants shared between Eurasia and North America that are absent from South America11,22,23. The advent of genome-wide data sets has allowed the development of a formal four-population test for whether sets of four populations are consistent with a tree. This test is robust to the ascertainment bias affecting SNP arrays24. For each of the 52 Native American populations in turn, we tested the hypothesis that they conform to the tree: ((test population, southern Native American), (outgroup1, outgroup2)) for 45 pairs of ten Asian outgroups. We used a Hotelling T-test to evaluate whether all four-population test f4 statistics of this form are consistent with the expectation of zero (Supplementary Notes). The test is not significant for 47 populations, which is consistent with their stemming from the same, presumably first, wave of American settlement; we call this ancestry ‘First American’ (Table 1). In contrast, four populations from northern North America show highly significant evidence of ancestry from additional streams of gene flow from Asia, subsequent to the initial peopling of America, which we confirm through the Hotelling T-test and a complementary test (Supplementary Notes): East Greenland Inuit (P
Examination of the values of the f4 statistics allows us to infer the minimum number of gene flow events from Asia into America consistent with the data. Each stream of gene flow is expected to produce a distinct vector of f4 statistics, constituting a ‘signature’ of how the ancestral migrating population relates to present-day Asian populations. By finding the minimum number of vectors whose linear combinations are necessary to produce the vector observed in each population, we infer that a minimum of three gene flow events from Asia are necessary to explain the data from all Native American populations jointly, including the Saqqaq Palaeo-Eskimo (Supplementary Notes). These three episodes correspond to First American ancestry (distributed throughout the Americas) and to two additional streams of gene flow detected in a subset of northern North Americans (East Greenland Inuit, West Greenland Inuit, Aleutian Islanders, Chipewyan and Saqqaq). Table 1 shows that f4 statistics in the Inuit and Aleutian islanders are consistent with deriving the non-First-American portions of their ancestry from the same later stream of Asian gene flow, providing support for deep shared ancestry between these linguistically linked groups12,26. The Na-Dene-speaking Chipewyan have a different pattern of f4 statistics from Eskimo–Aleut speakers, implying that they descend at least in part from a separate stream of Asian gene flow (P
To develop an explicit model for the settlement of the Americas, we used the admixture graph (AG) framework24. AGs are generalizations of trees that accommodate the possibility of a limited number of unidirectional gene flow events. They are powerful tools for learning about history because they make predictions about the values of f-statistics (such as f4) that can be used to test the fit of a proposed model24 (Supplementary Notes). Figure 2 presents an AG relating selected Native American and Old World populations that is a good fit to the data in the sense that none of the f-statistics predicted by the model are more than three standard errors from what is observed. This supports the hypothesis of three deep lineages in Native Americans: the Asian lineage leading to First Americans is the most deeply diverged, whereas the Asian lineages leading to Eskimo–Aleut speakers and the Na-Dene-speaking Chipewyan are more closely related and descend from a putative Siberian ancestral population more closely related to Han (Fig. 2). We also arrive at the finding that Eskimo–Aleut populations and the Chipewyan derive large proportions of their genomes from First American ancestors: an estimated 57% for Eskimo–Aleut speakers, and 90% in the Chipewyan, probably reflecting major admixture events of the two later streams of Asian migration with the First Americans that they encountered after they arrived (Supplementary Notes). The high proportion of First American ancestry explains why Eskimo–Aleut and Chipewyan populations cluster with First Americans in trees like that in Fig. 1c despite having some of their ancestry from later streams of Asian migration, and explains the observation of some genetic variants that are shared by all Native Americans but are absent elsewhere6,7,10,18. We also infer back-migration of populations related to the Eskimo–Aleut from America into far-northeastern Siberia (we obtain an excellent fit to the data when we model the Naukan and coastal Chukchi as mixtures of groups related to the Greenland Inuit and Asians (Fig. 2 and Supplementary Notes)). This explains previous findings of pan-American alleles also in far-northeastern Siberia6,7,10,18.
Figure 2: Distinct streams of gene flow from Asia into America.
We next used AGs to develop a model for the history of populations who derive all their ancestry from the First American migration, with no ancestry from subsequent streams of Asian gene flow. Figure 3 presents an AG we built for 16 selected Native American populations and two outgroups, which is a good fit to the data in that the largest |Z|-score for a difference between the observed and predicted f-statistics is 3.2 from among the 11,781 statistics we tested (Supplementary Notes) (The AG of Fig. 3 used masked data; however, a consistent set of relationships is inferred for unadmixed samples (Supplementary Fig. 4).) This model provides a greatly improved statistical fit to the data compared with the tree of Fig. 1c and leads to several novel inferences. First, a relatively large fraction of South American populations fit the AG without a need for admixture events, which we speculate reflects a history of limited gene flow among these populations since their initial divergence. In contrast, only a small fraction of Meso-American populations fit into the AG, which could reflect either a higher rate of migration among neighbouring groups or our denser sampling in Meso-America allowing us to detect more subtle gene flow events. Second, some Meso-American populations have experienced very little genetic drift since divergence from the common ancestral population with South Americans (adding up the genetic drifts along the relevant edges of Fig. 3, we infer Fst = 0.014 between the Zapotec and a hypothetical population ancestral to all of Central and South America), suggesting that effective population sizes in Meso-America have been relatively large since settlement of the region. Third, the model infers three admixture events consistent with geographic locations and linguistic affiliations (Supplementary Notes). The Inga have both Amazonian and Andean ancestry, which is consistent with their speaking a Quechuan language but living in the eastern Andean slopes of Colombia and thus interacting with groups in the neighbouring Amazonian lowlands. The Guarani stem from two distinct strands of ancestry within eastern South America. The most striking admixture event is in the Costa Rican Cabecar (Fig. 3) and other Chibchan-speaking populations (Supplementary Notes) from the Isthmo-Colombian area. One of the lineages that we detect in these populations occurs definitively within the radiation of South American populations, and so the presence of these populations in lower Central America suggests that there was reverse gene flow across the Panama isthmus after the initial settlement of South America. There has been controversy about whether Chibchan speakers of lower Central America represent direct descendants of the first settlers in the region or more recent migration across the isthmus, and our results support the view that more recent migration has contributed most of these populations’ ancestry27.
Figure 3: A model fitting populations of entirely First American ancestry.
This is the most comprehensive survey of genetic diversity in Native Americans so far. Our analyses show that the great majority of Native American populations—from Canada to the southern tip of Chile—derive their ancestry from a homogeneous ‘First American’ ancestral population, presumably the one that crossed the Bering Strait more than 15,000 years ago6,7,8. We also document at least two additional streams of Asian gene flow into America, allowing us to reject the view that all present-day Native Americans stem from a single migration wave6,7,8, and supporting the more complex scenarios proposed by some other studies9,10,11,12,13,14,15. In particular, the three distinct Asian lineages we detect—‘First American’, ‘Eskimo–Aleut’ and a separate one in the Na-Dene-speaking Chipewyan—are consistent with a three-wave model proposed9 mostly on the basis of dental morphology and a controversial interpretation of the linguistic data. However, our analyses also document extensive admixture between First Americans and the subsequent streams of Asian migrants, which was not predicted by that model, such that Eskimo–Aleut speakers and the Chipewyan derive more than half their ancestry from First Americans. Further insights into Native American history will benefit from the application of analyses similar to those performed here to whole-genome sequences and to data from the many admixed populations in the Americas that do not self-identify as native28,29,30.
Nature volume 488, pages 370–374 (16 August 2012)


