|
|
Post by Admin on Sept 12, 2019 18:35:06 GMT
The history and evolution of the genus Homo has been the subject of continuous debates1,2. Recent fossil discoveries3,4, new analytical techniques5,6 and major developments in ancient genomics7,8 have considerably enhanced our understanding of the evolution of our genus, modifying profoundly the palaeoanthropological theoretical framework. Therefore, models for the origin of our species, H. sapiens, have moved away from the confrontation of two extreme antagonistic points of view: (1) the Multiregional Model of modern human origins implying the gradual evolution of global archaic hominin populations towards a modern human morphology over the course of the last 2 million years;9,10 and (2) the hypothesis of a unique Out of Africa event1, also known as the Recent African Origin (RAO) model, implying a single African origin (200,000–100,000 years ago (ka)) of modern humans and subsequent replacement of all archaic populations. Subsequent models to address the complex evolutionary geography of late Quaternary hominins were proposed, including multiple dispersals out of Africa and the role of population structure in Africa in the processes of diversification11. Along with the understanding of the evolutionary mechanisms that gave rise to the Neandertals in Europe12, and a growing number of genetic studies13,14, those models paved the way for a shift of emphasis from replacement to the potentially varied demographic and genetic outcomes of recent hominin interactions7,9,15,16,17. 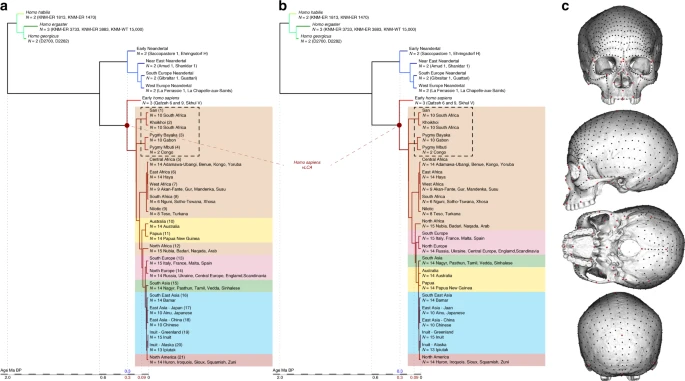 Fig. 1 Phylogenetic hypotheses and landmarks distribution on the cranium. a and b Fully resolved phylogeny of the genus Homo according to hypotheses 1 (a) and 2 (b). c Position of the 780 landmarks and semilandmarks used in the study to describe the crania of the phylogeny sample Nevertheless, many unanswered questions remain, partly because of the scarcity of Late Middle Pleistocene (LMP, from 350 to 130 ka) African fossils which is a major constraint to any study of the African LMP fossil record. In Northern Africa, the site of Jebel Irhoud has yielded multiple fossils since the 1960s18, including a complete skull (Irhoud 1), originally dated to 130–190 ka19. Recent excavations at the site have yielded additional fossils (in particular a partial upper face, Irhoud 10, and a mandible, Irhoud 11), and a new date estimate of 315 ka20. Well-preserved LMP hominins are more numerous in Eastern Africa. The Singa calvarium from Sudan is dated to 133 ka21. In Ethiopia, the Omo Kibish specimens, Omo I and Omo II22, are dated to 200 ka23, and the three specimens from Herto, which include a complete adult cranium (BOU-VP16/1) and a juvenile calvarium (BOU-VP16/5), with an estimated date of 160 ka24. In Kenya, the Guomde calvarium (KNM-ER 3884), which lacks most of the facial and frontal bones25, has been dated to 270–300 ka with ɤ-ray spectrometry26, while an age of 200–300 ka has been suggested for the nearly complete Eliye Springs skull (KNM-ES 1169327) on the basis of its morphology28. Further South, a 200–300 ka cranium (LH1829,30) was discovered in the Ngaloba Beds at Laetoli (Tanzania), and in South Africa, the site of Florisbad yielded a partially preserved cranium dated to 259 ka31. Lastly, the recently discovered remains of H. naledi, dated to 236–335 ka32, add major complexity to the LMP hominin record of southern Africa.
Table 1 Specimens included in the study

From: Deciphering African late middle Pleistocene hominin diversity and the origin of our species

Specimens	Chronologya	Site	3Db	Instc
 	 	Phylogeny sample
 	 	H. habilis sensu lato
KNM-ER 1813	~1.8 Ma	Koobi Fora, Kenya	PH	NMK
KNM-ER 1470	~1.8 Ma	Koobi Fora, Kenya	PH	NMK
 	 	H. ergaster
KNM-ER 3733	~1.6 Ma	Koobi Fora, Kenya	PH	NMK
KNM-ER 3883	~1.6 Ma	Koobi Fora, Kenya	PH	NMK
KNM-WT 15000	1.6–1.4 Ma	Nariokotome, Kenya	PH	NMK
 	 	H. georgicus
D2282	~1.77 Ma	Dmanisi, Georgia	PH	IPH
D2700	~1.77 Ma	Dmanisi, Georgia	PH	IPH
 	 	Early Neandertal
Saccopastore 1	130–250 ka	Saccopastore, Italy	PH	US
Ehringsdorf H	~200 ka	Ehringsdorf, Germany	PH	IPH
 	 	Near East Neandertal
Amud 1	50–60 ka	Amud, Israel	OP	DC
Shanidar 1	~45 ka	Shanidar, Irak	PH	MH
 	 	South Europe Neandertal
Guattari	52 ± 12 ka	Monte Circeo, Italy	CT	MP
Gibraltar 1	50–60 ka	Forbes’ Quarry, Gibraltar	CT	NHM
 	 	West Europe Neandertal
La Ferrassie1	53–66 ka	La Ferrassie, France	CT	MH
La Chapelle-aux-Saints	~50 ka	La Chapelle-aux-Saints, France	CT	MH
 	 	Early Homo sapiens
Qafzeh 6	100–130 ka	Qafzeh, Israel	PH	IPH
Qafzeh 9	100–130 ka	Qafzeh, Israel	OP	DC
Skhūl V	88–117 ka	Skhūl, Israel	CT	PM
Holocene	 	Homo sapiens
San (n = 10)	19–20th century	Republic of South Africa	CT/PH	DC/MH
Khoikhoi (n = 10)	19–20th century	Republic of South Africa	CT/PH	DC/MH
Bayaka (n = 10)	19–20th century	Central African Republic	PH	MH
Mbuti (n = 2)	19–20th century	Congo	CT/PH	DC
Central Africa (n = 14)	19–20th century	Congo–Central Africa–Nigeria	CT	DC
East Africa (n = 14)	19–20th century	Tanzania	CT	DC
West Africa (n = 9)	19–20th century	Mali-Ghana-Guinea	CT	DC
South Africa (n = 6)	19–20th century	Republic of South Africa	CT	DC
Nilotic (n = 8)	19–20th century	Kenya-Uganda	PH/CT	DC
Papua (n = 14)	19-20th century	Papua New-Guinea	CT/PH	DC
Australia (n = 14)	19–20th century	Australia	CT	DC
North Africa (n = 15)	~5 ka, 19–20th century	Egypt-Sudan	OP/CT	DC
South Europe (n = 15)	19–20th century	France-Italy-Spain-Malta	CT	DC
North Europe (n = 14)	19–20th century	Germany-Austria-Russia-Czech Republic-Hungary-Ukraine-Denmark-Sweden-England	CT	DC
South Asia (n = 14)	19–20th century	India-Pakistan	CT	DC
South East Asia (n = 14)	19–20th century	Myanmar	CT	DC
East Asia Japan (n = 10)	19–20th century	Japan	CT/PH	DC/MH/OR
East Asia China (n = 10)	19–20th century	China	CT	OR/DC
Inuit Greenland (n = 15)	19–20th century	Denmark	CT	DC
Inuit Alaska (n = 13)	19–20th century	US-AK	CT	AM
North America (n = 14)	19–20th century	US-Canada	CT	DC
 	 	LMP sample
Irhoud 1	~315 ± 34 ka	Jebel Irhoud, Morocco	OP	DC
Omo II	195 ± 95 ka	Omo Kibish, Ethiopia	PH	NMK
LH18	200–300 ka	Laetoli, Tanzania	CT	TAZ
Florisbad	259 ± 35 ka	Bloemfontein, South Africa	PH	NM
KNM-ES 11693	270–300 ka	Eliye Springs, Kenya	PH	NMK
Even when excluding the H. naledi material, African LMP fossils exhibit extremely variable morphologies. The Omo I22 and Herto specimens24 have a modern-like anatomy that includes the presence of the two cranio-mandibular apomorphies of the species—cranial proportions that result in a tall vault (basi-bregmatic height) and a chin, and are generally considered the earliest undisputed remains of H. sapiens16,17. All other LMP African fossils show a mosaic of derived and archaic characters. For instance, the Jebel Irhoud remains were originally described as showing strong similarities with Neandertals33, while the study of the new Irhoud remains emphasises their affinities with H. sapiens, despite the absence of key modern humans apomorphies (i.e., tall and globular vault, and inverted T chin)18. The Guomde25, Ngaloba30, Eliye Springs27 and Florisbad34 specimens along with Omo II22 and possibly the pathological Singa calvarium35, have been mostly referred to as ‘archaic H. sapiens’, a category grouping isolated fossils with disparate morphologies. This situation challenges any attempt at identifying the evolutionary mechanisms that may explain the morphological pattern in the African LMP fossil record, as well as identifying the ancestral population, or populations, of modern humans. Our main results indicate a complex process for the evolution of H. sapiens. While Florisbad shares the most phenotypic affinities with the computed vLCAs, some of the LMP fossils present a different phenotypic profile which supports the recognition of several African hominin populations and lineages. Not all those lineages contributed equally to the origin of H. sapiens and our results tend to support the view that H. sapiens’ origin may be the result from the coalescence of South and, possibly, East-African source populations. In this scenario, the North-African hominins may represent a population which introgressed into Neandertals during the LMP. |
|
|
|
Post by Admin on Sept 13, 2019 17:46:20 GMT
Results Phylogenetic modelling Figure 2 presents the phylo-morphospace and the computed position of the ancestral nodes of hypothesis 1 (black tree) and hypothesis 2 (grey tree) of the Homo phylogeny based on 84.6% of the total variation in the data (PC1 to PC3, Supplementary Table 3). Overall, the PCs discriminate accurately the different clades of the phylogenies used. The early Homo species (H. georgicus, H. ergaster, and H. habilis s.l.) and the Neandertals have negative values along PC1 (65.6%), contrasting with H. sapiens specimens. The associated shape deformation shows a low, elongated calvarium with a strongly projecting face for negative PC1 values, while the positive values are associated with a gracile morphology showing a high, rounded calvarium and an orthognathic face compatible with the San and Khoikhoi populations (#1 and 2). PC2 (13.2%) discriminates mainly the early Homo species, which occupy the upper left part of the chart, from modern humans and Neandertals in the lower part of the morphospace. Accordingly, PC2 negative values show a typical Neandertal shape (occipital bun, mid-facial prognathism), whereas PC2 positive values correlate with a small rounded calvarium, and a strongly-projecting face. The phenotypical variation within the modern human cluster is mostly explained by PC3 (5.8%) and follows closely the topology of hypothesis 1. The early H. sapiens group is morphologically close to the H. sapiens vLCAs and fits within the 95% confidence envelope computed around them. All sub-Saharan populations present positive values (#1 to 9), as well as the Oceanians (#10 and 11) and the North Africans (#12). The Khoisans (#1 and 2) are slightly isolated on PC1, showing the most gracile morphology, while the Pygmies (#3 and 4) have the most positive values on PC3. In the negative values of PC3, South Asians (#15) stand as intermediate between Africans-Oceanians and Eurasians, Europeans (#13 and 14) cluster with South-East Asians (#16) and East-Asians (#17 and 18), and Inuits (#19 and 20) are relatively close to North Americans (#21). The computed H. sapiens vLCAs are almost identical for both hypotheses and are more distant from the ancestral node hypothesising the common ancestry between modern humans and Neandertals than the Neandertal ancestor (Fig. 2). 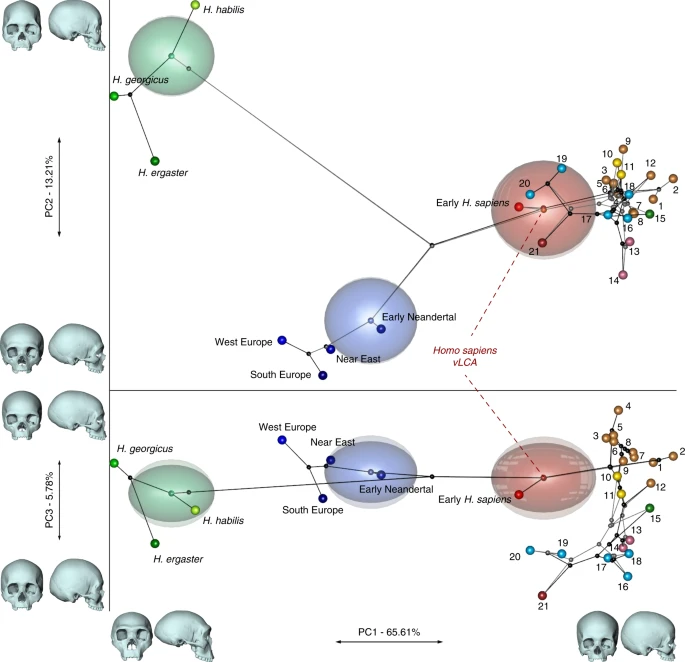 Fig. 2 The differences between hypotheses 1 and 2 are subtle. However, the phylogenetic signals37,38 computed for hypothesis 1 appear stronger than the ones computed for hypothesis 2 (Supplementary Table 4). This may indicate a better fit of the phenotypic data to phylogenetic hypothesis 1, which includes an earlier wave of dispersal from Africa to Eurasia that preserves a phenotypic signal in Oceania39, supported by the similarity of Australians and Papuans with sub-Saharan Africans. The Khoisans and Pygmies branch from the main modern human populations close to the H. sapiens LCA13,40, but are anatomically derived and gracile41. Removing these two groups from the modelling (hypotheses 1b and 2b, Fig. 1) does not alter the coherence of the distribution of the main clades (early Homo, Neandertals and H. sapiens) or the topologies of both hypotheses in the phylo-morphospace (PC1 to PC3, 85.9%, Supplementary Table 5, Supplementary Fig. 2). However, hypothesis 2b (grey) generates differences impacting on most of the nodes of the tree, resulting in vLCA2b being closer to current modern humans than vLCA1b, and the Australian/Papuan phenotype requiring longer branches between ancestral nodes and terminal taxa to be fitted to the hypothesised topology. This is demonstrated by the computed phylogenetic signals for both hypotheses (Supplementary Table 4). Morphologies of the vLCAs The morphologies of vLCA1 and 2 are virtually the same (Fig. 3a, surface deviation <0.16 mm, Supplementary Table 6). Both are relatively gracile in comparison to LMP African fossils; vLCA1 is slightly more robust, with a more receding frontal and a more protruding occipital (Fig. 3b). As expected, the vLCAs present most of the morphological features that would be considered as specific of H. sapiens. On the calvarium, the neurocranium is rounded and globular; the frontal bone exhibits a well-developed frontal tuber42 and discontinuous supercilliary arches; the parietals show distinct parietal eminences; and the basicranium is markedly flexed. The face is retracted, showing an angulated and forward facing zygomatic43, along with a developed maxillary canine fossa with two strongly marked curves (incurvatio horizontalis and sagitallis44). Nevertheless, they also share features with more archaic phenotypes: in norma lateralis, the frontal is slightly receding, the brow-ridges are projecting frontward, and separated from the frontal squama by a slight sulcus, the face shows alveolar prognathism, the zygomatic process is aligned with the crista supramastoidea42, the mastoid processes are weakly developed, and the elongated occipital shows a degree of lambdoid protrusion, which together with a slight depression at obelion, appears like an incipient occipital bun. The last two features could recall the Neandertal morphology12. In norma frontalis, the antero-posterior border of the maxilla (incurvatio inframalaris frontalis) is weakly marked, as observed in H. heidelbergensis s.l.44, and the interorbital distance is particularly wide45. Thus, the vLCAs capture both the uniquely derived aspects of a modern human morphology, and the currently geographically dispersed retention of plesiomorphic characters among different human populations. Hypotheses 1b and 2b, computed in the absence of the Khoisans and Pygmies, generate ancestral shapes which differ only slightly from those based on the original hypotheses (Supplementary Fig. 3a and b). The maximum surface deviation between vLCA1 and 1b and vLCA2 and 2b is nevertheless larger (respectively, <1.00 mm and <2.96 mm, Supplementary Table 6). vLCA1b shows slightly more projecting brow-ridges, but a less prognathic face, while 2b is clearly less robust than vLCA2. When compared to each other the difference is larger (<3.13 mm, Supplementary Table 6) and vLCA2b presents a more gracile morphology (Supplementary Fig. 3c). 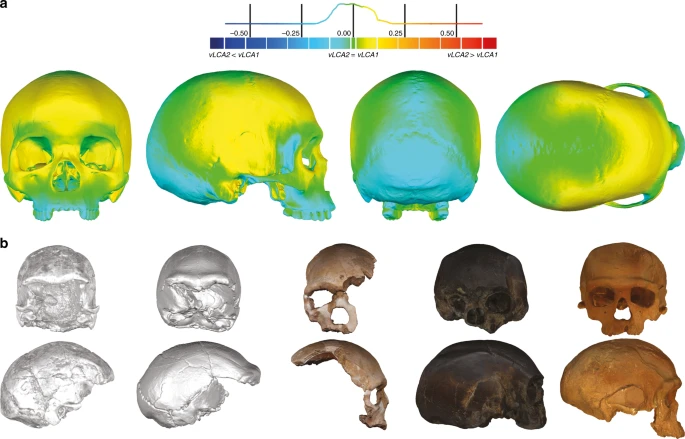 Fig. 3 Morphology of the vLCAs and of the LMP fossils. a Norma frontalis, lateralis, verticalis, occipitalis of vLCA1 when compared to vLCA2 through a surface deviation analysis. The histogram indicates the distribution of the deviation in mm between each vertex of the 3d models. b From left to right, norma frontalis and lateralis of Omo II, LH18, Florisbad, KNM-ES 11693 (the norma lateralis view is mirrored), and Irhoud 1. Source data are provided as a Source Data file |
|
|
|
Post by Admin on Sept 14, 2019 17:26:22 GMT
LMP African hominin diversity Figures 4 and 5 show the first two bgPCs of four bgPCAs based on the Procrustes residuals of the individual specimens (to the exclusion of early Homo) grouped according to the terminal taxa of the phylogenetic hypotheses, along with the four computed vLCAs and the five LMP fossils. The four bgPCAs were run on different landmark configurations composed of type I homologous landmarks5 linked by curves of semilandmarks. The four landmark configurations reflect the preserved data of the LMP fossils (see Methods, Supplementary Table 7 and Supplementary Fig. 6). Figure 4a shows the first two bgPCs (52.9% of variance, Supplementary Table 8) of the bgPCA run on the full skull (Analysis A). BgPC1 discriminates the Neandertals (negative values) from modern humans (positive values), while bgPC2 explains the morphological variation within the modern human sample. The position of the modern human groups reflects their evolutionary history: sub-Saharan Africans (#1 to 9) present negative values, as do the early H. sapiens from Qafzeh and Skhūl; Oceanians (#10 and 11), North Africans (#12) and South Asians (#15) cluster around the centre of bgPC2, while all other Eurasians have positive values. The vLCAs cluster around the early H. sapiens, but vLCA2b is closer to Oceanians (#10 and 11). The LMP fossils, Florisbad, KNM-ES 11693 and to a lesser extent Omo II are similar to both early H. sapiens and the vLCAs, while Irhoud 1 shares more similarities with Neandertals. LH18 presents extreme negative values on bgPC2 due to a receding frontal profile and a short medio-lateral length. The Euclidean distances between group means (Supplementary Data 1) confirm these patterns: vLCAs 1, 2 and 1b are closer to early H. sapiens (respectively, 0.0254, 0.0255 and 0.0230), while vLCA2b is closer to Australians (0.0240). Florisbad is the African LMP specimen which resembles the vLCAs the most, particularly vLCA1 and 2 (0.0419), while Irhoud 1 is the only LMP specimen sharing the most similarities with Neandertals (South Europe Neandertals: 0.0617). Figure 4b shows the two first bgPCs (60.7%, Supplementary Table 9) of the bgPCA run only on the calvarium and excluding Florisbad (Analysis B, Supplementary Table 7 and Supplementary Fig. 6). The morphospace is similar to analysis A. VLCAs 1, 2 and 1b are similar to early H. sapiens, while vLCA2b is closer to current populations. Omo II and KNM-ES 11693 show phenotypic affinities with early H. sapiens and early Neandertals, while Irhoud 1’s morphology shares similarities with Neandertals. VLCAs 1, 2 and 1b present the lowest Euclidean distance (Supplementary Data 2) to early H. sapiens (respectively, 0.0233, 0.0235 and 0.0214), while vLCA2b is closer to East Africans (0.0202). Within the LMP fossils, Omo II shares the most similarities with the vLCAs (0.0672 with vLCA1b) but is closer to early H. sapiens (0.0665). Irhoud 1 shortest Euclidean distance is to South Europe Neandertals (0.0395). 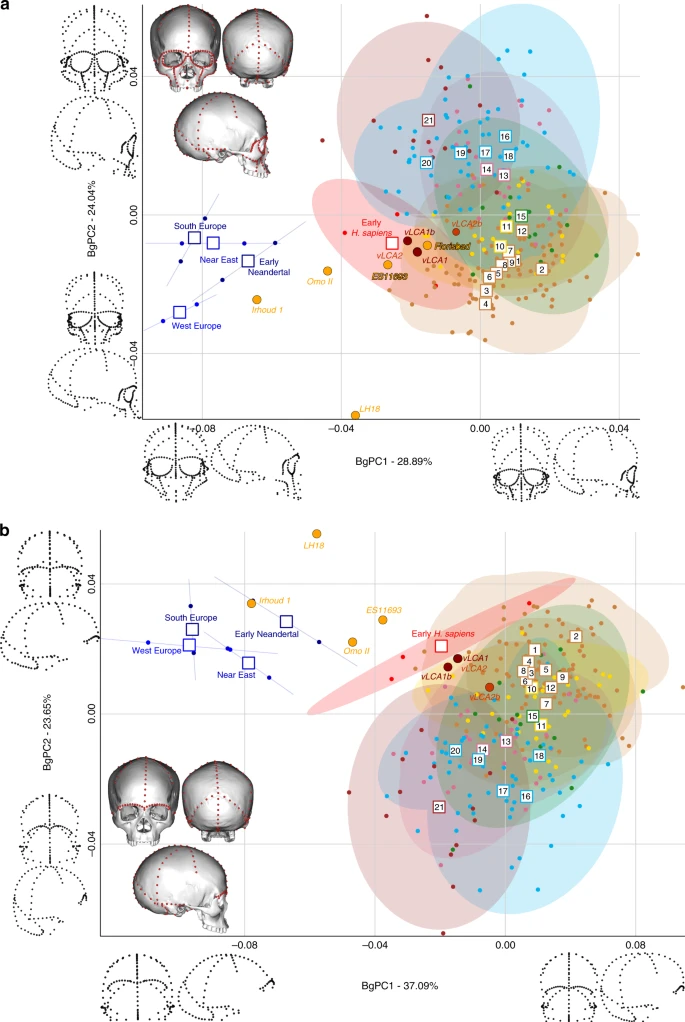 Fig. 4 Figure 5 displays the last two bgPCAs run on the preserved landmark configuration of Florisbad (Analysis C, Fig. 5a) and KNM-ES 11693 (Analysis D, Fig. 5b). Omo II and LH18 are not included in analysis C. Both morphospaces preserve the same overall distribution of points. However, in analysis C’s morphospace (61.3%, Supplementary Table 10), early H. sapiens are positioned between modern humans and the Neandertals. VLCAs 1, 1b and 2 are situated between current modern and fossil H. sapiens, and share strong similarities with Florisbad and KNM-ES 11693. Contrary to analyses A and B, Irhoud 1 is closer to early H. sapiens and is overall less similar to Neandertals (Fig. 5a). This is expected, as analysis C focuses mostly on facial morphology which is more modern in Irhoud 1 than its vault18. The Euclidean distances (Supplementary Data 3) underline this pattern of affinities: vLCAs 1, 2 and 1b are closer to the early H. sapiens, while vLCA2b is closer to Australians. Florisbad is the most similar to the vLCAs (0.0502 with vLCA2) and Irhoud 1 is closest to the early H. sapiens (0.0480). Finally, Fig. 5b presents the morphospace (56.4%, Supplementary Table 11) of analysis D. The exclusion of the missing landmarks of KNM-ES 11693 modifies slightly the relative phenotypic affinities, with early H. sapiens being more closely grouped with current modern human populations. The vLCAs cluster close to the centre of early H. sapiens variation, with the exception of vLCA2b (Fig. 5b). Florisbad and KNM-ES 11693 are the closest to both the H. sapiens fossils and the vLCAs. Omo II occupies a central position between modern and Neandertal populations, while Irhoud 1 presents strong affinities to Neandertals. Finally, the associated Euclidean distances (Supplementary Data 4) underline the strong similarities between vLCAs 1, 2 and 1b and early modern humans (respectively, 0.0211, 0.0212 and 0.0187), while vLCA2b is closer to Papuans (0.0214). Florisbad is the closest African LMP specimen to the vLCAs (0.0364), followed by Omo II (0.0605) and KNM-ES 11693 (0.0678). Irhoud 1, as in analysis A and B, is closest to the South European Neandertals (0.0476). The Procrustes distances-based boxplots (Supplementary Figs. 4 and 5) present the similarities of the vLCAs to the African LMP, Neandertal and H. sapiens specimens for analyses A B, C and D. 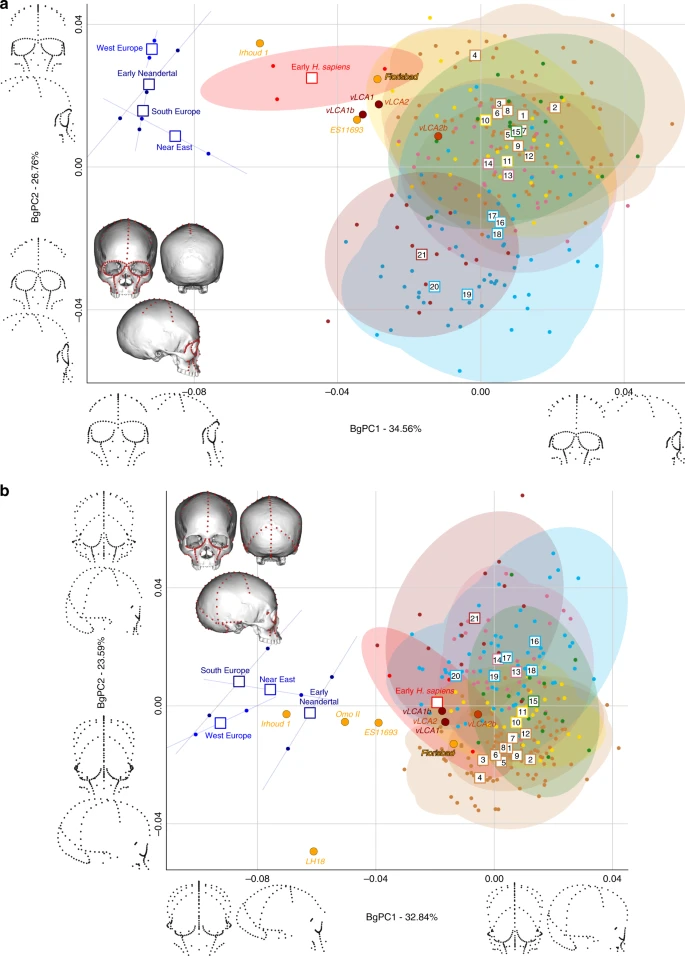 Fig. 5 In analysis A (Supplementary Fig. 4a and b), the vLCAs are closer to the modern human groups, especially to early H. sapiens, with which vLCAs 1, 2 and 1b share the shortest median distance. These three vLCAs are even closer to Florisbad, with Procrustes distances shorter than the median Procrustes distance to any other group. LH18, KNM-ES 11693, Irhoud 1 and Omo II Procrustes distances to the vLCAs are larger. vLCA2b shares more similarities with current modern humans. The overall similarity pattern with the vLCAs is comparable in analysis B (Supplementary Fig. 4c and d). However, in the absence of Florisbad, none of the African LMP fossils share strong similarities with the vLCAs: the shortest distance is to Omo II, but this is higher than any of the median distances to modern humans. Analysis C (Supplementary Fig. 5a and b) is comparable to analysis A: vLCAs 1, 2 and 1b, present a similar distance to Florisbad than to the median of early H. sapiens, and vLCA2b is closer to recent modern humans. KNM-ES 11693 and Irhoud 1 present larger Procrustes distances to vLCAs 1, 2 and 1b than their median distances to modern humans. Finally, analysis D (Supplementary Fig. 5c and d) depicts a different picture, as the vLCAs are closer to modern humans than to the African LMP fossils (KNM-ES 11693, LH18, Omo II and Irhoud 1) to the exception of Florisbad. |
|
|
|
Post by Admin on Sept 15, 2019 18:34:40 GMT
Discussion
The methodological approaches used in the present study have inherent uncertainties—biases from using different means and/or operators46,47,48 to obtain 3D data, number of variables versus the number of specimens, sliding of semilandmarks49,50,51, and sampling error to obtain mean population shapes52. To minimise this, the data were collected by a single operator; we reduced the number of variables by using PCs53 instead of aligned 3D coordinates throughout the study, and test models were run on non-slid semilandmarks, as well as subsamples of landmarks and semilandmarks (Supplementary Figs. 7–10). Supplementary Fig. 8 shows that the number of landmarks and the use of slid semilandmarks50 do not impact the reliability of the results. While sample size remains limited to the available fossil sample, sampling error can be assessed in the bgPCA analyses where specimens were analysed individually (Figs. 4 and 5, Supplementary Data 1–4). Finally, the modelling approach used here computes ancestral shapes which are weighted averages derived from the terminal taxa of a phylogenetic hypothesis54 of given topology using a Brownian motion model for evolution that mostly estimates drift. Those ancestral estimations are not intended to accurately represent evolution, but to act as tools to study the African LMP hominin fossil record in order to bring new insights into the origin of H. sapiens.
Our findings show that, first, the phenotypic data presented in this study relate closely to the genetic history39,55 of the considered populations. This is illustrated by the phylo-morphospace based on mean population shape data (Fig. 2), but also by the distribution of individual specimens’ shapes (Figs. 4 and 5). In addition, hypothesis 1, which takes into account an early out-of-Africa which preserves a phenotypic signal among the people of Sahul39, and hypothesis 2, which follows a more classic out-of-Africa event55, led to the computation of ancestral morphologies which are virtually undistinguishable (Fig. 3a, Supplementary Table 6). Yet, the topology of the phylogenetic tree of hypothesis 1 fits more closely the phenotypic variation of the data, as exemplified by the phylogenetic signal computed for the different phylogenies (Supplementary Table 4). The exclusion of the Khoisans and Pygmies has little impact on the first hypothesis, as the phenotype of vLCA1 and 1b remains comparable (Supplementary Fig. 3). Hypothesis 2 is more affected by this change, resulting in a very gracile morphotype (Supplementary Fig. 3) and lower values for the phylogenetic signal metrics (Supplementary Table 4). Therefore, the scenario simulated in hypothesis 1 appears to be slightly better supported by the phenotypic data presented here, which is congruent with recent genomic results14,39.
Second, the vLCAs’ morphologies are gracile and modern. The derived cranial features of H. sapiens are fully displayed in the vLCAs—a domed neurocranium, a reduced face and a marked basicranial flexion17, and only partly balanced by more archaic features (i.e., projecting brow-ridges, marked alveolar prognathism, weakly developed mastoid processes, elongated occipital bone, weakly marked incurvatio inframalaris frontalis, and wide interorbital distance; see refs. 12,42,44,45). One explanation for this gracile morphology can be found in the structure of the phylogenetic hypotheses. Under a Brownian Motion model of evolution, branch length contributes significantly to the ancestral reconstruction at the nodes54. Terminal taxa with long branch length will contribute more to the ancestral estimation. In the present hypotheses, the strongest influence on the ancestral reconstruction should be the Khoisans and Pygmies and, to a lesser extent, early H. sapiens. The Khoisans and Pygmies branch out very early from the H. sapiens stem lineage13,40, which may give an ‘archaic’ weight to their particularly gracile morphologies41. The derived morphologies of these populations, partly due to adaptation to the environment56, should be different from their ancestors’ phenotypes. The shape of the vLCAs may hence be influenced by this Khoisan/Pygmy morphological pattern by overestimating the antiquity of this gracile phenotype. This effect may only be partly balanced by the comparatively large and robust individuals (Qafzeh 6 and 9, and Skhūl V) of the early H. sapiens terminal taxon, since they are chronologically older than extant human populations and have a consequently shorter branch length (i.e., ~100 ka19,57). However, the early H. sapiens taxon plots within the 95% confidence envelope of the vLCAs in the phylo-morphospaces (Fig. 2 and Supplementary Fig. 2). In addition, the divergent morphologies (Supplementary Figs. 2 and 3) estimated from the b hypotheses reinforce this idea: the least plausible phylogeny (hypothesis 2b) yields the least plausible ancestral estimation for modern humans (vLCA2b). Thus, the gracile morphology of the computed vLCAs, while influenced by the theoretical framework of the modelling approach used here, appears to be more than just an artefact of the derivation of the ancestral morphologies from the extant descendants.
Despite the aforementioned uncertainties, and given the phenotypic affinities displayed by the LMP African hominins, a palaeoanthropological interpretation of those results is possible. The rapid fixation of the derived cranial traits shared by all recent H. sapiens with variable expression of robusticity traits58 could explain the phenotypes of the vLCAs. This could possibly have occurred through a process of localised drift during the very late Middle Pleistocene leading to population structuring16. The African LMP fossil mosaic morphologies combine archaic and modern characters, and the first occurrence of a full modern morphotype is not documented before Omo I (195 ka) and BOU-VP16/1 specimen from Herto (160 ka). None of the other LMP fossils shows the combined expression of modern human derived traits, while the computed vLCAs are modern humans and the universal cranial characters shared by all members of the species are present. This could support a rapid appearance of H. sapiens, consistent with the punctuated equilibrium theory59, however there is no evidence for a long and stable period of stasis in the Middle Pleistocene fossil record. On the contrary, current evidence suggests a dynamic biogeographic period driven by pronounced shifts in aridity and temperature60, during which drift and selection would have acted to create diversity at population and potentially species levels.
This scenario is consistent with the high level of phenotypic diversity in the LMP African hominin record. The results presented here highlight this diversity and allow to hypothesise the existence of different LMP morphotypes in Africa reflecting a structured population history (Fig. 4b). Three broad morphological patterns may be identified in the LMP fossil record: one represented by the Eastern African fossil LH18, the African LMP fossil sharing the least affinities with modern humans and the computed vLCAs (although some distortions61 on the calvarium may partly explain these phenotypic affinities); another exemplified by the North African fossil Irhoud 1, whose morphology is intermediate between modern humans and the Neandertals; and a possible third morph, represented by the South African fossil of Florisbad, and, to a lesser extent by the East African fossils KNM-ES 11693 and Omo II. Those three specimens present the shortest Euclidean distances to modern humans in all four analyses when the vLCAs are not taken into consideration (Supplementary Data 1–4). Indeed, the second shortest Euclidean distances observed is between Florisbad and early H. sapiens, between KNM-ES 11963 and the San, and between Omo II and early H. sapiens, and for analysis D with Alaskan Inuit (Supplementary Data 1–4). On the other hand, shortest Euclidean distance between Irhoud 1 and other groups is always to the South European Neandertals, except for analysis B where it is with early H. sapiens. Analysis B focuses mostly on the face which is where modern human-like traits have been identified in Irhoud 118. Finally, Florisbad is the LMP fossil most similar to the vLCAs, as exemplified by the Euclidean (Supplementary Data 1, 3, and 4) and Procrustes distances (Supplementary Figs. 4 and 5), and by the presence of a well-defined canine fossa, a fully formed tuber frontale and weakly projecting brow-ridges (Fig. 3b).
These results resonate with the age of the South African H. naledi remains4, a small-brained hominin with an unusual mosaic of ancient and modern traits, dated to the beginning of the LMP (i.e., 335–236 ka32). Both the discovery of an LMP ‘archaic’ looking Homo species and the results of the present study underline the complexity of the morphological variation within the genus Homo during the African LMP. As well as a high degree of population structure within the sapiens evolving lineage as suggested by our analyses, this complexity may encompass the presence of different Homo lineages in Africa. While some populations descending from an African H. heidelbergensis lineage may have coalesced to form H. sapiens following the African Multiregionalism hypothesis9, it is likely that some LMP African fossils were not associated with any population ancestral to H. sapiens. We should thus expect to find LMP fossils in Africa that were members of chronologically and geographically overlapping side branches of the Pleistocene human evolution tree, as the H. naledi remains seem to be4, reflecting different time-depths of lineage formation and extent of adaptive differences.
The eventual loss of these side branches could be the result of the cumulative effect of differential resilience to both climate change and inter-group competition. While the LMP fossil and archaeological record is at present insufficient to build a coherent model of diachronic change in population distributions, it could suggest a multi-phase16 process for the evolution of modern humans and their diversity. After the origin of the species in the late Middle Pleistocene, a second phase characterised by the successful expansion of modern human populations16 may have started as early as 194 ka3 but is clearly established by 130 ka, as documented by the increase in number of archaeological sites62, and the presence of a modern human population in the Levant3,43. The H. sapiens fossils from East Asia63, whose lower chronological boundary may extend to 120 ka64, may have been part of this earlier expansion phase. Genomic analysis offer conflicting evidence regarding such an early expansion of modern humans in Eurasia. The reported introgression of modern human DNA into Neandertals who lived ca. 100,000 years ago in the Altai Mountains65 would suggest that African populations had indeed expanded beyond the Levant during the last interglacial, as do some of the results based on the genotypic variation of Australians and Papuans today14,39,55. The contribution of this out-of-Africa dispersal during Marine Isotope Stage (MIS) 5 to the origin of current human diversity in Eurasia remains unclear. Nevertheless, other hominin populations and species (e.g., naledi) in Africa seem to have largely disappeared by MIS5, possibly due to the harsh climatic conditions during MIS666, which may have triggered local extinction events, and to competition with expanding groups of H. sapiens during the early phases of MIS5.
Following from these results, it is possible to tentatively draw a framework for the origin of H. sapiens. The speciation process appears to have been complex, going through different phases16 that may not have contributed to the genetic and phenotypic structure of current modern human populations. A first stage of phenotypic diversification, from 350 to 200 ka, may have happened locally with different contemporary populations forming local morphs of pre-H. sapiens groups as they are represented in the LMP fossil record. This phase may have been followed by a period of fragmentation and differential expansion of populations leading to hybridisation and coalescence of groups, which could have resulted in the emergence of morphologically derived populations of anatomically modern humans between 200 to 100 ka, as exemplified by the fossils from Herto, Skhūl and Qafzeh. Nevertheless, our results suggest that it is unlikely that all LMP local populations would have contributed equally, or at all, to the lineage that gave rise to the population ancestral to H. sapiens; local extinctions and founder effects would have shaped considerably the emergence of anatomically modern humans16. The morphology of the vLCAs computed in the present study appears to be closer to this last phase (i.e., 200–100 ka) than to the former one. This may indicate that chronologically older fossils of anatomically modern H. sapiens, representing populations which outlived most of the LMP hominin groups, are yet to be found.
Nature Communicationsvolume 10, Article number: 3406 (2019)
|
|
|
|
Post by Admin on Sept 23, 2019 18:19:02 GMT
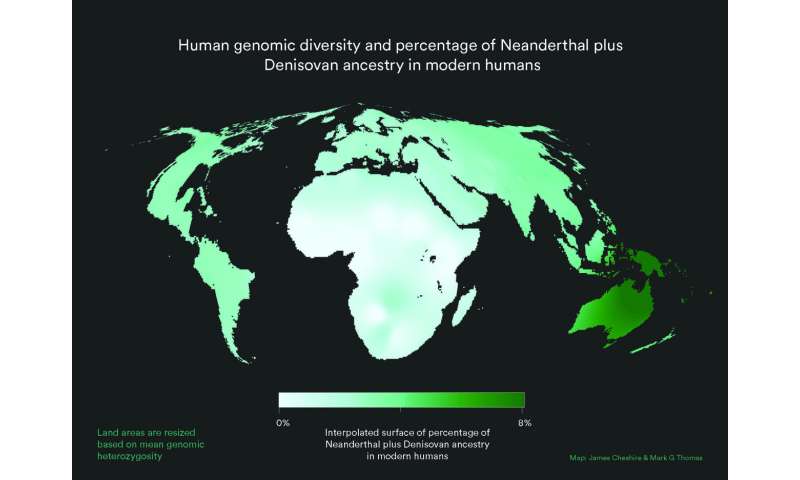 In a paper published in Nature Ecology and Evolution, a group of researchers argues that our evolutionary past must be understood as the outcome of dynamic changes in connectivity, or gene flow, between early humans scattered across Africa. Viewing past human populations as a succession of discrete branches on an evolutionary tree may be misleading, they said, because it reduces the human story to a series of "splitting times" which may be illusory. According to archaeologist Dr. Eleanor Scerri and geneticists Dr. Lounès Chikhi and Professor Mark Thomas, the quest for a single original location for modern humans is a wild goose chase. "People like us began to appear sometime between 500,000 and 300,000 years ago," says Dr. Scerri, group leader of the Pan-African Evolution Research Group at the Max Planck Institute for the Science of Human History and lead author of the study. "That is something in the order of 8000 generations, a long time for early people to move around and explore a big space. Their movements, patterns of mixing and genetic exchanges, are what gave rise to us." 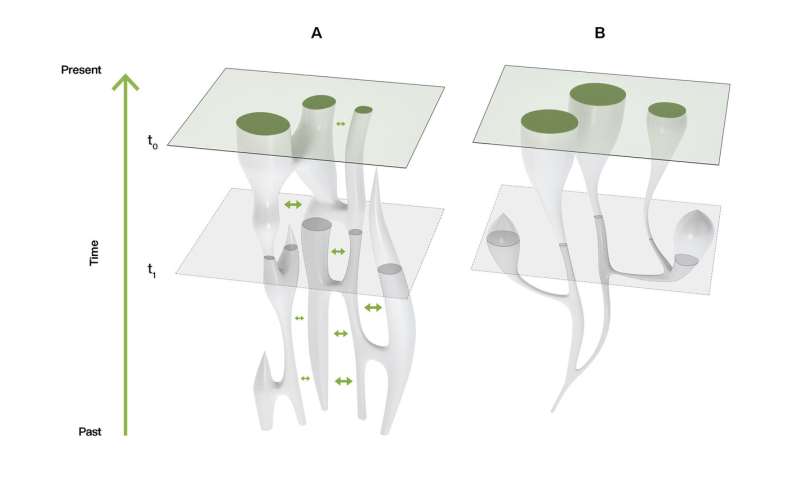 "The genetics of contemporary humans are very clear. The greatest genetic diversity is found in Africans," explains Prof. Thomas of University College London. "The old theory that we descend from regional populations spread across the Old World over the last million years or so is not supported by genetics data. Sure, non-Africans today have some ancestry from Neanderthals, and some have appreciable ancestry from the recently discovered Denisovans. And maybe other, as yet undiscovered ancient hominin groups also interbred with us, Homo sapiens. But none of this changes the fact that more than 90 percent of the ancestry of everybody in the world lies in Africa over the last 100,000 years." "The problem is that knowing that we are an African species has led many to ask the question 'where in Africa?'" he adds. "Superficially, this is a reasonable question. But when we consider the genetic patterns alongside what we know of fossils, ancient tools, and ancient climates, the 'single region of origin' view just doesn't cut it, and we have to start thinking differently. This means different models, and we argue in the current paper that structured population models are the way forward."  Fig. 1: Cartogram with resized land area representing modern human genetic diversity and colour representing Neanderthal plus Denisovan ancestry. "We see physically diverse early human fossils from across Africa, some very old genetic lineages and a pan-African shift in technology and material culture that reflects advanced cognition, including new technical and social innovations, across the continent. In other words, what you'd expect from a dynamic interconnected patchwork of populations that were at times more or less isolated from each other," says Dr. Scerri. "This would also help to explain the increasing evidence for unexpected populations, including in areas outside Africa such as the Hobbits on Flores," she adds. "Our African origins cannot be denied, but we definitely don't yet have the resolution to include or exclude different bits of evidence simply because they don't fit with a particular view. We need better reasons than that," says Dr. Scerri. 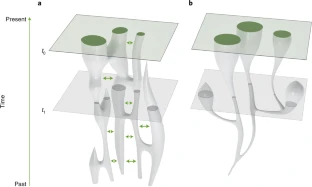 Fig. 2: Different models of population history. The past half century has seen a move from a multiregionalist view of human origins to widespread acceptance that modern humans emerged in Africa. Here the authors argue that a simple out-of-Africa model is also outdated, and that the current state of the evidence favours a structured African metapopulation model of human origins. Nature Ecology and Evolution (2019). |
|


