|
|
Post by Admin on Apr 24, 2019 18:32:44 GMT
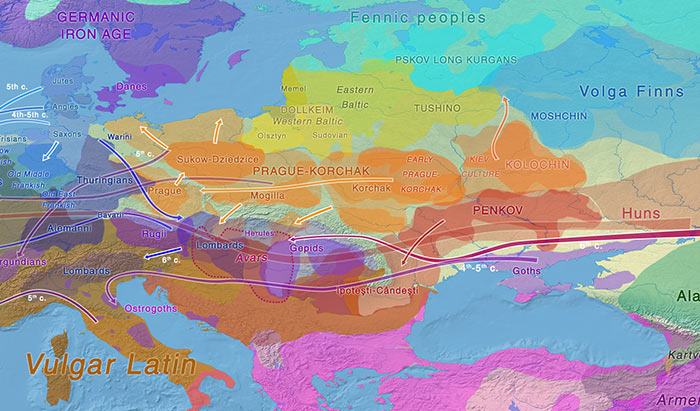 The “western” cluster of Early Slavs from Brandýsek, Bohemia (ca. AD 600-900). Two likely Slavic individuals from Usedom, in Mecklenburg-Vorpommern (AD 1200) show hg. R1a-M458 and E1b-M215 (Freder 2010). An early West Slav individual from Hrádek nad Nisou in Northern Bohemia (ca. AD 1330) also shows E1b-M215 (Vanek et al. 2015). One sample from Székkutas-Kápolnadülő (SzK/239) among middle or late Avars (ca. AD 650-710), a supposed Slavonic-speaking polity, of hg. E1b-V13. Two samples from Karosc (K1/13, and K2/6) among Hungarian conquerors (ca. AD 895-950), likely both of hg. E1b-V13, probably connected to the alliance with Moravian elites. Possibly a West Slavic sample from Poland in the High Middle Ages (see below). A later Hungarian sample (II/53) from the Royal Basilica, where King Béla was interred, of hg. E1b1, supports the importance of this haplogroup among elite conquerors, although its original relation to the other buried individuals is unknown. NOTE. You can see all ancient samples of haplogroup E to date on this Map of ancient E samples, with care to identify the proper subclades related to south-eastern Europe. About the ancestral origin of the haplogroup in Europe, you may read Potential extra Iberomaurusian-related gene flow into European farmers, by Chad Rohlfsen. 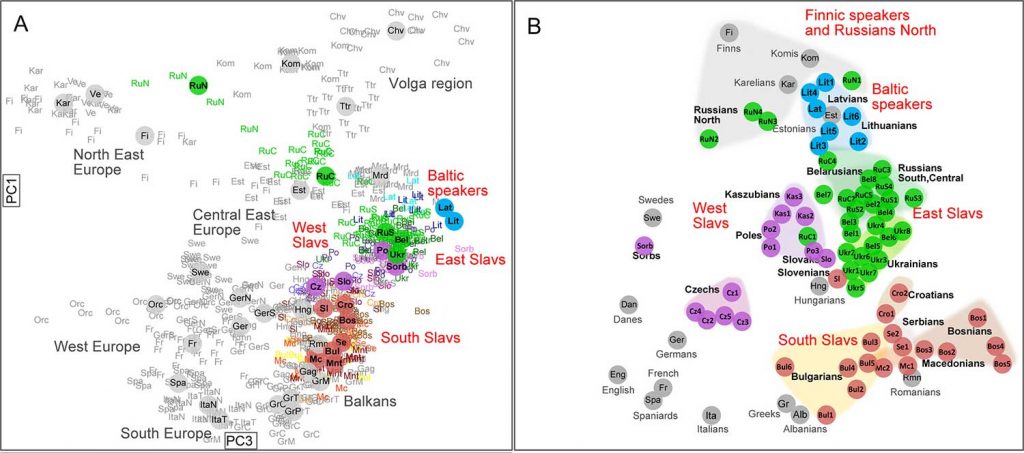 Even assuming that the R1a sample reported from the late Avar period is of a subclade typically associated with Slavs (I know, circular reasoning here), which is not warranted, we would have already 6 E1b1b vs. 1-2 R1a-M458 in populations that can be actually assumed to represent early Slavonic speakers (unlike many earlier cultures potentially associated with them), clearly earlier than other Slavic-speaking populations that will be sampled in eastern Europe. It is more and more likely that Early Slavs are going to strengthen Curta’s view, and this may somehow complicate the link of Proto-Slavic with eastern European BA cultures like Trzciniec or Lusatian. Back to Przeworsk and the “north of the Carpathians” homeland (i.e. between the Upper Oder and the Upper Dniester), but compatible with Curta’s view: Even if Common Slavic is eventually evidenced to be driven by small migrations north and south of the Danube during the Roman Iron Age, before turning into a mostly “R1a-rich” migration or acculturation to the north in Bohemia and then east (which is what this early E1b-V13 connection suggests), this does not dismiss the traditional idea that Late Bronze Age – Iron Age central-eastern Europe was the Proto-Slavic homeland, i.e. likely the Pomeranian culture disturbed by the East Germanic migrations first (in Przeworsk), and the migrations of steppe nomads later (around the Danube). Even without taking into account the connection with Baltic, the relevance of haplogroup E1b-V13 among Early Slavs may well be a sign of an ancestral population from the northern or eastern Carpathian region, supported by the finding of this haplogroup among the westernmost Scythians. The expansion of some modern E1b-CTS1273 lineages may link Slavic ancestrally with the Lusatian culture, which is an eastern (very specific) Urnfield culture group, stemming from central-east Europe. 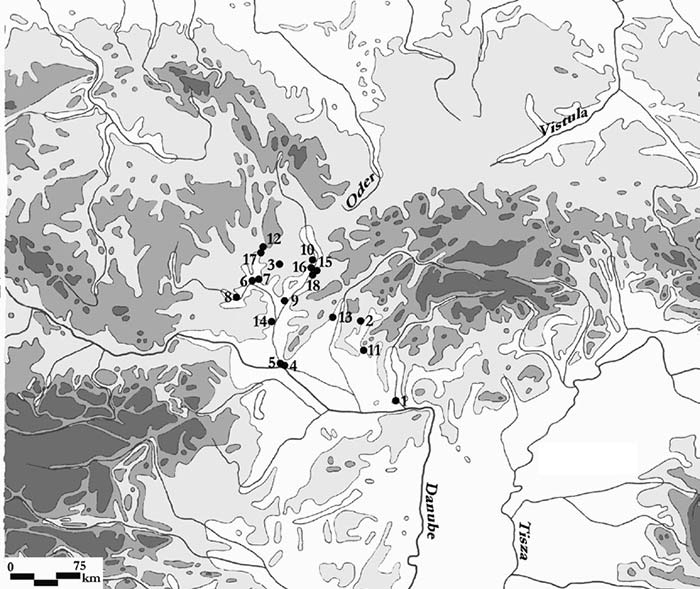 An important paper in this respect is the upcoming Zenczak et al., where another hg. E1b1 will be added to the list above: such a sample is expected from Poland (from Kowalewko, Maslomecz, Legowo or Niemcza), either from the Roman Iron Age or Early Middle Ages, close to an early population of likely Scandinavian origin (eight I1 samples), apart from other varied haplogroups, with little relevance of R1a. Whether this E-V13 sample is an Iron Age one (justifying the bottleneck under E-V13 to the south) or, maybe more likely, a late one from the Middle Ages (maybe supporting a connection of the Gothic/Slavic E1b bottleneck with southern Chernyakhov or further west along the Danube) is unclear. The finding of south-eastern European ancestry and lineages in both, Early Slavs and East Germanic tribes* suggests therefore a Slavonic homeland near (or within) the Przeworsk culture, close to the Albanoid one, as proposed based on topohydronymy. This may point to a complex process of acculturation of different eastern European populations which formed alliances, as was common during the Iron Age and later periods, and which cannot be interpreted as a clear picture of their languages’ original homeland and ancestral peoples (in the case of East Germanic tribes, apparently originally expanding from Scandinavia under strong I1 bottlenecks). * Iberian samples of the Visigothic period in Spain show up to 25% E1b-V13 samples, with a mixture of haplogroups including local and foreign lineages, as well as some more E1b-V13 samples later during the Muslim period. Out of the two E1b samples from Longobards in Amorim et al. (2018), only SZ18 from Szólád (ca. AD 412-604) is within E1b-V13, in a very specific early branch (SNP M35.2), further locating the expansion of hg. E1b-V13 near the Danube. Samples of haplogroup J (maybe J2a) or G2a among Germanic tribes (and possibly in Poland’s Roman Iron Age / Early Middle Ages) are impossible to compare with early Hungarian ones without precise subclades. 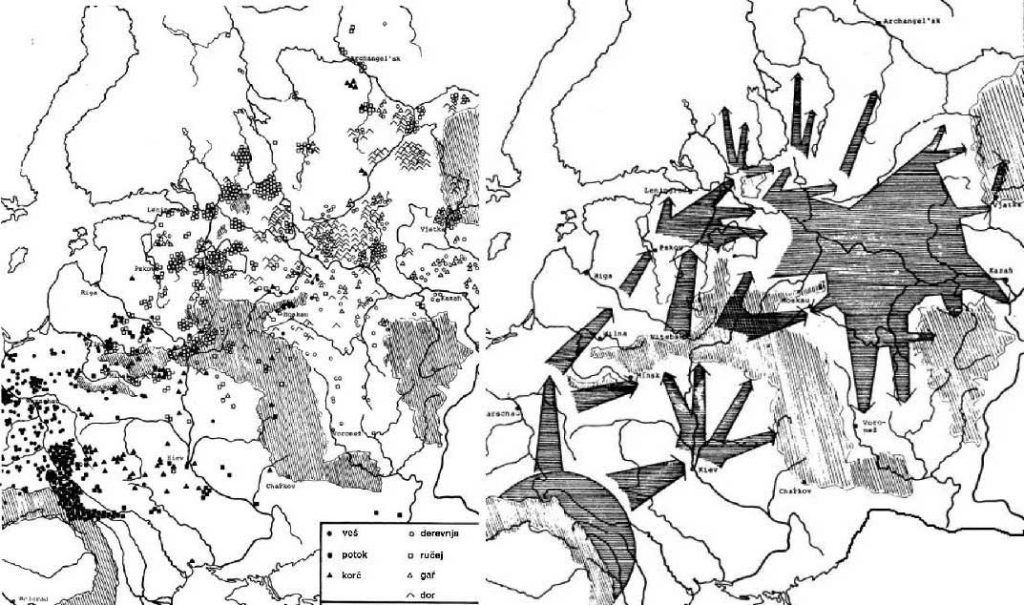 The finding of haplogroup E1b1b-M215 in two independent early West Slavic individuals further supports that the current distribution of R1a1a1b1a-Z282 lineages in Slavic populations is the product of recent bottlenecks. The lack of a precise subclade within the E1b1b-M215 tree precludes a proper interpretation of a potential origin, but they are probably under European E1b1b1a1b1-L618 subclade E1b1b1a1b1a-V13 (formed ca. 6100 BC, TMRCA ca. 2800 BC), possibly under the mutation CTS1273 (formed ca. 2600 BC, TMRCA ca. 2000 BC), in common with other ancient populations around the Carpathians (see below §viii.11. Thracians and Albanians). This gross geographic origin would support the studies of the Common Slavic homeland based on toponymy (Figure 66), which place it roughly between the Upper Oder and the Upper Dniester, north of the Carpathians (Udolph 1997, 2016). Remarkable is also its distribution among Rusyns, East Slavs from the Carpathians not associated with the Kievan Rus’, isolated thus quite soon from East Slavic expansions to the east. They were reported to show ca. 35% hg. E1b-V13 globally in FTDNA, with a frequency similar to or higher than R1a, in common with South Slavic peoples*, reflecting thus a situation similar to the source of East Slavs before further R1a-based bottlenecks (and/or acculturation events) to the east. Y-chromosome haplogroups are, in those cases, useful for ascertaining a more recent origin of the population. Like the finding of certain R1a-Z645, I2a-L621 & N-L392 lineages among Hungarians shows a recent origin near the Trans-Urals forest-steppes, or the finding of I1, R1b-U106 & E1b-V13 among Visigoths shows a recent origin near the Danube, the finding of Early Slavs (ca. AD 6th-7th c.) originally with small elite groups of hg. R1a-M458 & E1b-V13 from the Lower/Middle Danube – if strengthened with more Early Slavic samples, with Slavonic partially expanding as a lingua franca in some regions – is not necessarily representative of the Proto-Slavic community, just as it is clearly not representative of the later expansion of Slavic dialects. It would be representative, though, of the same processes of acculturation repeated all over Eurasia at least since the Iron Age, where no genetic continuity can be found with ancestral languages. |
|
|
|
Post by Admin on May 3, 2019 18:03:01 GMT
 The Nile corridor and the Strait of Bab-al-Mandeb on the southern end of the Red Sea have often been suggested as possible routes for hominin dispersals out of Africa. But the available evidence linking these regions to hominin dispersal is limited, and there is no strong consensus among researchers if these routes were always accessible or most desired by hominins. For example, while the presence of the Nile River makes dispersal along the Nile basin most plausible, the main Nile channel is believed to have ceased to exist between 1.8 and 0.8 million years ago. But there is evidence of hominin dispersal from Africa into the Levant (the area encompassing modern-day Palestine, Israel, Lebanon, Syria, Jordan and Iraq) dating to that time span. Without the Nile, could hominins have used a different route to reach the Levant?  Recently, we led a research team to fill the existing evidence gap about our ancestors’ route out of Africa. Our focus was on the western periphery of the Red Sea. This area links the fossil-rich Horn of Africa and the Sinai Peninsula, which is the only land bridge that could have facilitated direct hominin movement between Africa and Eurasia in the past 2 million years. We found evidence of hominin settlement in the area in the form of stone artifacts that suggests this region was a key early dispersal corridor—and possibly the first. That evidence includes stone tools, colloquially referred to as hand axes or bifaces. These were associated initially with the first fully bipedal (upright walker) hominin species, Homo erectus, and subsequently with other species.  The stone tool techno-complex associated with hand ax–making is conventionally called “Acheulean,” after a site in France called Saint-Acheul where such toolkits were first discovered in the mid-19th century. The hand axes we found reveal signs of controlled shaping and greater selectivity of raw material. The tool-makers were targeting fine-grained volcanic rocks as raw material, which demonstrates that they had the ability to identify good quality rocks that are easy to break and produce effective cutting edges. Based on their shape, we think the tools may have been used for cutting meat, extracting bone marrow or processing plant foods. No fossils have been found yet to confirm who made the tools. But the level of technical skills needed to create them hints at a well-developed understanding of the mechanical properties of the worked rocks and increased dependency on stone tools. Maintaining such a viable technological system must have required stable—and cooperating—social groups and advanced cognition. Because of its versatility, Acheulean technology is thought to have promoted a mobile lifestyle. Armed with their bifaces, the hominins who lived in our study area could easily have dispersed to and survived in diverse habitats. The most likely path was northward from the Gulf of Agig and the Khor Baraka basin up to the Sinai Peninsula and beyond. This paper reports results of a recent Stone Age-focused archaeological survey in the Red Sea coastal region of the Republic of Sudan, northeast Africa. Bifaces (handaxes) are the most conspicuous artifact class encountered during the survey and are characteristic of the Acheulean technocomplex. Other recorded artifact types include points, scrapers, and prepared core products referable to the Nubian and recurrent Levallois methods. Most of the artifact-bearing localities lie landward—outside of the coastal margin—thus, the evidence does not signify direct coastal adaptation per se. Our preliminary findings suggest that multiple Pleistocene-age hominin settlements tied to a terrestrial niche existed in the region. The western margin of the Red Sea occupies a pivotal location, linking the Horn of Africa and the Levant, two vital regions in human evolutionary research. Thus, the Stone Age data from the Sudan region has direct relevance for assessing hominin dispersal routes out of Africa. Journal of Field Archaeology Volume 44, 2019 - Issue 3 Pages 147-164 | Published online: 14 Mar 2019 |
|
|
|
Post by Admin on May 17, 2019 18:25:17 GMT
In order to investigate the role of the last Green Sahara in the peopling of Africa, we deep-sequence the whole non-repetitive portion of the Y chromosome in 104 males selected as representative of haplogroups which are currently found to the north and to the south of the Sahara. We identify 5,966 mutations, from which we extract 142 informative markers then genotyped in about 8,000 subjects from 145 African, Eurasian and African American populations. We find that the coalescence age of the trans-Saharan haplogroups dates back to the last Green Sahara, while most northern African or sub-Saharan clades expanded locally in the subsequent arid phase.  Fig. 1 Regions of the MSY selected for the target next generation sequencing. a The human Y chromosome. b Targeted blocks of the X-degenerate portion of the MSY analysed in this study (the exact coordinates on the Y chromosome are reported in Additional file 1: Table S6 and a description of the selection criteria is reported in the “Methods” section). c Y chromosome ruler calibrated on the February 2009 (GRCh37/hg19) assembly In the set of 104 samples from our lab collection, we identified 5966 SNPs. Interestingly, 3044 variants (51 %) out of the 5966 were not reported in previous studies [30, 48, 50, 51] and this figure is significantly greater than that reported by Hallast et al. [50] (51 vs 36.6 %, Chi-squared test: p < 2.2 × 10⁻¹⁶), despite the fact the experimental approaches were similar (target sequencing) and the number of sequenced samples by Hallast and collegues [50] was about four times higher (Additional file 2: Figure S1). After the inclusion of the 46 samples from the literature [45, 46, 47, 48, 49], the total number of variants increased to 7544 (Additional file 1: Table S2). We used all 7544 SNPs in the whole set of 150 subjects to reconstruct a maximum parsimony tree (Fig. 2a), which was found to be coherent with the recently published world-wide Y phylogenies [48, 51]. 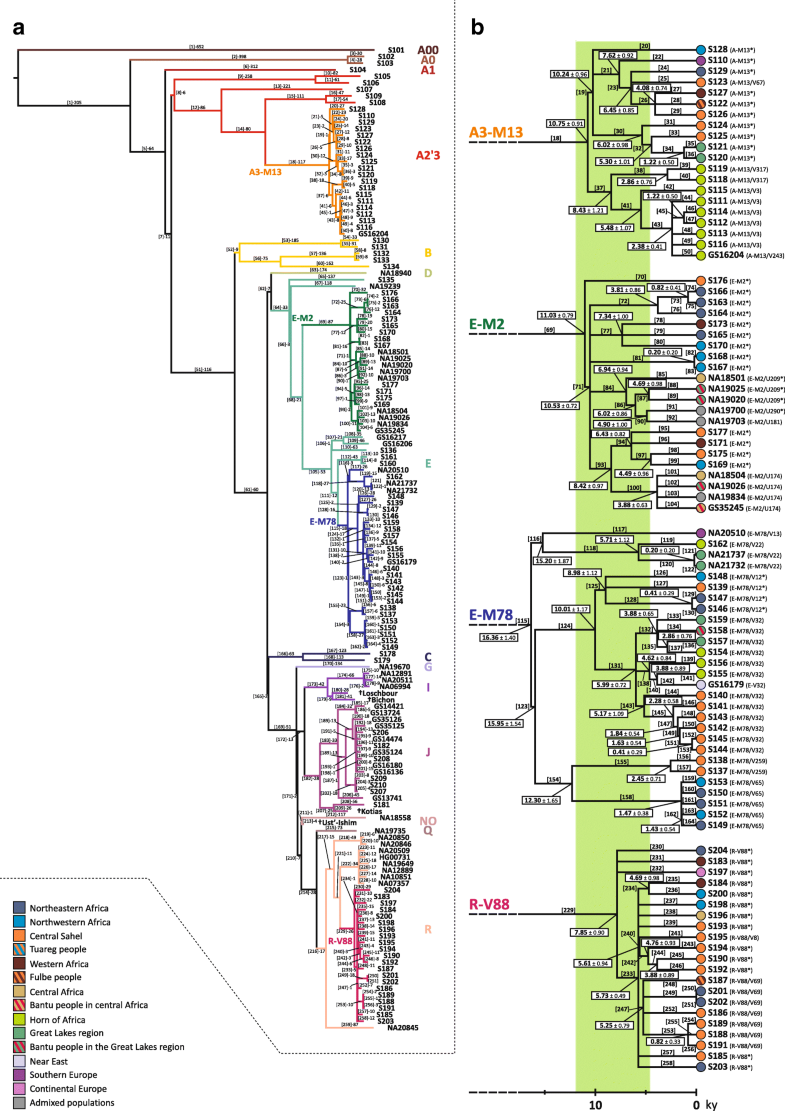 Fig. 2 Maximum parsimony Y chromosome tree and dating of the four trans-Saharan haplogroups. a Phylogenetic relations among the 150 samples analysed here. Each haplogroup is labelled in a different colour. The four Y sequences from ancient samples are marked by the dagger symbol. b Phylogenetic tree of the four trans-Saharan haplogroups, aligned to the timeline (at the bottom). At the tip of each lineage, the ethno-geographic affiliation of the corresponding sample is represented by a circle, coloured according to the legend (bottom left). The last Green Sahara period is highlighted by a green belt in the background By calibration with the four archeologically dated specimens, we obtained a mutation rate of 0.735 × 10⁻⁹/site/year, which is consistent with previously published estimates [47, 51, 52] and which was used to obtain an accurate estimate of the coalescence age of the tree nodes, with a particular focus on the four trans-Saharan clades. We obtained the time estimates using two different approaches: Rho statistics (Table 1) and the BEAST method. We performed two different BEAST runs, under a strict or a relaxed clock, respectively (Additional file 1: Table S3). The obtained point values were found to be highly concordant (Pearson test, R2 > 0.99; p < 2.2 × 10⁻¹⁶), as previously observed [19] (Additional file 2: Figure S2). For this reason, hereafter we only report and discuss the time estimates based on the Rho statistics (Fig. 2b). A3-M13 phylogeny is characterised by a first bifurcation separating branches 19 and 37 about 10.75 kya. Interestingly, branch 19 has a widespread distribution, harbouring lineages from within and outside the African continent, and is dated to 10.24 kya, suggesting a role of the humid period in the diffusion of this clade. On the contrary, branch 37 only includes samples from the Horn of Africa (Ethiopia, Eritrea, Djibouti and Somalia) and is dated to 8.43 kya. The topology of E-M2 is characterised by a main multifurcation (downstream to branch 71), dating back to the beginning of the last Green Sahara (10.53 kya) and including all the deep-sequenced samples except one (branch 70), consistent with the tree reported in phase 3 of the 1000 Genomes Project [51]. However, we found 11 subclades (branches 72, 73, 74, 75, 76, 79, 81, 82, 95, 98 and 99) which share no markers with the 262 E-M2 chromosomes analysed by Poznik and collegues [51]. It is worth noting that branches 72 and 81 are two deep sister lineages within the E-M2 main multifurcation (Fig. 2) and both of them include chromosomes from northern Africa. Similarly, the other terminal lineages absent in the 1000 Genomes Project’s tree are mainly represented by samples from northern Africa or, to a lesser extent, from the northernmost regions of sub-Saharan Africa (i.e. the central Sahel) (Fig. 2b). The phylogenetic structure of E-M78 has been resolved in a recent study [35]; however, we obtained further information about the relationships within the E-V12 sub-clade. The former E-V12* chromosomes form a monophyletic cluster (branch 125), dated to 8.98 kya and sister to E-V32 (branch 131), which in turn is further subdivided into three sister clades (branches 132, 138 and 143). While branches 132 and 138 have been found in eastern Africa, where E-V32 is more frequent, branch 143 only includes samples from central Sahel (Fig. 2b). Finally, the R-V88 lineages date back to 7.85 kya and its main internal branch (branch 233) forms a “star-like” topology (“Star-like” index = 0.55), suggestive of a demographic expansion. More specifically, 18 out of the 21 sequenced chromosomes belong to branch 233, which includes eight sister clades, five of which are represented by a single subject. The coalescence age of this sub-branch dates back to 5.73 kya, during the last Green Sahara period. Interestingly, the subjects included in the “star-like” structure come from northern Africa or central Sahel, tracing a trans-Saharan axis. It is worth noting that even the three lineages outside the main multifurcation (branches 230, 231 and 232) are sister lineages without any nested sub-structure. The peculiar topology of the R-V88 sequenced samples suggests that the diffusion of this haplogroup was quite rapid and possibly triggered by the Saharan favourable climate (Fig. 2b). In general, our NGS results and time estimates show that the large majority of the lineages shared by northern Africans and sub-Saharan Africans coalesced during the last Green Sahara period. Conversely, after 5 kya, we mainly found lineages restricted to either northern or sub-Saharan regions, with few exceptions (Fig. 2b). |
|
|
|
Post by Admin on May 17, 2019 18:39:48 GMT
Population analysis of the four trans-Saharan clades In order to gain more information about the ethno-geographic distribution of the four trans-Saharan haplogroups (Fig. 3), we selected 142 informative markers (Additional file 1: Table S4) belonging to these lineages and analysed them in a wider sample composed of 7955 males from 145 worldwide populations (128 from our lab collection and 17 from the literature) (Fig. 4) [51, 53] (Additional file 1: Table S5). It is worth noting that 96 ethnic groups come from different African regions, allowing us to obtain a detailed picture of the genetic variability of the four haplogroups across the Sahara (Figs. 3 and 4). 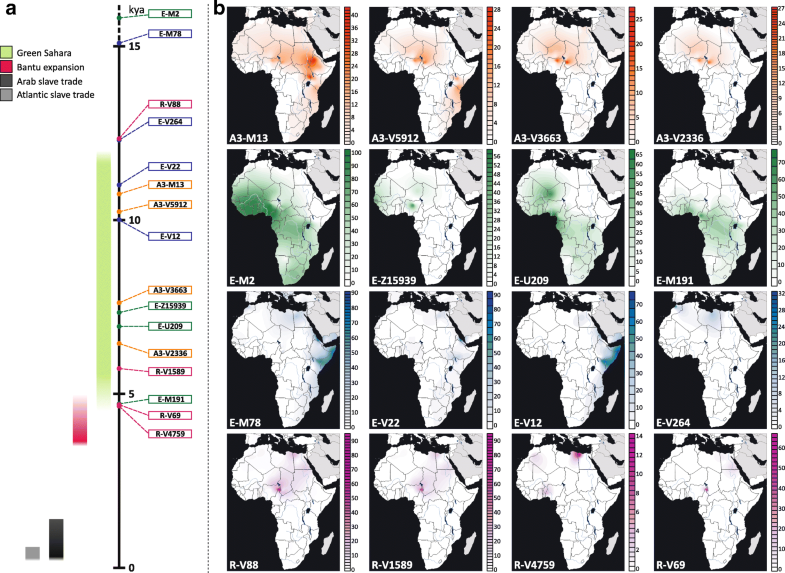 Fig. 3 Time estimates and frequency maps of the four trans-Saharan haplogroups and major sub-clades. a Time estimates of the four trans-Saharan clades and their main internal lineages. To the left of the timeline, the time windows of the main climatic/historical African events are reported in different colours (legend in the upper left). b Frequency maps of the main trans-Saharan clades and sub-clades. For each map, the relative frequencies (percentages) are reported to the right The genotyping results for A3-M13 confirmed its very high geographic differentiation, with most lineages restricted to one geographic area. There are few exceptions to this general pattern, i.e. A3-V2742*, A3-V2816* and A3-V3800, which were found in two different regions, usually belonging to the same geographical macro-area (Additional file 2: Figure S3). While A3-V1018 is restricted to the Horn of Africa, its sister clade, A3-V5912, is more widespread, arriving as far as southern Europe (more specifically, Sardinia) (Additional file 1: Table S5). Most of the Mediterranean lineages coalesced with sub-Saharan clades in a time window between 10.24 and 6.45 kya (where the upper and lower limit are the coalescence ages of A3-V5912 and A3-V2336, respectively) (Fig. 3b), during the last humid phase of the Sahara (12–5 kya). After this period, the lineages are restricted to sub-Saharan Africa or northern Africa. It is worth noting that A3-V4735 has been found both in central Sahel and in the Great Lakes region (Kenya and Uganda) in eastern Africa, suggesting a movement along the Sahelian belt starting during the final period of the last Green Sahara (6.02–5.30 kya). It is known that the geographic distribution of E-M2 in sub-Saharan Africa has been heavily influenced by the recent (< 3 kya) Bantu expansion [11, 12, 13, 14, 15, 16, 17] and this is mirrored by the high frequencies of several E-M2 sub-clades among the Bantu people, in particular E-U290 and E-U174 (Additional file 1: Table S5 and Additional file 2: Figure S4). However, we found clues as to the role of the last Green Sahara considering the phylogeography of the E-M2 sub-clades in northern Africa. The coalescence age of the lineages harbouring northern and sub-Saharan chromosomes predates the onset of the arid conditions, falling between 11.03 kya (coalescence age of E-Page66) and 4.49 kya (the time estimate of the most recent clade harbouring a relevant proportion of northern African samples, i.e. E-V5280), during the last Green Sahara. After this time frame, we observed clades restricted to the north or to the south of the Sahara. In this context, although the large majority of the geographically restricted lineages come from sub-Saharan regions, we also found two northern African-specific clades, namely E-V5001 and E-V4990. E-V5001 has only been found in Egypt, is one of the sister clades within the E-M4727 multifurcation and coalesced at 3.88 kya. E-V4990 is a Moroccan clade dated to < 4.49 kya (the time estimate of the upstream node). Interestingly, it is the terminal branch of a nested topology, which divides western Africa from Morocco. We found a relevant proportion (~ 22 %) of African-American subjects belonging to the E-M2 haplogroup (Additional file 1: Table S5). These groups have been heavily influenced by the Atlantic slave trade, which took place between the XV and XIX centuries and of which the source populations were mainly sub-Saharan people. Consistent with the autosomal data [55], these subjects have been found to be very similar to the source African populations in their E-M2 sub-haplogroup composition (Additional file 2: Figure S4). 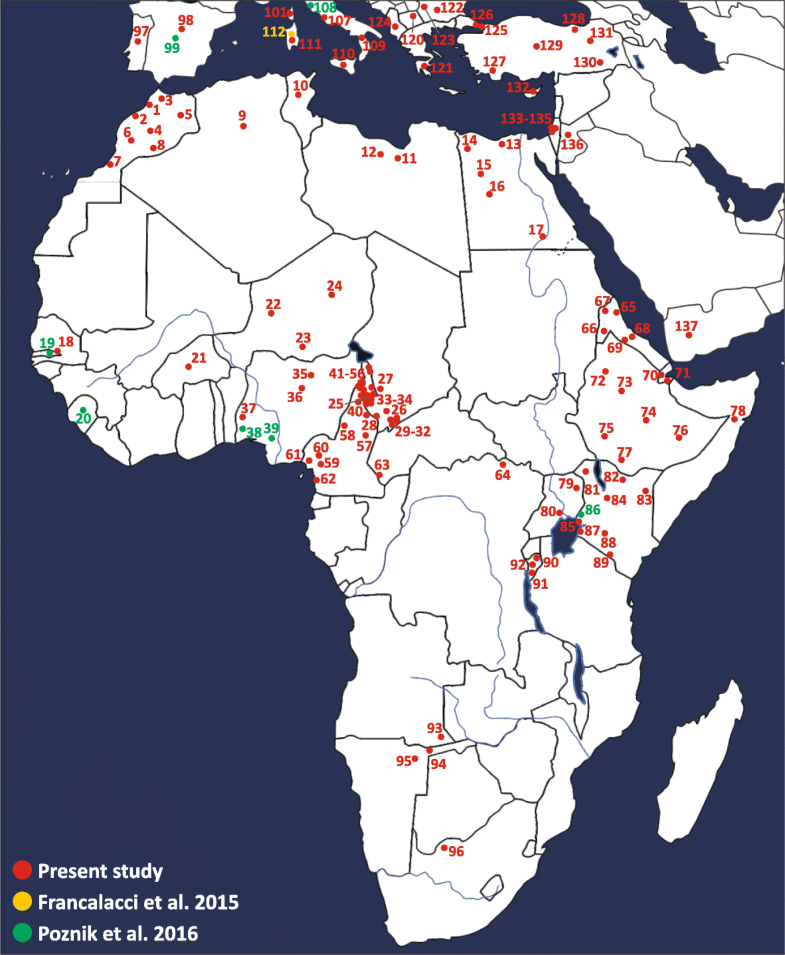 Fig. 4 Map of the populations analysed. Geographic positions of the populations from Africa, southern Europe and Near East are shown. For population labels refer to Additional file 1: Table S5 The distribution and age estimates of different E-M78 sub-haplogroups show a strong parallelism. Excluding the E-V13 subclade, which has been linked to the Neolithic transition in the Near East [34], all the other three major E-M78 lineages (E-V264, E-V22 and E-V12) include a Mediterranean clade (harbouring northern African, near-eastern and southern European samples) and a sub-Saharan clade (Fig. 3b; Additional file 2: Figure S5). The age estimates of the nodes joining the lineages from these two macro-areas are quite concordant (12.30 kya for E-V264, 11.01 kya for E-V22 and 10.01 kya for E-V12) and correspond to the beginning of the humid phase in the eastern Sahara, where E-M78 probably originated [34, 35]. After the end of the last Green Sahara (~ 5 kya), the differentiation is sharp, with no lineages including both Mediterranean and sub-Saharan subjects. The sub-Saharan clades E-V264/V259 and E-V22/V3262 are restricted to central Sahel and eastern Africa (mainly the Horn of Africa), respectively, whereas E-V12/V32 is very frequent in eastern Africa but it also includes a central Sahelian clade, suggesting a Sahelian movement between 5.99 and 5.17 kya. The genotyping of R-V88 internal markers disclosed the phylogenetic relationships of two rare European sub-clades (R-M18 and R-V35) with respect to African-specific clades (Additional file 2: Figure S6). The presence of two nested R-V88 basal European clades can be related to the high frequencies of R-V88 internal lineages in the central Sahel assuming a movement from Europe toward the central Sahel across northern Africa. In turn, considering the trans-Saharan distribution and the “star-like” topology of the sub-clade R-V1589 (branch 233), it is likely that this lineage rapidly expanded in the lake Chad area between 5.73 and 5.25 kya and moved backward to northeastern Africa across the Saharan region (Fig. 3b; Additional file 2: Figure S6). The large majority of R-V1589 internal lineages harbours both northern and central Sahelian subjects, with the exception of R-V4759 and R-V5781, which are mainly restricted to northern Africa and central Sahel, respectively (Additional file 1: Table S5). The presence of a precisely dated and geographically restricted clade (R-V4759 in northern Africa; Additional file 1: Table S5 and Additional file 2: Figure S6) allowed us to define its coalescence age (4.69 kya) as the lower limit for the backward R-V88 trans-Saharan movement. Outside Africa, both A3-M13 and R-V88 harbour sub-lineages geographically restricted to the island of Sardinia and both seem to indicate ancient trans-Mediterranean contacts. The phylogeography of A3-M13 suggests that the direction of the movement was from Africa to Sardinia, while R-V88 topology indicates a Europe-to-Africa migration. Indeed, our data suggest a European origin of R-V88 about 12.3 kya, considering both the presence of two Sardinian R-V88 basal clades (R-M18 and R-V35) and that the V88 marker arose in the R-M343 background, which in turn includes Near-Eastern/European lineages [52]. It is worth noting that the arrival of R-V88 in the Sahara seems to have occurred between 8.67 and 7.85 kya (considering as an upper limit the time estimates of the last node including a European-specific lineage, while the lower limit is the coalescence age of all the African-specific lineages), refining the time frame of the trans-Saharan migration proposed in previous studies [37, 56]. The route of R-V88 toward the lake Chad basin probably passed through northeastern Africa rather than Arabia, considering the absence of R-V88 in the Horn of Africa. Interestingly, both A3-M13 and R-V88 European sub-clades coalesced in ancient times (> 7.62 kya for A3-M13/V2742 and between 12.34 and 8.67 kya for R-V88/M18 and R-V88/V35) (Additional file 2: Figures S2 and S5). So it is possible that both clades were widespread in southern Europe, where they have been replaced by the Y haplogroups brought by the following recurrent migration waves from Asia [57]. Role of the Green Sahara in the distribution of the four haplogroups The large majority of nodes joining northern and sub-Saharan patrilineages date back to the Green Sahara period. On the contrary, most clades geographically restricted to one of these two macro-regions coalesced after 5 kya. Usually, the presence of a sub-Saharan genetic component in northern Africa is put down to the Arab slave trade (VII–XIX centuries) from the sub-Saharan regions towards the markets located along the Mediterranean coast [42, 43, 44]. If this was the case, we should observe no significant differences in the sub-Saharan component of Y haplogroups between the African American and northern African populations, since both the Atlantic and the Arab slave trade are recent events, which involved the same source geographic area (Fig. 3a). However, considering the distribution of E-M2 sub-lineages in the American admixed, northern African and sub-Saharan populations (Fig. 5), we found a significant correlation between admixed and sub-Saharan groups (Spearman’s Rho = 0.687, p = 3.76 × 10⁻⁶) consistent with the genome-wide data [55, 58], while northern Africans and sub-Saharan people were not correlated (Spearman’s Rho = 0.07, p = 0.68). Consistent with these findings, also northern Africans and American admixed people were found not to be correlated (Spearman’s Rho = 0.22, p = 0.19). 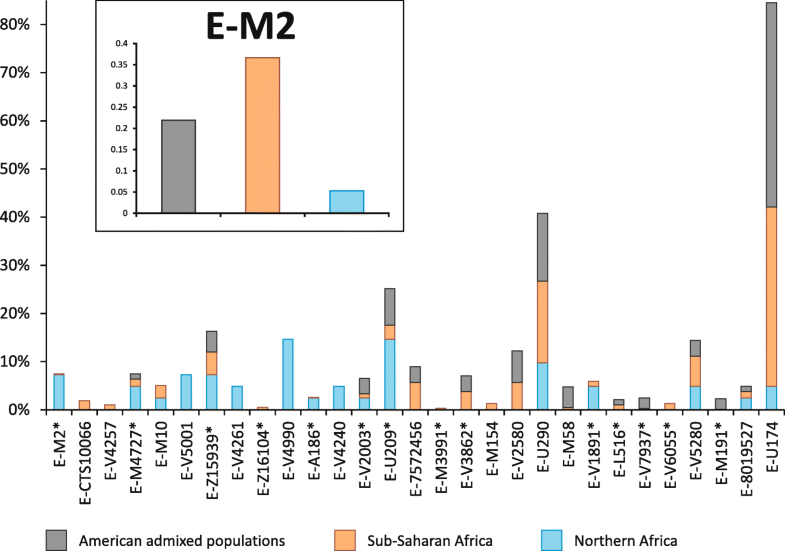 Fig. 5 Relative proportions of American admixed, sub-Saharan or northern African Y chromosomes belonging to the E-M2 sub-clades. Data from the nomadic populations (Tuareg and Fulbe) and from seven lineages with an absolute frequency equal to 1 were not used for the generation of this graph. Compared to the macroregion sub-division reported in Additional file 1: Table S5, we collapsed “Northeastern Africa” and “Northwestern Africa” macroregions into “Northern Africa”, while the “Sub-Saharan Africa” group includes “Central Sahel”, “Western Africa”, “Central Africa”, “Great Lakes region”, “Horn of Africa”, “Southern Africa” and all the Bantu groups in these regions. In the inset, we report the relative frequencies of the whole E-M2 haplogroup in the same macroregions The same pattern was also observed when only the western-central Sahelian groups of sub-Saharan Africa were considered (admixed vs. western-central Sahel, Spearman’s Rho = 0.509, p = 1.51 × 10⁻³; northern Africa vs western-central Sahel, Spearman’s Rho = 0.218, p = 0.2). These data suggest that the presence in northern Africa of sub-Saharan patrilineages was not due to recent contacts but probably occurred in more ancient times, possibly during the Green Sahara period considering the coalescence ages of the clades. Our findings seem to be at odds with genome-wide studies [42, 43, 59, 60] reporting a recent relevant sub-Saharan genetic component in modern northern African populations, mainly attributed to the Arab slave trade. This apparent discrepancy between inferences based on Y chromosomal and autosomal data could be the consequence of a sex-biased sub-Saharan contribution to the northern African gene pool that occurred in historical times. Indeed, it is known that the trans-Saharan Arab slave trade involved twice as many servile women as men (almost the reverse of the Atlantic slave trade ratio). Moreover, few male slaves left descendants, whereas female slaves were imported in northern Africa as household servants and as concubines and their offspring were born free, thus contributing to the local gene pool [54, 61]. Thus, we suggest that the Arab slave trade mainly contributed to the mtDNA and autosomal gene pool of present-day northern Africans, whereas the paternal gene pool was mainly shaped by more ancient events. This hypothesis is in line with genome-wide data obtained from three ancient Egyptian mummies (dated between ~ 2.5 and 2 kya) showing a not negligible ancient sub-Saharan component (~ 6–10 %) [44]. Considering the data for all the four trans-Saharan haplogroups reported here, we can try to paint a comprehensive picture of the events during the last African humid period. The first occupation of the Sahara may have occurred from both northern and southern regions, following the spread of the fertile environment and according with the two-way occupation of the Green Sahara proposed on the basis of paleoanthropological evidence [2]. The topology and geographic distribution (Additional file 2: Figures S3 and S4) of both A3-M13 and E-M2 suggest that these lineages were brought to the Sahara from the southern regions, while E-M78 and R-V88 seem to have followed the opposite route. The fertile environment established in the Green Sahara probably promoted demographic expansions and rapid dispersals of the human groups, as suggested by the great homogeneity in the material culture of the early Holocene Saharan populations [62]. Our data for all the four trans-Saharan haplogroups are consistent with this scenario, since we found several multifurcated topologies, which can be considered as phylogenetic footprints of demographic expansions. The multifurcated structure of the E-M2 is suggestive of a first demographic expansion, which occurred about 10.5 kya, at the beginning of the last Green Sahara (Fig. 2; Additional file 2: Figure S4). After this initial expansion, we found that most of the trans-Saharan lineages within A3-M13, E-M2 and R-V88 radiated in a narrow time interval at 8–7 kya, suggestive of population expansions that may have occurred in the same time (Fig. 2; Additional file 2: Figures S3, S4 and S6). Interestingly, during roughly the same period, the Saharan populations adopted pastoralism, probably as an adaptive strategy against a short arid period [1, 62, 63]. So, the exploitation of pastoralism resources and the reestablishment of wetter conditions could have triggered the simultaneous population expansions observed here. R-V88 also shows signals of a further and more recent (~ 5.5 kya) Saharan demographic expansion which involved the R-V1589 internal clade. We observed similar demographic patterns in all the other haplogroups in about the same period and in different geographic areas (A3-M13/V3, E-M2/V3862 and E-M78/V32 in the Horn of Africa, E-M2/M191 in the central Sahel/central Africa), in line with the hypothesis that the start of the desertification may have caused massive economic, demographic and social changes [1]. Genome Biology 2018 19:20 |
|
|
|
Post by Admin on May 24, 2019 19:31:56 GMT
Estimating Gene Flow Between Africa and Europe. Ancestry proportions. Previous work suggests that European and North African human populations exhibit moderate to substantial population differentiation (Fst = 0.06) (25). The degree to which admixture vs. population divergence contributes to this genetic differentiation remains largely unexplored. To estimate allele-based sharing between Africans and Europeans, we applied an unsupervised clustering algorithm, ADMIXTURE (33), to data from all populations (SI Appendix, Table S1). We explored k = 2–10 ancestral populations and performed 10 iterations for each k (SI Appendix, Figs. S1 and S2). Our analysis does not assume that source populations are unadmixed; that is, since the analysis is run unsupervised, Sub-Saharan African ancestry, for example, can be detected in both North Africans and Europeans. Furthermore, estimates of admixture based on hundreds of thousands of markers (as we use here) show little bias using an unsupervised approach when the ancestral populations are significantly diverged (34). As the number of kancestral clusters increased, we observed several well-supported population-specific ancestry clusters. We conservatively present k = 3 through 6 (Fig. 1) but additional results are presented in the SI Appendix.  Fig. 1. Allele-based estimates of ancestry in Europe and for European Jews, the Near East, North Africa, and Sub-Saharan Africa. Unsupervised ADMIXTURE results for k = 3–6. Cross-validation indicated k = 4 as the best fit, but higher density datasets (25) and higher values of k continue to identify population-specific ancestries (SI Appendix, Fig. S2); we therefore conservatively focused on k = 3:6 ancestral populations. At k = 4, the ancestry assignment differentiated between non-Jewish European populations (from now on referred to as “European”), European Jews, Sub-Saharan Africans, and a group formed by Near Eastern and North African populations. At k = 5,6 components mainly assigned to North African populations and Tunisian Berbers, respectively, clearly appear. European populations sharing this North African ancestral component are almost exclusively in southern Europe (Fig. 1 and SI Appendix, Fig. S3). Southern European populations have a high proportion (5–35%) of joint Near Eastern | North African ancestry assigned at k = 4. However, identification of distinct Near Eastern and North African ancestries in k ≥ 5 differentiates southeastern from southwestern Europe. Southwestern European populations average between 4% and 20% of their genomes assigned to a North African ancestral cluster (SI Appendix, Fig. S3), whereas this value does not exceed 2% in southeastern European populations. Contrary to past observations, Sub-Saharan ancestry is detected at <1% in Europe, with the exception of the Canary Islands. In summary, when North African populations are included as a source, allele frequency-based clustering indicates better assignment to North African than to Sub-Saharan ancestry, and estimates of African ancestry in European populations increase relative to previous studies. European ancestry is also detected in North African populations. At k = 6 it ranges between 4% and 16% in the rest of North Africa, with notable intrapopulation variation (35) and is absent in most Maghrebi (western North African) individuals from Tunisia and Western Sahara. To test whether our results were robust to the inference procedure in ADMIXTURE, we compared the ADMIXTURE results to those from a supervised machine learning algorithm, RFMix (36). Our analysis assumed three putative source populations for ancestry in Europeans: German, Saharawi, and Qatari. Estimates of North African ancestry range between 5% and 14% in the European populations and trends of the overall ancestry clines are concordant with ADMIXTURE (SI Appendix, Table S2 and Fig. S4). We tested whether ADMIXTURE could accurately infer North African ancestry proportions in Europeans via simulation of historical admixture scenarios; we find that k = 4,5 gave more accurate admixture estimates of North African ancestry. The correlation between the simulated North African ancestry and the one inferred with ADMIXTURE dramatically increases from k = 3,4 in all simulated populations (SI Appendix, Fig. S4) and the average difference in ancestry proportions at the individual level decreases from 0.04 to 0.02 when 4 or 5 ancestral components are considered.  Fig. 2. Haplotype-based estimates of genetic sharing between Europe and Africa show a significant latitudinal gradient where the highest sharing is in the Iberian Peninsula. Isolation by distance. It has been shown that ADMIXTURE may misidentify ancestral components when the populations tested follow an isolation by distance model (37). To test whether the North African component detected by ADMIXTURE reflects admixture from distinct source populations or is a consequence of an isolation-by-distance process, we performed a Mantel test comparing pairwise genetic and geographic distances among European and North African populations. The great circle geographic distances between populations were calculated including a western waypoint located at the Gibraltar Strait for North Africa, following ref. 38. A Mantel test was performed using the software Isolation by Distance, Web Service v3.23 (39). When all European and North African populations are included in the analysis, there is a positive correlation between genetic and geographic distances of r2 = 0.268. However, this result is driven by isolation by distance within the European population (SI Appendix). When we compared genetic and geographic distances focusing only on pairwise European vs. North African comparisons, no correlation between genetic and geographic distance is found, r2 < 0.001 (P = 0.931), ruling out the hypothesis that gene flow between North Africa and Europe follows an isolation-by-distance model (SI Appendix, Fig. S5). Long identical-by-descent haplotypes. Recent gene flow among populations results in haplotypes shared identical by descent. To investigate differences in African ancestry among European populations, we identified genomic segments inferred to be IBD among samples from Sub-Saharan Africa, North Africa, Europe, and the Near East (SI Appendix). Migration from one endogamous population to another generates genetic segments that share a recent common ancestor (and over short time spans are IBD) between the two populations; the distribution and length of IBD segments are informative of recent migration. We restrict our analysis to IBD segments greater than 1.5 cM identified using fastIBD (40). Long IBD segments can be reliably detected even if there is substantial ascertainment bias in the SNPs used to calculate IBD state. Furthermore, by analyzing inferred IBD segments greater than 1.5 cM, we minimize background linkage disequilibrium, which affects inference of short shared haplotypes (41). A gradient of shared IBD segments is observed from southern to northern Europe (based on WEA; Fig. 2 and SI Appendix, Table S3). This sharing is highest in the Iberian Peninsula for both North Africa and Sub-Saharan African IBD segments. Interestingly, the Basques are an exception to this pattern because they show similar levels of sharing to other European populations, but inhabit the Iberian Peninsula. Additionally, IBD sharing between North Africa and Europe is nearly an order of magnitude higher than that between Sub-Saharan Africa and Europe, of which a total of 30% of its IBD segments are also shared between North Africa and Europe. Interestingly, these segments represent only 2% of the bulk of IBD segments shared between North Africa and Europe, a proportion similar to that found in previous studies based only on Sub-Saharan populations (9). Considering that only 2% of the segments shared between North Africa and Europe have a Sub-Saharan origin, it is not likely that the gradients observed in Fig. 2B is driven primarily by theSub-Saharan segments. Finally, high correlation (0.83) exists among the values of WEA between Sub-Saharan Africa and Europe, and North Africa and Europe. Overall, these results support the hypothesis that Sub-Saharan gene flow detected in Europe entered with North African gene flow. We regressed the North African–European IBD metric (WEA) on the sine of latitude to evaluate the strength of this gradient and find a significant relationship across southern-to-northern Europe, P = 7.4 × 10⁻⁸ (Fig. 2D). To pinpoint which specific North African regions exchanged migrants with Europe, we calculated WEA between a given European population and each of the seven North African and Near Eastern populations (Fig. 3 and SI Appendix, Table S3). Southwestern European populations, and in particular the Canary Islands, show the highest levels of IBD sharing with northwestern African populations (i.e., the Maghreb: Morocco, Western Sahara, Algeria, and Tunisia), whereas southeastern European populations share more IBD segments with Egypt and the Near East (SI Appendix, Fig. S7). Whereas inferred IBD sharing does not indicate directionality, the North African samples that have highest IBD sharing with Iberian populations also tend to have the lowest proportion of the European cluster in ADMIXTURE (Fig. 1), e.g., Saharawi, Tunisian Berbers, and South Moroccans. For example, the Andalucians share many IBD segments with the Tunisians (Fig. 3), who present extremely minimal levels of European ancestry. This suggests that gene flow occurred from Africa to Europe rather than the other way around. Population-specific estimates of haplotype sharing (in centimorgans) between North Africa and Europe. Estimates of W EA (scaled by 100 for ease of presentation) between each European population (x axis) and each North African population and the Qatari are represented by colors and symbols. A substantial increase in haplotype sharing is detected between southwestern European populations and Maghrebi populations in comparison with the remainder of the European continent. The excess of sharing between the Near East and southern central and Eastern Europe is also noteworthy.  Fig. 3. Population-specific estimates of haplotype sharing (in centimorgans) between North Africa and Europe. Estimates of WEA (scaled by 100 for ease of presentation) between each European population (x axis) and each North African population and the Qatari are represented by colors and symbols. These results also rule out a model where observed sharing between Europe and North Africa is the result of recent gene flow from the Near East into both regions. We compared IBD between Qatari (the best Near Eastern representatives genotyped with the Affymetrix platform currently available, SI Appendix, Fig. S8), Europe, and North Africa. As shown in Fig. 3 and SI Appendix, Fig. S7), southwestern Europe has more IBD segments shared with the Maghreb than Qatar, whereas eastern Mediterranean populations share more segments IBD with the Near East than with western North Africa. On the other hand, northern European populations show only limited IBD sharing with both North Africa and the Near East (Figs. 2C and 3 and SI Appendix, Fig. S7). The southwest-to-northeast gradient of North African IBD sharing (Fig. 2B) and the distinct peak in sharing between Iberia and the Maghreb (Fig. 3) indicate that sharing in southwestern Europe is independent of gene flow from the Near East. It is possible that this sharp peak of North African IBD sharing in Iberia contributes to the apparent isolation of Iberian populations from other Europeans (43). Implications of Gene Flow from North Africa to Europe. Time since admixture estimates. The variance in ancestry assignments for individuals within a population depends on the total ancestry proportions, the timing and duration of gene flow, population structure and/or assortative mating within the population, and errors in assignment (30, 44). We used variance in ancestry proportions across individuals estimated with ADMIXTURE to infer effective admixture times, i.e., the times required to achieve the observed variance in the population given a single gene flow event in a randomly mating population (see model from ref. 30). Focusing on the North African component at k = 6, we found that a migration event from North Africa to Europe would have occurred at least 6–10 generations ago (∼240–300 ya) in Spain, and at least 5–7 generations ago in France and Italy (Fig. 4). The pattern of North African ancestry at k = 7 remains very similar to the pattern at k = 6 with the estimate of admixture time decreasing 1 generation on average for Iberian populations (SI Appendix, Fig. S9). Because population structure, continuous gene flow, assortative mating, and errors in assignments may considerably increase the variance (and thus reduce the effective migration time), we consider these time estimates to be lower bounds: under all of the proposed variance-increasing scenarios, there must be a substantial proportion of migration that has occurred before the effective migration time, possibly much earlier. We additionally compare the estimate variance in ancestry from simulated populations to that predicted by a pulse model of migration. We found that the estimates were consistent with the actual number of generations since migration began, within confidence intervals obtained from bootstrapping over simulations (SI Appendix, Figs. S10 and S11). Additionally, these estimates were robust to imperfect inference of the North African ancestry or source population when the pulse of gene flow occurred less than 15 generations ago.  Fig. 4. Variance in ancestry proportions within populations depends on the overall ancestry proportions in the population and the time of gene flow. Using the proportion of North African ancestry inferred at k = 6 with ADMIXTURE, we estimated the variance in ancestry within each of 11 European populations. Using genome-wide SNP data from over 2,000 individuals, we characterize broad clinal patterns of recent gene flow between Europe and Africa that have a substantial effect on genetic diversity of European populations. We have shown that recent North African ancestry is highest in southwestern Europe and decreases in northern latitudes, with a sharp difference between the Iberian Peninsula and France, where Basques are less influenced by North Africa (as suggested in ref. 48). Our estimates of shared ancestry are much higher than previously reported (up to 20% of the European individuals’ genomes). This increase in inferred African ancestry in Europe is due to our inclusion of seven North African, rather than Sub-Saharan African populations. Specifically, elevated shared African ancestry in Iberia and the Canary Islands can be traced to populations in the North African Maghreb such as Moroccans, Western Saharans, and the Tunisian Berbers. Our results, based on both allele frequencies and long shared haplotypes, support the hypothesis that recent migrations from North Africa contributed substantially to the higher genetic diversity in southwestern Europe. Previous Y chromosome data have highlighted examples of male-biased gene flow from Africa to Europe, such as the eastern African slave ancestry in Yorkshire, England (49) and the legacy of Moors in Iberia (26). Here we show that gene flow from Africa to Europe is not merely reflected on the Y chromosome but corresponds to a much broader effect. The observation that the majority of disease risk alleles in this study follow an expected pattern of neutral drift among populations is consistent with the interpretation that these common alleles are not strongly affected by natural selection. We note that alleles identified in GWASs of individuals of largely northern European descent have limited portability to neighboring populations because the tagged GWAS SNPs may no longer be in linkage disequilibrium with the causative variant. Thus, estimates of genetic risk for these diseases in North Africans are likely inaccurate because North African-specific risk SNPs are missing. With these caveats, we note that one disease, multiple sclerosis, does not conform to a pattern of neutral genetic drift and this raises the hypothesis that natural selection affects the frequency of these risk variants that may also be linked to phenotypes other than MS. Our results show an increased genetic risk for multiple sclerosis in North African populations. West Saharans and North Moroccans carry higher frequencies of MS alleles that deviate from neutral expectations of divergence among European and African populations. Based on our model, we would predict individuals with high North African ancestry living in Europe to have a higher genetic risk for MS (see supporting evidence for North African immigrants in France in ref. 50). However, the Canary Islands, although displaying the highest amount of North African ancestry, have the lowest predicted genetic risk for MS. The complexity of these results serves to emphasize the importance of conducting disease associations in many diverse populations (51). The significant gene flow from North Africa into southern Europe will result in a miscalculation of genetic disease risk in certain European populations, if North African-specific risk variants are not taken into account. PNAS July 16, 2013 110 (29) 11791-11796 |
|


