|
|
Post by Admin on Aug 29, 2023 21:05:38 GMT
Cellular heterogeneity across populations We assessed how immune responses differ across populations by comparing male individuals of African and European ancestries, who were sampled in a single recruitment effort thereby mitigating potential batch effects (Methods). As East Asian donors were recruited independently and present distinct demographic characteristics (Supplementary Table 1), they were excluded from cross-population comparisons. Focusing on cellular proportions, we detected marked population differences in lineage composition, particularly for NK cells (Fig. 2a and Supplementary Table 4a). A subset identified as memory-like NK cells31 constituted 55.2% of the NK compartment in African-descent individuals, but only 12.2% in Europeans (Wilcoxon’s rank-sum test, P < 1.3 × 10⁻¹⁸; Extended Data Fig. 3a,b and Supplementary Fig. 6). African donors also presented higher proportions of CD16+ monocytes32 and memory lymphocyte subsets, such as memory B cells, effector CD4+ T cells and effector memory re-expressing CD45RA (EMRA) CD8+ T cells (Wilcoxon’s rank-sum test, P < 4.7 × 10⁻³). Fig. 2: Cellular composition affects the transcriptional responses to viral stimuli. 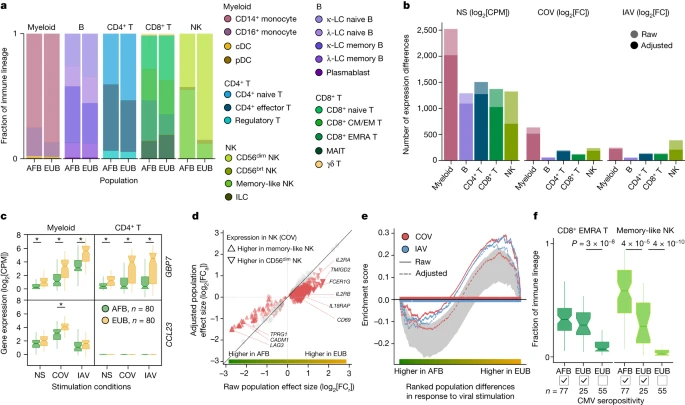 a, Cell type proportions within each immune lineage in Africans (AFB) and Europeans (EUB). brt, bright. b, The number of genes differentially expressed between the African and European groups in the basal state (NS) or in response to SARS-CoV-2 (COV) or IAV, in each immune lineage. Numbers are provided before and after adjustment for cellular composition. c, Examples of popDRGs, either shared across cell types and viruses (GBP7) or specific to SARS-CoV-2-stimulated myeloid cells (CCL23). Statistical analysis was performed using two-sided Student’s t-tests with adjustment using the Benjamini–Hochberg method; *P < 0.001. Exact P values are provided in Supplementary Table 4b. d, The effect of adjusting for cellular composition on genes differentially expressed between populations after exposure to SARS-CoV-2. Adjustment reduces raw population fold-changes (FCa versus FCr) in the expression of genes that are differentially expressed between memory-like NK cells and CD56dim NK cells (red triangles; genes with similar expression are shown in grey). e, The effect of adjusting for cellular composition on population differences in the response to viral stimulation for genes involved in the positive regulation of cell migration (GO:0030335) in the NK lineage. For each stimulus, gene set enrichment analysis enrichment curves are shown before and after adjusting on the basis of cellular composition. Grey shades indicate the 95% expected range for the enrichment curve when gene labels are permuted at random. f, The distribution of CD8+ EMRA T and memory-like NK cell frequencies in Africans and Europeans according to CMV+/− serostatus. P values (P < 0.01) calculated using Wilcoxon’s two-sided rank-sum tests are shown. For c and f, the centre line shows the median; the notches show the 95% confidence intervals (CIs) of the median; the box limits show the upper and lower quartiles; and the whiskers show 1.5× interquartile range. The number (n) of independent biological samples is indicated where relevant. |
|
|
|
Post by Admin on Aug 30, 2023 21:00:03 GMT
Repercussions of CMV infection
We next investigated the sources of population differences in cellular composition. We found no strong genetic effects on cellular proportions (Supplementary Note 3 and Supplementary Table 4e), suggesting a predominantly environmental origin to such population differences. As latent cytomegalovirus (CMV) infection alters cellular proportions33,34,35 and its prevalence varies across populations36, we determined the CMV+/− serostatus of the samples. All but one of the African-descent individuals were CMV+ (99%), versus 31% of Europeans, and CMV+ was associated with higher proportions of memory-like NK and CD8+ EMRA T cells in Europeans (Fig. 2f and Extended Data Fig. 3d). Using mediation analysis, we estimated that CMV serostatus accounts for up to 73% of the differences in the proportion of these cell types between Africans and Europeans; these differences substantially impact the transcriptional response to SARS-CoV-2 (Supplementary Table 4f,g, Supplementary Notes 4 and 5 and Supplementary Fig. 7). However, other than its effects on cellular composition, CMV+ had a limited direct effect on SARS-CoV-2 responses, with only one gene presenting significant expression differences in response to this virus (ERICH3 in CD8+ T cells, log2FC = 1.7, FDR = 0.007; Supplementary Table 4h). These findings highlight how differing environmental exposures, such as CMV infection, may lead to population differences in the responses to SARS-CoV-2 through changes in the lymphoid composition.
Genetic basis of the leukocyte response
To assess the effects of human genetic variants on transcriptional variation, we mapped expression quantitative trait loci (eQTLs) jointly in all three populations, focusing on cis-regulatory variants. At an FDR of 1%, we identified 1,866–4,323 independent eQTLs per lineage, affecting 5,198 genes (Fig. 3a and Supplementary Table 5a). Among the 9,150 eQTLs detected, 11% were ancestry specific (n = 973; Supplementary Note 6), underscoring the importance of including diverse ancestries in genomics research. Increasing the resolution to 22 cell types revealed an additional 3,603 eQTLs (Extended Data Fig. 4a,b and Supplementary Table 5b). We found that 79% of eQTLs were replicated (P < 0.01) in at least three cell types, but only 22% were common to all lineages. In total, 812 eQTLs were cell-type-specific, around 45% of which were detected in myeloid cells (Extended Data Fig. 4b), including a pDC-specific eQTL (rs114273142) at MIR155HG—hosting a micro RNA that promotes sensitivity to type I IFNs37 (Extended Data Fig. 4c and Supplementary Note 7). Broadly, eQTL effect sizes were more correlated across ontogenetically related cell types (mean correlation within and between lineages of r = 0.60 and 0.47, Wilcoxon’s rank-sum test, P = 6.2 × 10⁻⁶; Extended Data Fig. 4d).
|
|
|
|
Post by Admin on Aug 31, 2023 23:04:59 GMT
Fig. 3: Genetic basis of immune responses to RNA viruses. 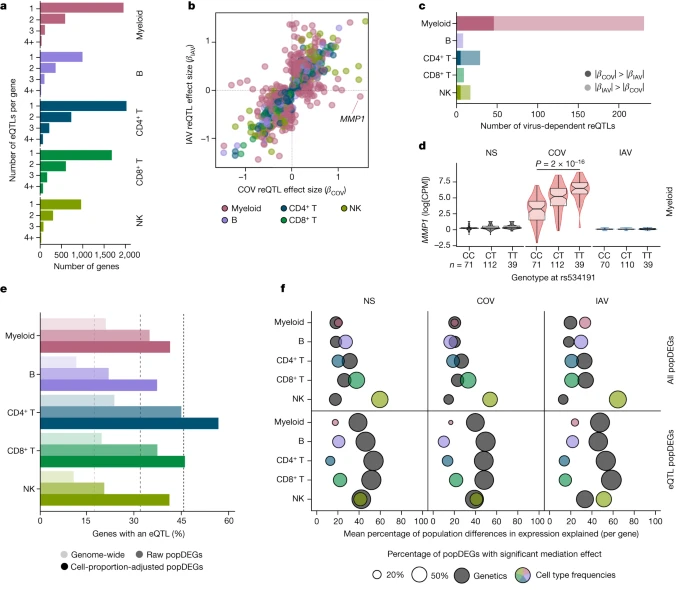 a, The number of eQTLs detected per gene within each immune lineage. b, Comparison of reQTL effect sizes (β) between SARS-CoV-2- and IAV-stimulated cells. Each dot represents a specific reQTL (that is, SNP, gene and lineage) and its colour indicates the lineage in which it was detected. c, The number of virus-dependent reQTLs (two-sided Student’s t-test nominal interaction, P < 0.01) in each immune lineage, coloured according to the lineage and the stimulus for which the reQTL has the largest effect size. d, Example of a SARS-CoV-2-specific reQTL at MMP1. P values (P < 0.01) calculated using Student’s two-sided t-tests are shown. The centre line shows the median; the notches show the 95% CIs of the median; the box limits show the upper and lower quartiles; the whiskers show 1.5× interquartile range; and the points show outliers. e, Enrichment in eQTLs among genes that are differentially expressed between populations (popDEGs). For each immune lineage, the bars indicate the percentage of genes with a significant eQTL, at the genome-wide scale and among popDEGs, before or after adjustment for cellular composition. f, For each lineage and stimulus, the x axis indicates the mean contribution of either genetics (that is, the most significant eQTL per gene in each lineage and stimulus) or cellular composition to population differences in expression, across all popDEGs (top) or popDEGs associated with an eQTL (bottom). The size of the dots reflects the percentage of genes with a significant mediated effect at an FDR of 1% (Supplementary Table 6). The number (n) of independent biological samples is indicated where relevant. Focusing on variants that altered responses to viral stimuli (reQTLs), we identified 1,505 reQTLs affecting 1,213 genes (Supplementary Table 5c,d). Supporting the replicability of the results, our IAV reQTLs are enriched in genes that are reported to contain IAV-specific eQTLs19 (OR > 3.2, Fisher’s exact test, P < 9.4 × 10⁻⁴), with more than 98% of replicated eQTLs affecting expression in the same direction (Supplementary Note 8, Supplementary Fig. 8 and Supplementary Table 5e). The correlation of reQTL effect sizes across ontogenetically related cell types was weaker than for eQTLs (r = 0.36 and 0.50, respectively, Wilcoxon’s rank-sum test, P < 5.6 × 10⁻¹³; Extended Data Fig. 4d). Furthermore, the proportion of virus-dependent reQTLs differed across cell types. In lymphoid cells, only 7.7% of reQTLs differed in effect size between viruses (interaction P < 0.01; Fig. 3b,c), whereas 49% of myeloid reQTLs were virus dependent (interaction P < 0.01), with 46 and 185 reQTLs displaying specific, stronger effects after SARS-CoV-2 and IAV stimulation, respectively. The strongest SARS-CoV-2 reQTL (rs534191, Student’s t-test, P = 1.96 × 10⁻¹⁶ (SARS-CoV-2) and P = 0.05 (IAV); Fig. 3d) was identified in myeloid cells at MMP1, encoding a biomarker of COVID-19 severity38. These analyses reveal that the effects of virus-induced reQTLs are cell-type dependent and highlight the virus specificity of the genetic basis of the myeloid response. |
|
|
|
Post by Admin on Sept 1, 2023 20:26:15 GMT
Ancestry effects on immune responses
To evaluate the contribution of genetic variation to population differences in immune responses, we focused on popDEGs and popDRGs. We found that 11–24% of the genes expressed in each lineage had at least one eQTL, but this proportion increased up to 56% and 60% for popDEGs and popDRGs that were not explained by cellular heterogeneity, respectively (Fisher’s exact test, P < 1.4 × 10⁻⁶; Fig. 3e and Extended Data Fig. 5a). The popDEGs and popDRGs displaying the largest population differences were more likely to be under genetic control and associated with large-effect (r)eQTLs (Extended Data Fig. 5b–d). We used mediation analysis to assess, for each gene, immune lineage and virus, the fraction of population differences explained by genetics (that is, the most significant eQTL) or cellular heterogeneity (Supplementary Table 6 and Supplementary Note 9). Cellular composition had a broad effect on population differences in gene expression and viral responses (explaining 16–62% of differences per lineage and virus, with the strongest effect in NK cells), whereas genetics had a weaker effect (explaining 13–35% of population differences; Fig. 3f and Extended Data Fig. 5e). However, genetics had strong effects on a gene subset (141–433 genes per lineage) for which they accounted for 32–58% of population differences. For example, 81–100% of the differences in GBP7 expression between Africans and Europeans were explained by a single variant displaying strong population differentiation (rs1142888, derived allele frequency (DAF) = 0.13 and 0.53 in Africans and Europeans, respectively, fixation index (FST) = 0.26, |βeQTL| > 1.7 across lineages after stimulation). Thus, population variation in immune responses is driven largely by cellular heterogeneity, but genetic variants with marked allele frequency variation contribute to population differences at specific loci.
Natural selection and SARS-CoV-2 responses
To investigate the contribution of natural selection to population differences in immune responses, we first searched for overlaps between (r)eQTLs and genome-wide signals of local adaptation, measured by the population branch statistic (PBS)39. We identified 1,616 eQTLs (1,215 genes) and 180 reQTLs (166 genes) displaying strong population differentiation (empirical P < 0.01), 90 of which were ancestry specific (Supplementary Table 7a and Supplementary Note 6). Among genes harbouring putatively adaptive (r)eQTLs, we found key players in IFN-mediated antiviral immunity, such as DHX58 and TRIM14 in Africans, ISG20, IFIT5, BST2 and IFITM2-3 in Europeans, and IFI44L and IFITM2 in East Asians.
We then used CLUES40 to identify rapid changes in (r)eQTL frequency over the last 2,000 generations (that is, 56,000 years) in each population (Supplementary Fig. 9 and Supplementary Table 7b). We found signals of rapid adaptation (maximum |Z| > 3) targeting the same (IFITM2, IFIT5) or different (ISG20, IFITM3, TRIM14) eQTLs at highly differentiated genes, suggesting repeated adaptations targeting IFN-mediated antiviral immunity (Supplementary Note 10, Supplementary Table 7c and Supplementary Fig. 10). We determined whether selection had altered gene expression in specific cell types or in response to SARS-CoV-2 or IAV by testing for increased population differentiation (PBS) at (r)eQTLs within each cell type, relative to random single-nucleotide polymorphisms (SNPs) matched for allele frequency, linkage disequilibrium (LD) and distance to the nearest gene. In the basal state, eQTLs were more strongly differentiated in Europeans, the strongest signal observed for γδ T cells (Extended Data Fig. 6a). Among popDEGs for which genetics mediates more than 50% of the differences between Africans and Europeans, 34% presented signals of rapid adaptation in Europeans (versus 21% in Africans, Fisher’s exact test, P = 7.7 × 10⁻⁶). For example, population differences at GBP7 have been driven by a frequency increase, over the last 782–1,272 generations, of the rs1142888-G allele in Europeans (maximum |Z| > 4.3, Extended Data Fig. 6b).
Focusing on responses to viruses, SARS-CoV-2 reQTLs displayed increased population differentiation in East Asians (FE = 1.24, one-sided resampling, P < 2 × 10⁻⁴; Extended Data Fig. 6c) and were enriched in East-Asian-specific variants (OR > 4.2, Fisher’s exact test, P < 2.3 × 10⁻⁶; Supplementary Note 6 and Supplementary Table 7d). Furthermore, among SARS-CoV-2-specific reQTLs, 28 reQTLs (5.3%) displayed signals of adaptation in East Asians starting 770–970 generations ago (around 25,000 years)—a timeframe associated with genetic adaptation at SARS-CoV-2-interacting proteins23 (OR relative to other populations = 2.6, Fisher’s exact test, P = 7.3 × 10⁻⁴; Fig. 4a and Extended Data Fig. 7a–c). An example is the immune mediator LILRB1, which has a SARS-CoV-2-specific reQTL (rs4806787) in pDCs (Extended Data Fig. 7d). However, the selection events making the largest contribution to the differentiation of SARS-CoV-2 responses in East Asia (top 5% PBS) began before this period (more than 970 generations ago, OR = 1.94, Fisher’s exact test, P = 0.019; Fig. 4b). For example, the rs1028396-T allele (80% frequency in East Asia versus 16–25% elsewhere), associated with a weaker response of SIRPA to SARS-CoV-2 in CD14+ monocytes, presents a selection signal beginning more than 45,000 years ago (Fig. 4b and Extended Data Fig. 7e). SIRPα inhibits infection by endocytic viruses, including SARS-CoV-241. These results suggest recurrent genetic adaptation targeting antiviral immunity over the last 50,000 years, contributing to present-day population differences in immune responses to SARS-CoV-2.
|
|
|
|
Post by Admin on Sept 2, 2023 20:44:27 GMT
Fig. 4: Natural selection effects on population differentiation of immune responses. 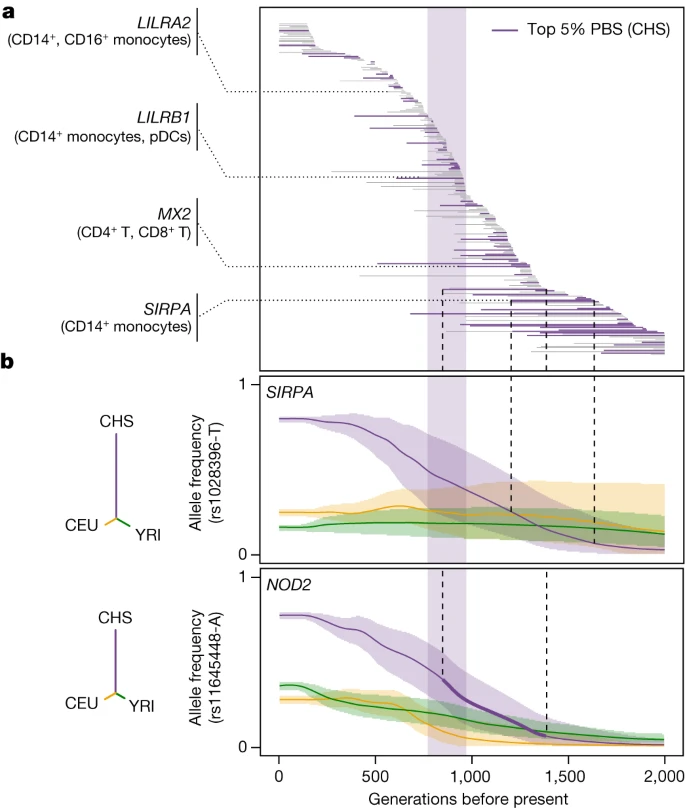 a, Estimated periods of selection, over the past 2,000 generations, for 245 SARS-CoV-2 reQTLs with significant signals of rapid adaptation in East Asians (CHS) (maximum |Z| > 3). Each horizontal line represents a variant, sorted in descending order of time to onset of selection. The area shaded in purple highlights the period (770–970 generations ago) associated with genetic adaptation at host coronavirus-interacting proteins in East Asians23. Several immunity-related genes are highlighted. b, Allele frequency trajectories of two SARS-CoV-2 reQTLs (rs1028396 at SIRPA and rs11645448 at NOD2) in Africans (YRI, green), Europeans (CEU, yellow) and East Asians (CHS, purple). The full lines indicate the maximum a posteriori estimate of allele frequency at each epoch and shaded areas indicate the 95% CIs. The dendrograms show the estimated unrooted population phylogeny for each eQTL based on PBS (that is, the branch length between each pair of populations is proportional to −log10[1 − FST]). Neanderthal heritage on immune functions We investigated the effects of Neanderthal introgression on immune responses to viruses by defining 100,345 ‘archaic’ variants (aSNPs) and testing for biased eQTL representation among aSNPs relative to random, matched SNPs (Methods). We found that archaic haplotypes were 1.4–1.5 times more likely to alter gene expression in the basal state (one-sided permutation test, P = 3 × 10⁻⁴) and after stimulation with SARS-CoV-2 or IAV (one-sided permutation test, P = 9 × 10⁻⁴ and 3 × 10⁻³, respectively) in Europeans, and this trend was only marginally significant in East Asians after viral stimulation (FE > 1.2, one-sided permutation test, P < 2 × 10⁻²; Extended Data Fig. 8a and Supplementary Table 8a–c). Enrichment was strongest in SARS-CoV-2-stimulated CD16+ monocytes from Europeans, suggesting that archaic haplotypes altering myeloid responses have been preferentially retained in their genomes. Archaic haplotypes with eQTLs are generally present at higher frequencies compared with archaic haplotypes without eQTLs (Δf(introgressed allele) >3.2%, Student’s t-test, Padj < 8 × 10⁻³; Extended Data Fig. 8b and Supplementary Table 8d,e), even after adjustment for minor allele frequency (MAF) to ensure similar power for eQTL detection, supporting the adaptive nature of Neanderthal regulatory alleles. To characterize the functional consequences of archaic introgression at the cell-type level, we focused on introgressed eQTLs for which the archaic allele was found at its highest frequency in Eurasians (that is, 5% most frequent). These included known adaptively introgressed variants at OAS1-3 or PNMA1 in Europeans and TLR1, FANCA or IL10RA in East Asians18,42,43,44,45,46, for which we delineated the cellular and molecular effects (Extended Data Figs. 8c and 9a and Supplementary Table 8f). Yet, we identified previously unreported signals of Neanderthal introgression affecting immunity phenotypes. For example, an introgressed reQTL (rs58964929-A, 38% of Europeans versus 22% of East Asians) decreases UBE2F responses to SARS-CoV-2 and IAV in monocytes (Extended Data Fig. 9b). UBE2F is involved in neddylation, a post-translational modification that is required for the nuclear translocation of IRF7 by myeloid cells after RNA virus infection and, therefore, for the induction of type I IFN responses47. Likewise, an introgressed eQTL (rs11119346-T, 43% in East Asians versus less than 3% in Europeans) downregulates TRAF3IP3—a negative regulator of the cytosolic RNA-induced IFN response48—in IAV-infected monocytes, thereby favouring IFN release after viral infection (Extended Data Fig. 9c,d). We also identified a 35.5 kb Neanderthal haplotype reaching 61% frequency in East Asians (versus 24% in Europeans, tagged by rs9520848-C allele) that is associated with higher basal expression of the cytokine gene TNFSF13B by MAIT cells (Extended Data Fig. 9e,f). Collectively, these results reveal how archaic introgression has altered immune functions in present-day Eurasians at the molecular and cellular level. |
|

