|
|
Post by Admin on Aug 14, 2023 17:50:22 GMT
 Research led by the Université Paris Cité, CNRS, France, has investigated factors driving variability in diverse immune responses to SARS-CoV-2. In a paper, "Dissecting human population variation in single-cell responses to SARS-CoV-2," the team used single-cell RNA sequencing to analyze blood cells from diverse populations, comparing responses to SARS-CoV-2 against factors like genetics, age, sex, and comorbidities. The study investigated immune responses to SARS-CoV-2 and the factors that could contribute to population differences in responses. With 222 healthy blood donors from different geographical regions and ancestries, researchers performed single-cell RNA sequencing on peripheral blood mononuclear cells to analyze their transcriptional responses to SARS-CoV-2 and influenza A virus exposure. The findings reveal that SARS-CoV-2 induces weaker but more varied interferon-stimulated gene activity than the influenza A virus and has a unique pro-inflammatory signature in myeloid cells. The findings, published in Nature, also illustrate that variability in population genetics, demographics and environment could explain why susceptibility to SARS-CoV-2 is not uniform. Age Older individuals generally exhibited weaker immune responses, which likely contributed to increased susceptibility and severity of COVID-19. Comorbidities Individuals with underlying health conditions showed altered immune responses, potentially leading to higher susceptibility and poorer outcomes. Immune cell type composition The study points out how proportions of memory cells in lymphoid lineages differ in individuals of African, European, and East Asian descent, potentially contributing to population disparities in cellular activation states. For instance, African donors presented higher proportions of CD16+ monocytes and memory lymphocyte subsets, such as memory B cells and effector CD4+ T cells. Environmental exposures Past viral encounters, such as cytomegalovirus (CMV) infection, were seen to illicit differences in immune responses among different populations. As an environmental factor, exposure to a virus can be a local or regional occurrence. Without knowledge of these exposures, immune response differences could be correlated to ancestry. The authors warn that this could lead to overestimating the effects of genetic ancestry on immune response variation. For example, the team found that past CMV exposure accounts for up to 73% of the differences in immune cell proportions between African and European donors. These cell type compositions can impact transcriptional responses to SARS-CoV-2 but are environmental, not genetic in origin. Genetic factors Analysis revealed that genetics had a range of response effects on different cell types and immune responses. Common genetic variants can contribute to variations in immune response, but these effects are more pronounced in specific genes that show strong population differentiation. An example is the rs1142888-G allele, which leads to higher expression of GBP7 in Europeans. This genetic difference likely arose due to positive selection in Europe thousands of years ago that could have been caused by past environmental exposure to pathogens. Specific genetic variants that are associated with COVID-19 risk, in genes like IRF1, IFNAR2, and DR1, all influence type I interferon signaling, indicating the importance of efficient interferon signaling for favorable clinical outcomes. Neanderthals Past comingling and introgression of archaic human genes have contributed to present-day immune responses to SARS-CoV-2. Known Neanderthal genes have been retained in both European and East Asian populations that are specifically related to countering viral threats. The researchers also identified previously unreported signals of Neanderthal introgression affecting immunity phenotypes. For example, a gene variant that decreases post-translational modification responses to SARS-CoV-2 and IA was found in 38% of Europeans and 22% of East Asians. Another introgressed variant found in 43% of East Asians and less than 3% of Europeans downregulates a negative regulator of the cytosolic RNA-induced IFN response allowing more interferon release to counter the viral infection. A Neanderthal haplotype reaching 61% frequency in East Asians and 24% in Europeans, tagged by rs9520848-C allele, is associated with higher basal expression of the cytokine gene TNFSF13B by a subset of T cells. A Neanderthal genetic variant containing the rs2177336-T allele increases MUC20 expression in SARS-CoV-2-stimulated respiratory cells, particularly for CD4+ T cells. This was linked to decreased COVID-19 susceptibility in Eurasians. The conserved nature of these archaic introgressions illustrates the deep history of pathogenic viruses testing human immune systems throughout evolution. While science and technology have created distinctly modern strategies to combat viral infections, there may be clues for applying that technology in the evolutionary and introgressively conserved genes. Insights The single-cell approach used in the study captured the complexity of immune responses across individuals and populations, revealing the interplay between environmental, genetic, and evolutionary factors. Importantly the study unentangles the correlations between ancestry and recent environmental influences and illustrates how the environmental factors of the past influence inherited genetics. With these factors elucidated, we can see how the immune system responds to an immediate novel threat and how it builds and maintains these responses over evolutionary time scales. More information: Yann Aquino et al, Dissecting human population variation in single-cell responses to SARS-CoV-2, Nature (2023). DOI: 10.1038/s41586-023-06422-9 www.nature.com/articles/s41586-023-06422-9 |
|
|
|
Post by Admin on Aug 15, 2023 18:54:59 GMT
Dissecting human population variation in single-cell responses to SARS-CoV-2
Abstract
Humans display substantial interindividual clinical variability after SARS-CoV-2 infection1,2,3, the genetic and immunological basis of which has begun to be deciphered4. However, the extent and drivers of population differences in immune responses to SARS-CoV-2 remain unclear. Here we report single-cell RNA-sequencing data for peripheral blood mononuclear cells—from 222 healthy donors of diverse ancestries—that were stimulated with SARS-CoV-2 or influenza A virus. We show that SARS-CoV-2 induces weaker, but more heterogeneous, interferon-stimulated gene activity compared with influenza A virus, and a unique pro-inflammatory signature in myeloid cells. Transcriptional responses to viruses display marked population differences, primarily driven by changes in cell abundance including increased lymphoid differentiation associated with latent cytomegalovirus infection. Expression quantitative trait loci and mediation analyses reveal a broad effect of cell composition on population disparities in immune responses, with genetic variants exerting a strong effect on specific loci. Furthermore, we show that natural selection has increased population differences in immune responses, particularly for variants associated with SARS-CoV-2 response in East Asians, and document the cellular and molecular mechanisms by which Neanderthal introgression has altered immune functions, such as the response of myeloid cells to viruses. Finally, colocalization and transcriptome-wide association analyses reveal an overlap between the genetic basis of immune responses to SARS-CoV-2 and COVID-19 severity, providing insights into the factors contributing to current disparities in COVID-19 risk.
Main
A notable feature of the COVID-19 pandemic is the substantial clinical variation among individuals infected with SARS-CoV-2, ranging from asymptomatic infection to fatal disease1,2,3. Risk factors include advanced age1 as well as male sex5, comorbidities6 and host genetics4,7,8. Furthermore, variation in innate immunity9,10,11—including inborn errors or neutralizing auto-antibodies against type I interferons12,13,14—contribute to variation in clinical outcome, and epidemiological and genetic data suggest differences between populations6,7,15,16. This, together with reports of ancestry-related differences in transcriptional responses to immune challenges17,18,19, calls for investigations of the magnitude and drivers of variation in immune responses to SARS-CoV-2 across populations worldwide.
Pathogen-imposed selection pressures have been paramount during human evolution20. Human adaptation to RNA viruses, through selective sweeps or archaic admixture, has been identified as a source of population genetic differentiation18,21,22 and adaptation signals have been reported at coronavirus-interacting proteins in East Asians23,24. There is also evidence for links between archaic introgression and immunity25, with Neanderthal haplotypes associated with COVID-19 severity26,27. However, the effects of natural selection and archaic admixture on immune responses to SARS-CoV-2 remain to be investigated.
We addressed these questions by exposing peripheral blood mononuclear cells (PBMCs) from individuals of Central African, West European and East Asian descent to SARS-CoV-2 and, for comparison, to influenza A virus (IAV). By combining single-cell RNA-sequencing (scRNA-seq) with quantitative and population genetics approaches, we delineate environmental and genetic drivers of population differences in immune responses to SARS-CoV-2.
|
|
|
|
Post by Admin on Aug 16, 2023 18:57:20 GMT
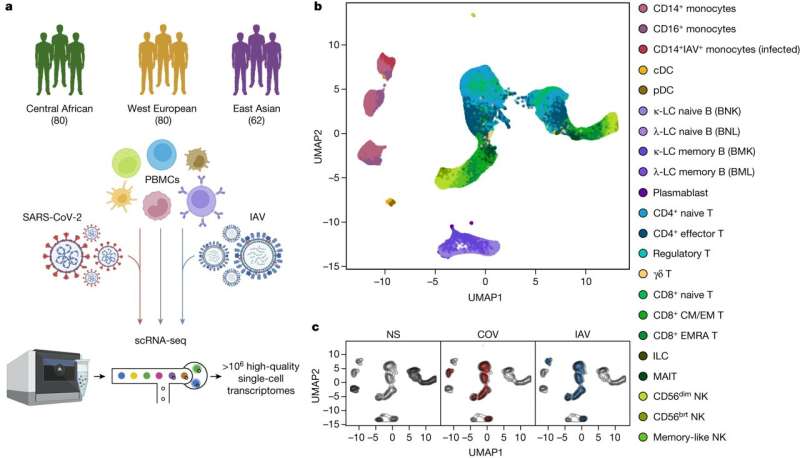
Single-cell responses to RNA viruses We characterized transcriptional responses to SARS-CoV-2 and IAV by performing scRNA-seq analysis of PBMCs from 222 SARS-CoV-2-naive donors originating from three geographical locations (Central Africa, n = 80 male; West Europe, n = 80 male; East Asia, n = 36 female and 26 male) and with different genetic ancestries (Supplementary Fig. 1 and Supplementary Table 1). PBMCs were treated for 6 h (Supplementary Note 1, Supplementary Fig. 2 and Supplementary Table 2) with a mock-control (non-stimulated), SARS-CoV-2 (ancestral strain, BetaCoV/France/GE1973/2020) or IAV (H1N1/PR/8/1934). We captured over 1 million high-quality single-cell transcriptomes (Fig. 1a, Supplementary Fig. 3 and Supplementary Table 3a). By combining transcriptome-based clusters with cellular indexing of transcriptomes and epitopes by sequencing (CITE-seq; Methods), we defined 22 cell types across myeloid, B, CD4+ T, CD8+ T and natural killer (NK) immune lineages (Fig. 1b, Supplementary Fig. 4 and Supplementary Table 3b–d). After virus exposure, most cell types showed moderate changes in abundance, with the strongest changes observed in the myeloid lineage after IAV treatment (Supplementary Note 2 and Supplementary Table 3e). Fig. 1: Population single-cell responses to SARS-CoV-2 and IAV. 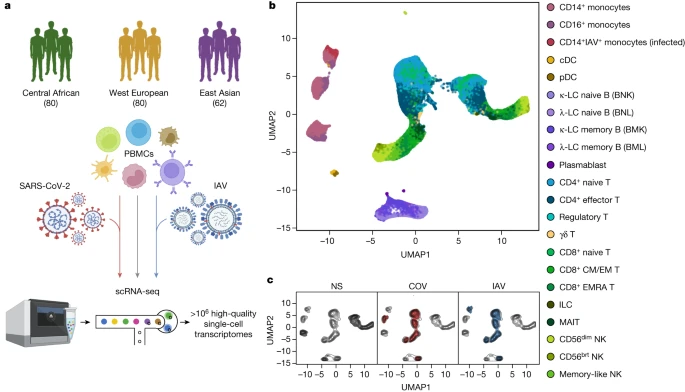 a, The study design. The diagram was created using BioRender. b,c, Uniform manifold approximation and projection (UMAP) embedding of 1,047,824 PBMCs: resting (non-stimulated; NS) or stimulated with SARS-CoV-2 (COV) or IAV for 6 h. b, The colours indicate the 22 cell types inferred. c, The distribution of cells in the NS, COV and IAV conditions on UMAP coordinates. The contour plot indicates the overall density of cells, and the coloured areas delineate regions of high cell density in each condition (NS (grey), COV (red) and IAV (blue)). After adjusting for technical factors (Methods and Supplementary Fig. 5), we found that lineage identity was the main driver of gene expression variation (around 32%), followed by virus exposure (around 27%) (Fig. 1b,c). Both viruses induced a strong transcriptional response, with 2,914 genes upregulated (false-discovery rate (FDR) < 0.01, log2[FC] > 0.5; out of 12,655 with detectable expression; Supplementary Table 3f). These responses were highly correlated across lineages and featured a strong induction of interferon-stimulated genes (ISGs) (Extended Data Fig. 1a). However, myeloid responses were markedly heterogeneous, with SARS-CoV-2 inducing a transcriptional network enriched in inflammatory-response genes (Gene Ontology (GO): 0006954; fold-enrichment (FE) = 3.4, FDR < 4.9 × 10⁻⁸; Supplementary Table 3g). For example, IL1A, IL1B and CXCL8 were highly and specifically upregulated in response to SARS-CoV-2 (log2[FC] > 2.8, FDR < 2.3 × 10−36), consistent with in vitro and in vivo studies28,29. To assess interindividual variability in the response to viruses, we summarized each individual’s response as a function of their mean ISG expression (Supplementary Table 3h). SARS-CoV-2 induced more variable ISG activity than IAV across lineages30, with myeloid cells displaying the strongest differences (Levene test, P < 6.2 × 10⁻⁶; Extended Data Fig. 1b). We determined the contributions of the various interferons (IFNs) to variation of ISG activity using single-molecule arrays (SIMOA) to quantify the levels of secreted IFNα, IFNβ and IFNγ. In the SARS-CoV-2 condition, IFNα accounted for up to 57% of ISG variability (Extended Data Fig. 2a,b), consistent with its determinant role in COVID-19 pathogenesis13. IFNA1-21 transcripts were mostly produced by infected CD14+ monocytes and plasmacytoid dendritic cells (pDCs) after IAV stimulation, whereas pDCs were the only important source of IFNA1-21 after SARS-CoV-2 stimulation (that is, producing 88% of transcripts; Extended Data Fig. 2c). IFNA1-21 expression by pDCs was weaker after stimulation with SARS-CoV-2 (log2[FC] = 6.4 versus 12.5 for IAV, Wilcoxon’s rank-sum test, P = 1.2 × 10⁻¹⁶). Nevertheless, patterns of interindividual variability for ISG activity were notably similar after virus treatment (r = 0.60, Pearson’s P < 1.2 × 10⁻²²; Extended Data Fig. 2d), indicating that the IFN-driven response is largely shared between SARS-CoV-2 and IAV. |
|
|
|
Post by Admin on Aug 17, 2023 20:06:08 GMT
Cellular heterogeneity across populations We assessed how immune responses differ across populations by comparing male individuals of African and European ancestries, who were sampled in a single recruitment effort thereby mitigating potential batch effects (Methods). As East Asian donors were recruited independently and present distinct demographic characteristics (Supplementary Table 1), they were excluded from cross-population comparisons. Focusing on cellular proportions, we detected marked population differences in lineage composition, particularly for NK cells (Fig. 2a and Supplementary Table 4a). A subset identified as memory-like NK cells31 constituted 55.2% of the NK compartment in African-descent individuals, but only 12.2% in Europeans (Wilcoxon’s rank-sum test, P < 1.3 × 10⁻¹⁸; Extended Data Fig. 3a,b and Supplementary Fig. 6). African donors also presented higher proportions of CD16+ monocytes32 and memory lymphocyte subsets, such as memory B cells, effector CD4+ T cells and effector memory re-expressing CD45RA (EMRA) CD8+ T cells (Wilcoxon’s rank-sum test, P < 4.7 × 10⁻³). Fig. 2: Cellular composition affects the transcriptional responses to viral stimuli. 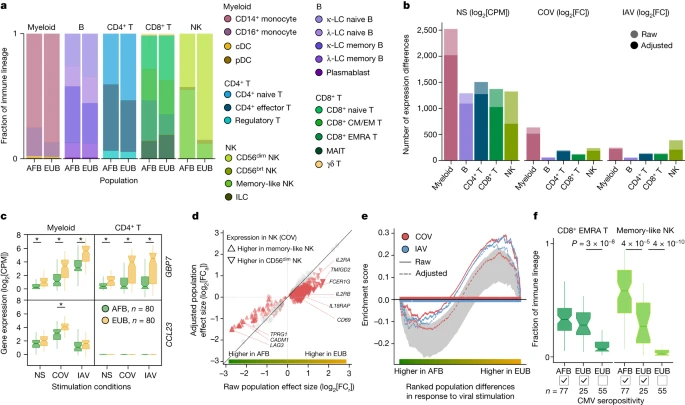 a, Cell type proportions within each immune lineage in Africans (AFB) and Europeans (EUB). brt, bright. b, The number of genes differentially expressed between the African and European groups in the basal state (NS) or in response to SARS-CoV-2 (COV) or IAV, in each immune lineage. Numbers are provided before and after adjustment for cellular composition. c, Examples of popDRGs, either shared across cell types and viruses (GBP7) or specific to SARS-CoV-2-stimulated myeloid cells (CCL23). Statistical analysis was performed using two-sided Student’s t-tests with adjustment using the Benjamini–Hochberg method; *P < 0.001. Exact P values are provided in Supplementary Table 4b. d, The effect of adjusting for cellular composition on genes differentially expressed between populations after exposure to SARS-CoV-2. Adjustment reduces raw population fold-changes (FCa versus FCr) in the expression of genes that are differentially expressed between memory-like NK cells and CD56dim NK cells (red triangles; genes with similar expression are shown in grey). e, The effect of adjusting for cellular composition on population differences in the response to viral stimulation for genes involved in the positive regulation of cell migration (GO:0030335) in the NK lineage. For each stimulus, gene set enrichment analysis enrichment curves are shown before and after adjusting on the basis of cellular composition. Grey shades indicate the 95% expected range for the enrichment curve when gene labels are permuted at random. f, The distribution of CD8+ EMRA T and memory-like NK cell frequencies in Africans and Europeans according to CMV+/− serostatus. P values (P < 0.01) calculated using Wilcoxon’s two-sided rank-sum tests are shown. For c and f, the centre line shows the median; the notches show the 95% confidence intervals (CIs) of the median; the box limits show the upper and lower quartiles; and the whiskers show 1.5× interquartile range. The number (n) of independent biological samples is indicated where relevant. Across lineages, we found 3,389 genes displaying population differences in expression in the basal state (popDEGs; FDR < 0.01, |log2[fold change (FC)]| > 0.2) and 898 and 652 displaying differential responses between populations (popDRGs; FDR < 0.01, |log2[FC]| > 0.2) after stimulation with SARS-CoV-2 and IAV, respectively (Fig. 2b and Supplementary Table 4b,c). popDRGs included key immunity regulators, such as the IFN-responsive GBP7 and the gene coding for the macrophage inflammatory protein MIP-3, CCL23, both of which were more strongly upregulated in Europeans (Fig. 2c). The GBP7 response was common to both viruses and all lineages (log2[FC] > 0.88, Student’s t-test, adjusted P (Padj) < 1.4 × 10⁻³), but that of CCL23 was specific to SARS-CoV-2-stimulated myeloid cells (log2[FC] = 0.72, Student’s t-test, Padj = 5.3 × 10⁻⁴). We estimated that population differences in cellular composition accounted for 15–47% of popDEGs and for 7–46% of popDRGs, with the strongest impact on NK cells (Fig. 2b,d and Extended Data Fig. 3c). Variation in cellular composition mediated pathway-level differences in response to viral stimulation between populations (Supplementary Table 4d). For example, in virus-stimulated NK cells, genes involved in the promotion of cell migration, such as CSF1 or CXCL10, were more strongly induced in Europeans (normalized enrichment score > 1.5, gene set enrichment analysis, Padj < 0.009). However, the loss of this signal after adjustment for cellular composition (Fig. 2e) indicates that fine-scale cellular heterogeneity drives population differences in immune responses to SARS-CoV-2. |
|
|
|
Post by Admin on Aug 18, 2023 19:26:12 GMT
Repercussions of CMV infection We next investigated the sources of population differences in cellular composition. We found no strong genetic effects on cellular proportions (Supplementary Note 3 and Supplementary Table 4e), suggesting a predominantly environmental origin to such population differences. As latent cytomegalovirus (CMV) infection alters cellular proportions33,34,35 and its prevalence varies across populations36, we determined the CMV+/− serostatus of the samples. All but one of the African-descent individuals were CMV+ (99%), versus 31% of Europeans, and CMV+ was associated with higher proportions of memory-like NK and CD8+ EMRA T cells in Europeans (Fig. 2f and Extended Data Fig. 3d). Using mediation analysis, we estimated that CMV serostatus accounts for up to 73% of the differences in the proportion of these cell types between Africans and Europeans; these differences substantially impact the transcriptional response to SARS-CoV-2 (Supplementary Table 4f,g, Supplementary Notes 4 and 5 and Supplementary Fig. 7). However, other than its effects on cellular composition, CMV+ had a limited direct effect on SARS-CoV-2 responses, with only one gene presenting significant expression differences in response to this virus (ERICH3 in CD8+ T cells, log2FC = 1.7, FDR = 0.007; Supplementary Table 4h). These findings highlight how differing environmental exposures, such as CMV infection, may lead to population differences in the responses to SARS-CoV-2 through changes in the lymphoid composition. Genetic basis of the leukocyte response To assess the effects of human genetic variants on transcriptional variation, we mapped expression quantitative trait loci (eQTLs) jointly in all three populations, focusing on cis-regulatory variants. At an FDR of 1%, we identified 1,866–4,323 independent eQTLs per lineage, affecting 5,198 genes (Fig. 3a and Supplementary Table 5a). Among the 9,150 eQTLs detected, 11% were ancestry specific (n = 973; Supplementary Note 6), underscoring the importance of including diverse ancestries in genomics research. Increasing the resolution to 22 cell types revealed an additional 3,603 eQTLs (Extended Data Fig. 4a,b and Supplementary Table 5b). We found that 79% of eQTLs were replicated (P < 0.01) in at least three cell types, but only 22% were common to all lineages. In total, 812 eQTLs were cell-type-specific, around 45% of which were detected in myeloid cells (Extended Data Fig. 4b), including a pDC-specific eQTL (rs114273142) at MIR155HG—hosting a micro RNA that promotes sensitivity to type I IFNs37 (Extended Data Fig. 4c and Supplementary Note 7). Broadly, eQTL effect sizes were more correlated across ontogenetically related cell types (mean correlation within and between lineages of r = 0.60 and 0.47, Wilcoxon’s rank-sum test, P = 6.2 × 10⁻⁶; Extended Data Fig. 4d). Fig. 3: Genetic basis of immune responses to RNA viruses. 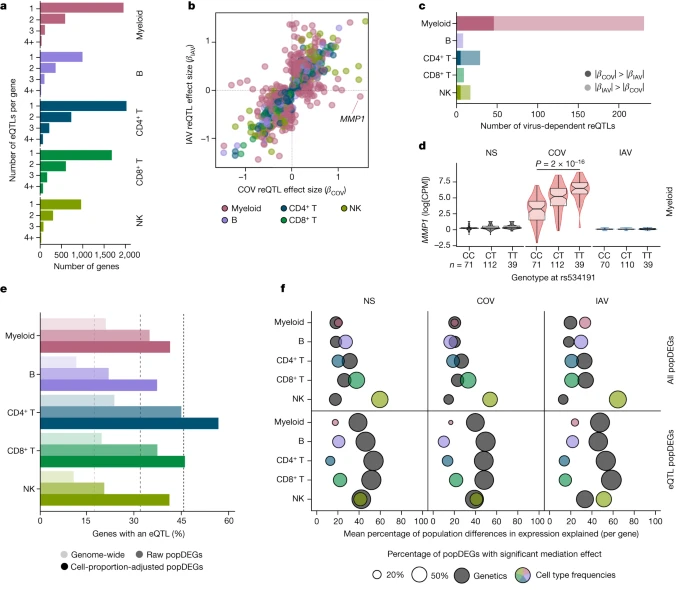 a, The number of eQTLs detected per gene within each immune lineage. b, Comparison of reQTL effect sizes (β) between SARS-CoV-2- and IAV-stimulated cells. Each dot represents a specific reQTL (that is, SNP, gene and lineage) and its colour indicates the lineage in which it was detected. c, The number of virus-dependent reQTLs (two-sided Student’s t-test nominal interaction, P < 0.01) in each immune lineage, coloured according to the lineage and the stimulus for which the reQTL has the largest effect size. d, Example of a SARS-CoV-2-specific reQTL at MMP1. P values (P < 0.01) calculated using Student’s two-sided t-tests are shown. The centre line shows the median; the notches show the 95% CIs of the median; the box limits show the upper and lower quartiles; the whiskers show 1.5× interquartile range; and the points show outliers. e, Enrichment in eQTLs among genes that are differentially expressed between populations (popDEGs). For each immune lineage, the bars indicate the percentage of genes with a significant eQTL, at the genome-wide scale and among popDEGs, before or after adjustment for cellular composition. f, For each lineage and stimulus, the x axis indicates the mean contribution of either genetics (that is, the most significant eQTL per gene in each lineage and stimulus) or cellular composition to population differences in expression, across all popDEGs (top) or popDEGs associated with an eQTL (bottom). The size of the dots reflects the percentage of genes with a significant mediated effect at an FDR of 1% (Supplementary Table 6). The number (n) of independent biological samples is indicated where relevant. Focusing on variants that altered responses to viral stimuli (reQTLs), we identified 1,505 reQTLs affecting 1,213 genes (Supplementary Table 5c,d). Supporting the replicability of the results, our IAV reQTLs are enriched in genes that are reported to contain IAV-specific eQTLs19 (OR > 3.2, Fisher’s exact test, P < 9.4 × 10⁻⁴), with more than 98% of replicated eQTLs affecting expression in the same direction (Supplementary Note 8, Supplementary Fig. 8 and Supplementary Table 5e). The correlation of reQTL effect sizes across ontogenetically related cell types was weaker than for eQTLs (r = 0.36 and 0.50, respectively, Wilcoxon’s rank-sum test, P < 5.6 × 10⁻¹³; Extended Data Fig. 4d). Furthermore, the proportion of virus-dependent reQTLs differed across cell types. In lymphoid cells, only 7.7% of reQTLs differed in effect size between viruses (interaction P < 0.01; Fig. 3b,c), whereas 49% of myeloid reQTLs were virus dependent (interaction P < 0.01), with 46 and 185 reQTLs displaying specific, stronger effects after SARS-CoV-2 and IAV stimulation, respectively. The strongest SARS-CoV-2 reQTL (rs534191, Student’s t-test, P = 1.96 × 10⁻¹⁶ (SARS-CoV-2) and P = 0.05 (IAV); Fig. 3d) was identified in myeloid cells at MMP1, encoding a biomarker of COVID-19 severity38. These analyses reveal that the effects of virus-induced reQTLs are cell-type dependent and highlight the virus specificity of the genetic basis of the myeloid response. |
|

