Post by Admin on Sept 21, 2021 22:40:41 GMT
Materials and Methods
Samples
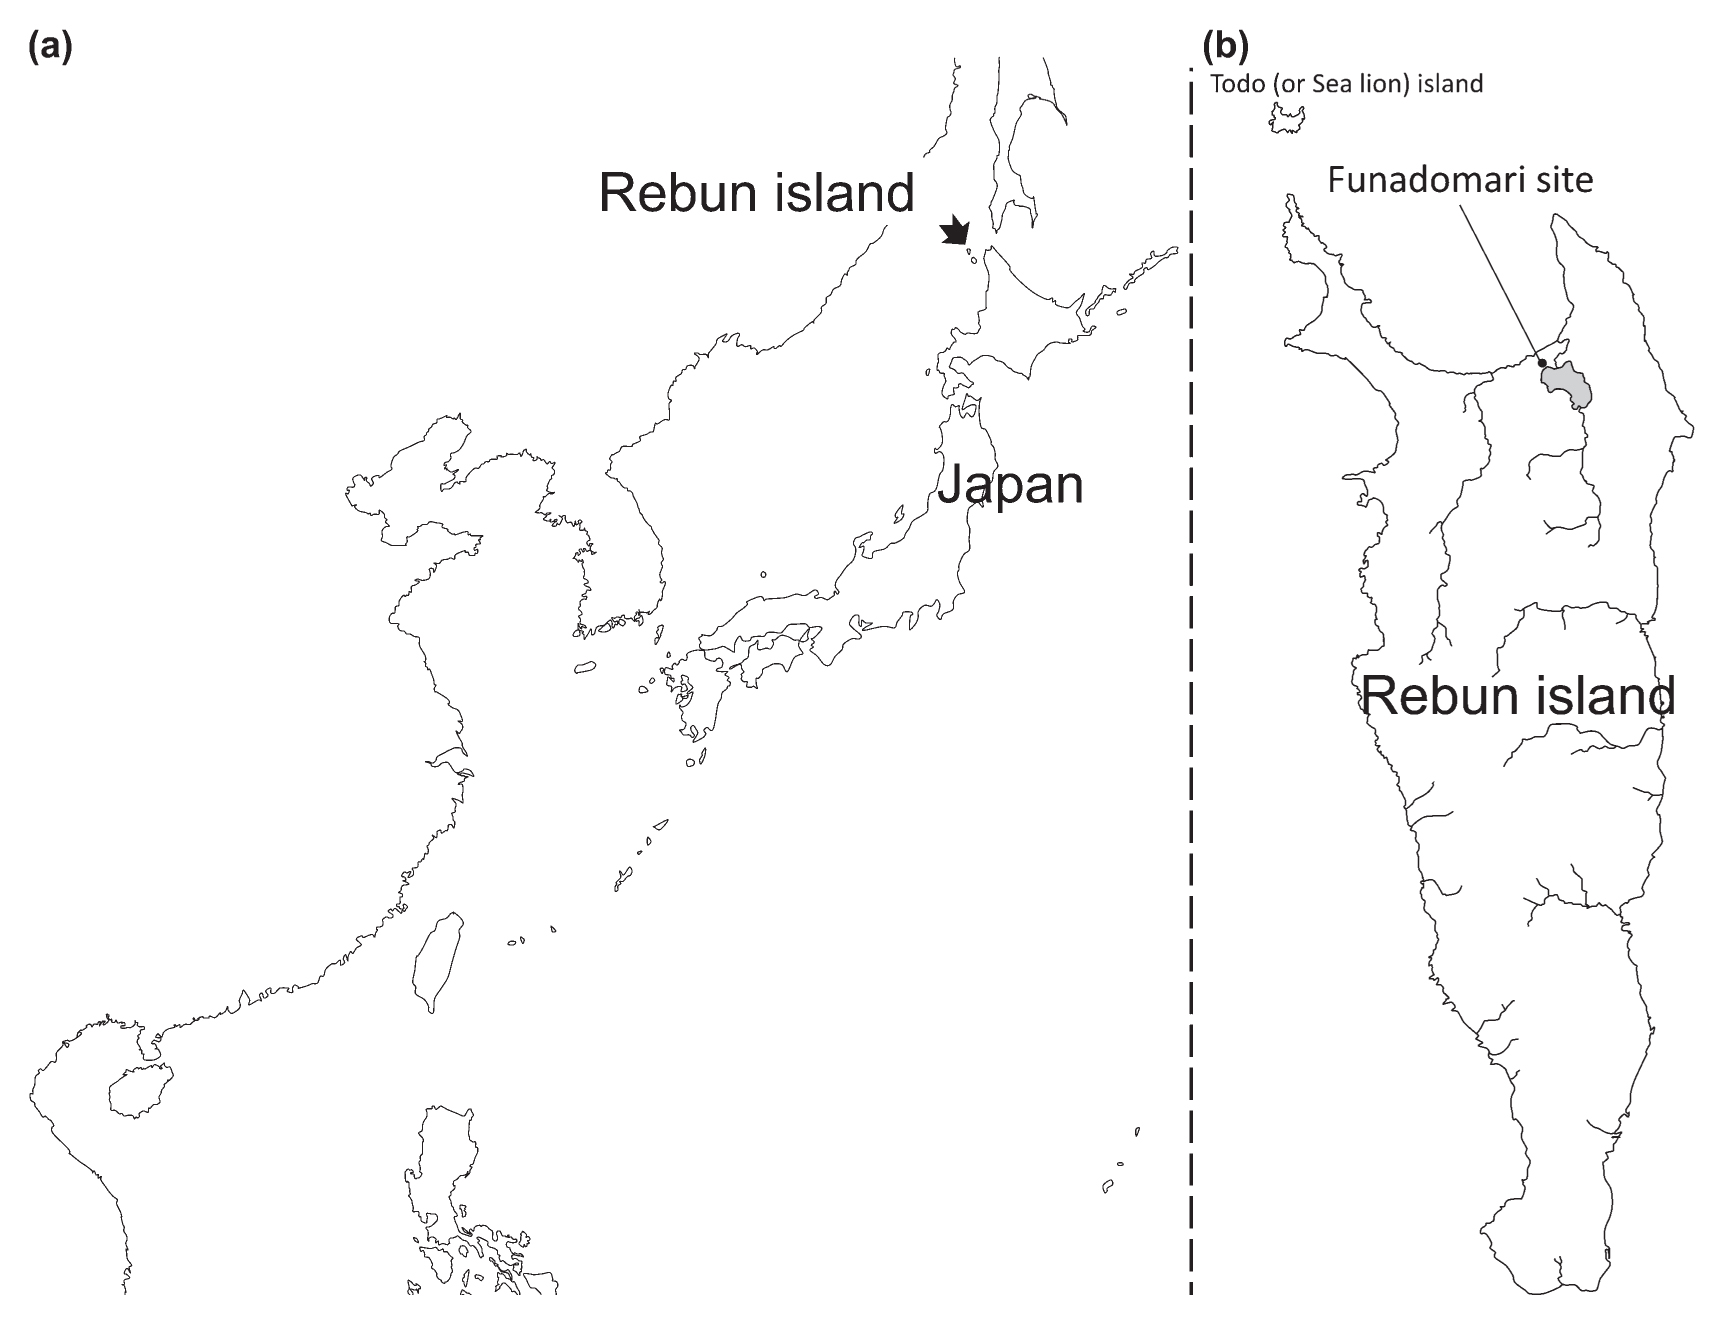
The skeletons that were analyzed in the current study were excavated in 1998 (Nishimoto, 2000) from the Funadomari shell mound, which is located in the northern part of Rebun Island (Figure 1). The two skeletons were housed at Sapporo Medical University and were dated to 3500–3800 years ago based on C14 dating of charcoal from the hearth (Nishimoto, 2000). From the stable isotope value for one of the samples (F23), we inferred the source of diet to be a mixture of marine and land animals. We calculated F marine from the proportion of marine animal (δ 13C = −12.5‰) and land animal (δ 13C = −21.0‰). The age of F23 was also dated to be 3550–3960 cal BP (Paleo Labo Co., Ltd.) (Supplementary Table 1). These values are consistent with “the late Jomon period” according to pottery-based dating (Nishimoto, 2000). We extracted DNA from the left second and right first mandible molar teeth of Funadomari No. 5 (F5) and No. 23 (F23), respectively. Their DNA was exceptionally well preserved (Adachi et al., 2009). In the previous study (Adachi et al., 2009), we used the dental pulp and the dentin around the dental cavity for DNA extraction. These DNA samples were obtained by drilling the tooth of each skeleton from the apical foramen. In the present study, we used the residual tooth powder of F5 and F23 that have been stored at −70°C at the Department of Legal Medicine, University of Yamanashi since 2009.

Figure 1
Map of East Asia. (a) Geographical location of Rebun Island, Hokkaido, Japan. (b) Geographical location of Funadomari site.
DNA extraction and library preparation
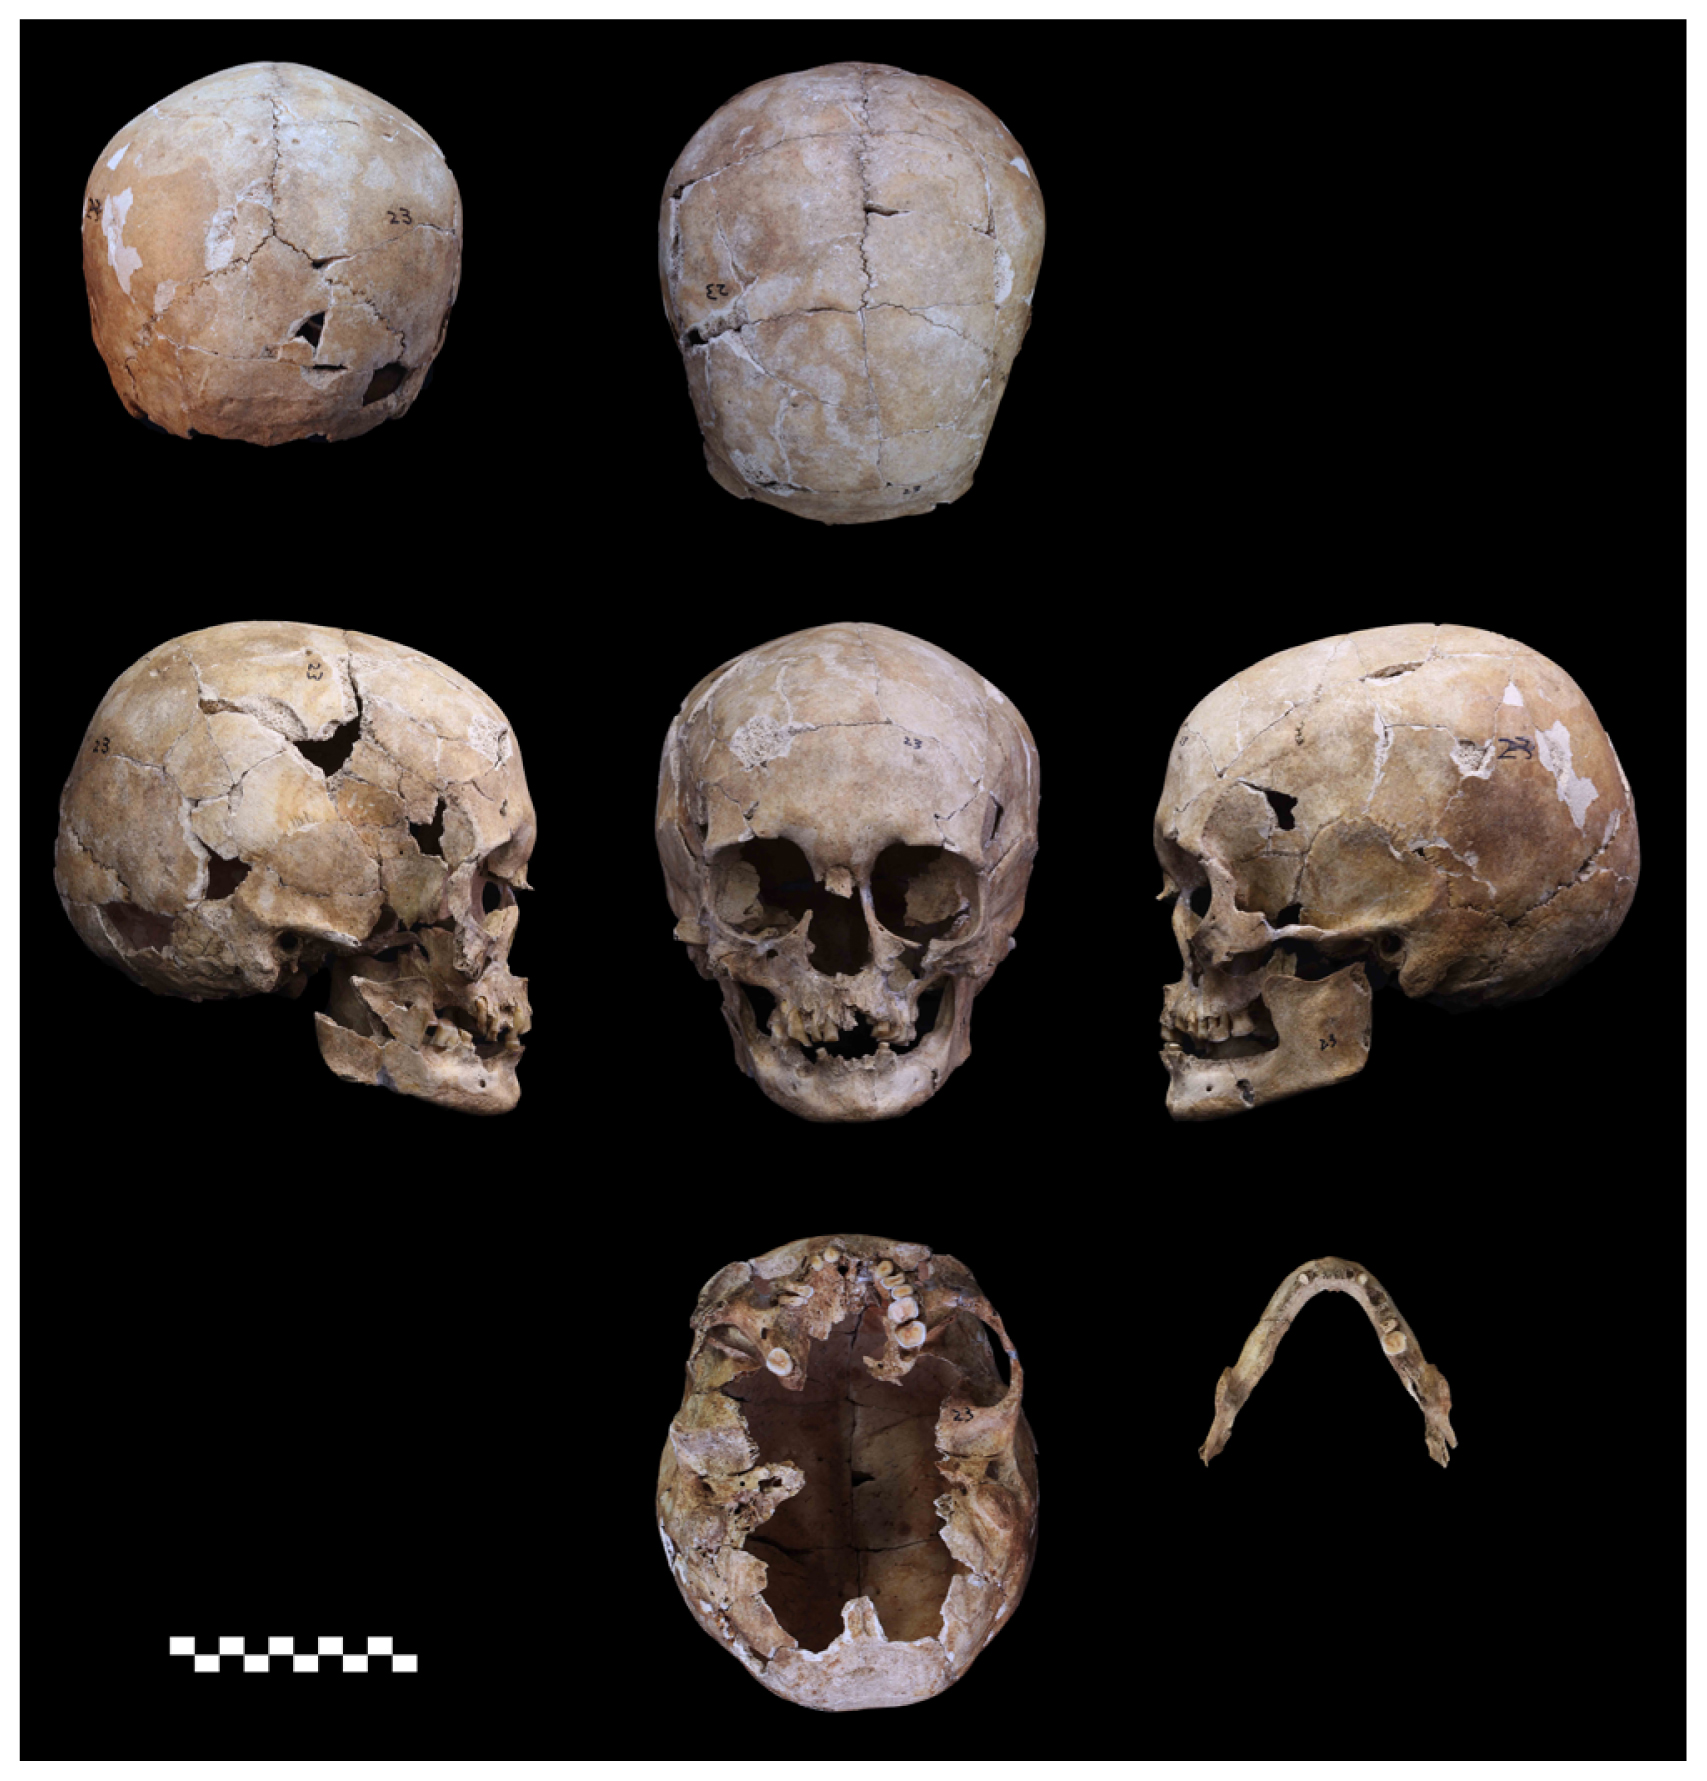
DNA from F5 and F23 (Figure 2) was extracted according to the methods described by Adachi et al. (2018) in the laboratory dedicated specifically for ancient DNA analyses at the University of Yamanashi. Briefly, the powdered sample was decalcified with 0.5 M EDTA (pH 8.0) at 56°C for 24 h, and the buffer was replaced with a fresh solution and decalcified again at 56°C for 36 h. Thereafter, the decalcified samples were lysed in 1000 μl of Genomic Lyse buffer (Genetic ID, Fairfield, IA, USA) and digested with 50 μl of 20 mg/ml proteinase K at 56°C overnight. Finally, the lysate was treated twice with 1500 μl phenol–chloroform–isoamyl alcohol (25:24:1) (Thermo Fisher Scientific, Waltham, MA, USA) and 1500 μl chloroform (Wako Pure Chemical Industries, Osaka, Japan). DNA was extracted from the lysate using a FAST ID DNA extraction kit (Genetic ID) in accordance with the manufacturer’s protocol.

Figure 2
Photo of female 23 (F23), whose genomic DNA sequence was determined. Scale bar = 10 cm.
Following the protocol of Shinoda et al. (2017), which was modified from the protocol of Kanzawa-Kiriyama et al. (2017), three and seven DNA libraries were prepared from DNA extracts of F5 and F23, respectively. For creating blunt-ends and adding a terminal 3′ adenine and adapter ligations, we used a GS Titanium Rapid Library Preparation kit (454 Life Science Corporation, Branford, CT, USA). The conditions for the generation of blunt-ends and addition of adenine were 20 min at 25°C, 20 min at 12°C, and 20 min at 72°C, with a hold at 4°C. For the adapter ligation, we used 1 μl of Illumina LT Set A adapter mix diluted to 10× using water or 2 μl of 10 μM short adapter designed by Shinoda et al. (2017) with 7 μl of 50% PEG-4000 (Hampton Research, Aliso Viejo, CA, USA). The short adapter was prepared by hybridizing two oligonucleotides (Short_Adapter_1: 5′-ACACTCTTTCCCTACACGACGCTCTTCCGATC-phosphorothioate-T-3′ and Short_Adapter_2: 5′-PHO-GATCGGAAGAGCACACGTCTGAACTCCAGTCAC-3′) as follows. In a polymerase chain reaction (PCR) tube, 20 μl of 500 μM CL53, 20 μl of 500 μM CL73, 9.5 μl TE (10 mM Tris–HCl, pH 8.0), and 0.5 μl of 5 M NaCl were combined. This mixture was incubated for 10 s at 95°C in a thermal cycler and cooled to 14°C at 0.1°C/s. A final concentration of 100 μM was obtained by dilution with 50 μl TE. The ligation was carried out for 3 h at 25°C. We purified the post-ligated solutions using the QIAquick PCR purification kit (Qiagen, Hilden, Germany) and eluted the ligated samples in 30 μl elution buffer (EB). When using the short-adapter, we diluted the post-ligated solution 3-fold with water and then used AMpureXP (Beckman Coulter, Brea, CA, USA) for purification. The entire volume of the purified library was used for PCR to complete the library preparation. We mixed 50 μl of the DNA library, 50 μl Multiplex PCR Master Mix (Qiagen), and 1000 nM of each multiplexing PCR primer and dispensed the mixture into two 200 μl single PCR tubes. Cycling conditions were as follows: 15 min at 95°C; 12 cycles of 30 s at 95°C, 30 s at 65°C, and 30 s at 72°C, with a final extension at 72°C for 10 min. The first PCR products were purified with an AMpureXP kit and eluted in 50 μl EB. A second-round of PCR was set up as follows: 10 μl product from the first PCR, 10 μl of 10× AccuPrime Pfx Reaction Mix, 1000 nM of each multiplexing PCR primer, 2.5 U of AccuPrime Pfx DNA polymerase (Thermo Fisher Scientific), and H2O were mixed to obtain a final reaction volume of 100 μl. We dispensed the mixture into two 200 μl PCR tubes. Cycling conditions were as follows: 95°C for 2 min; 8–12 cycles of 95°C for 15 s, 60°C for 30 s, and 68°C for 30 s; and a hold at 4°C. The second PCR products were purified with a QIAquick PCR purification kit and eluted in 50 μl EB. The purified libraries were quantified with an Agilent 2100 Bioanalyzer DNA High-Sensitivity chip (Agilent Technologies, Santa Clara, CA, USA) for sequencing.
Sequencing and sequence mapping
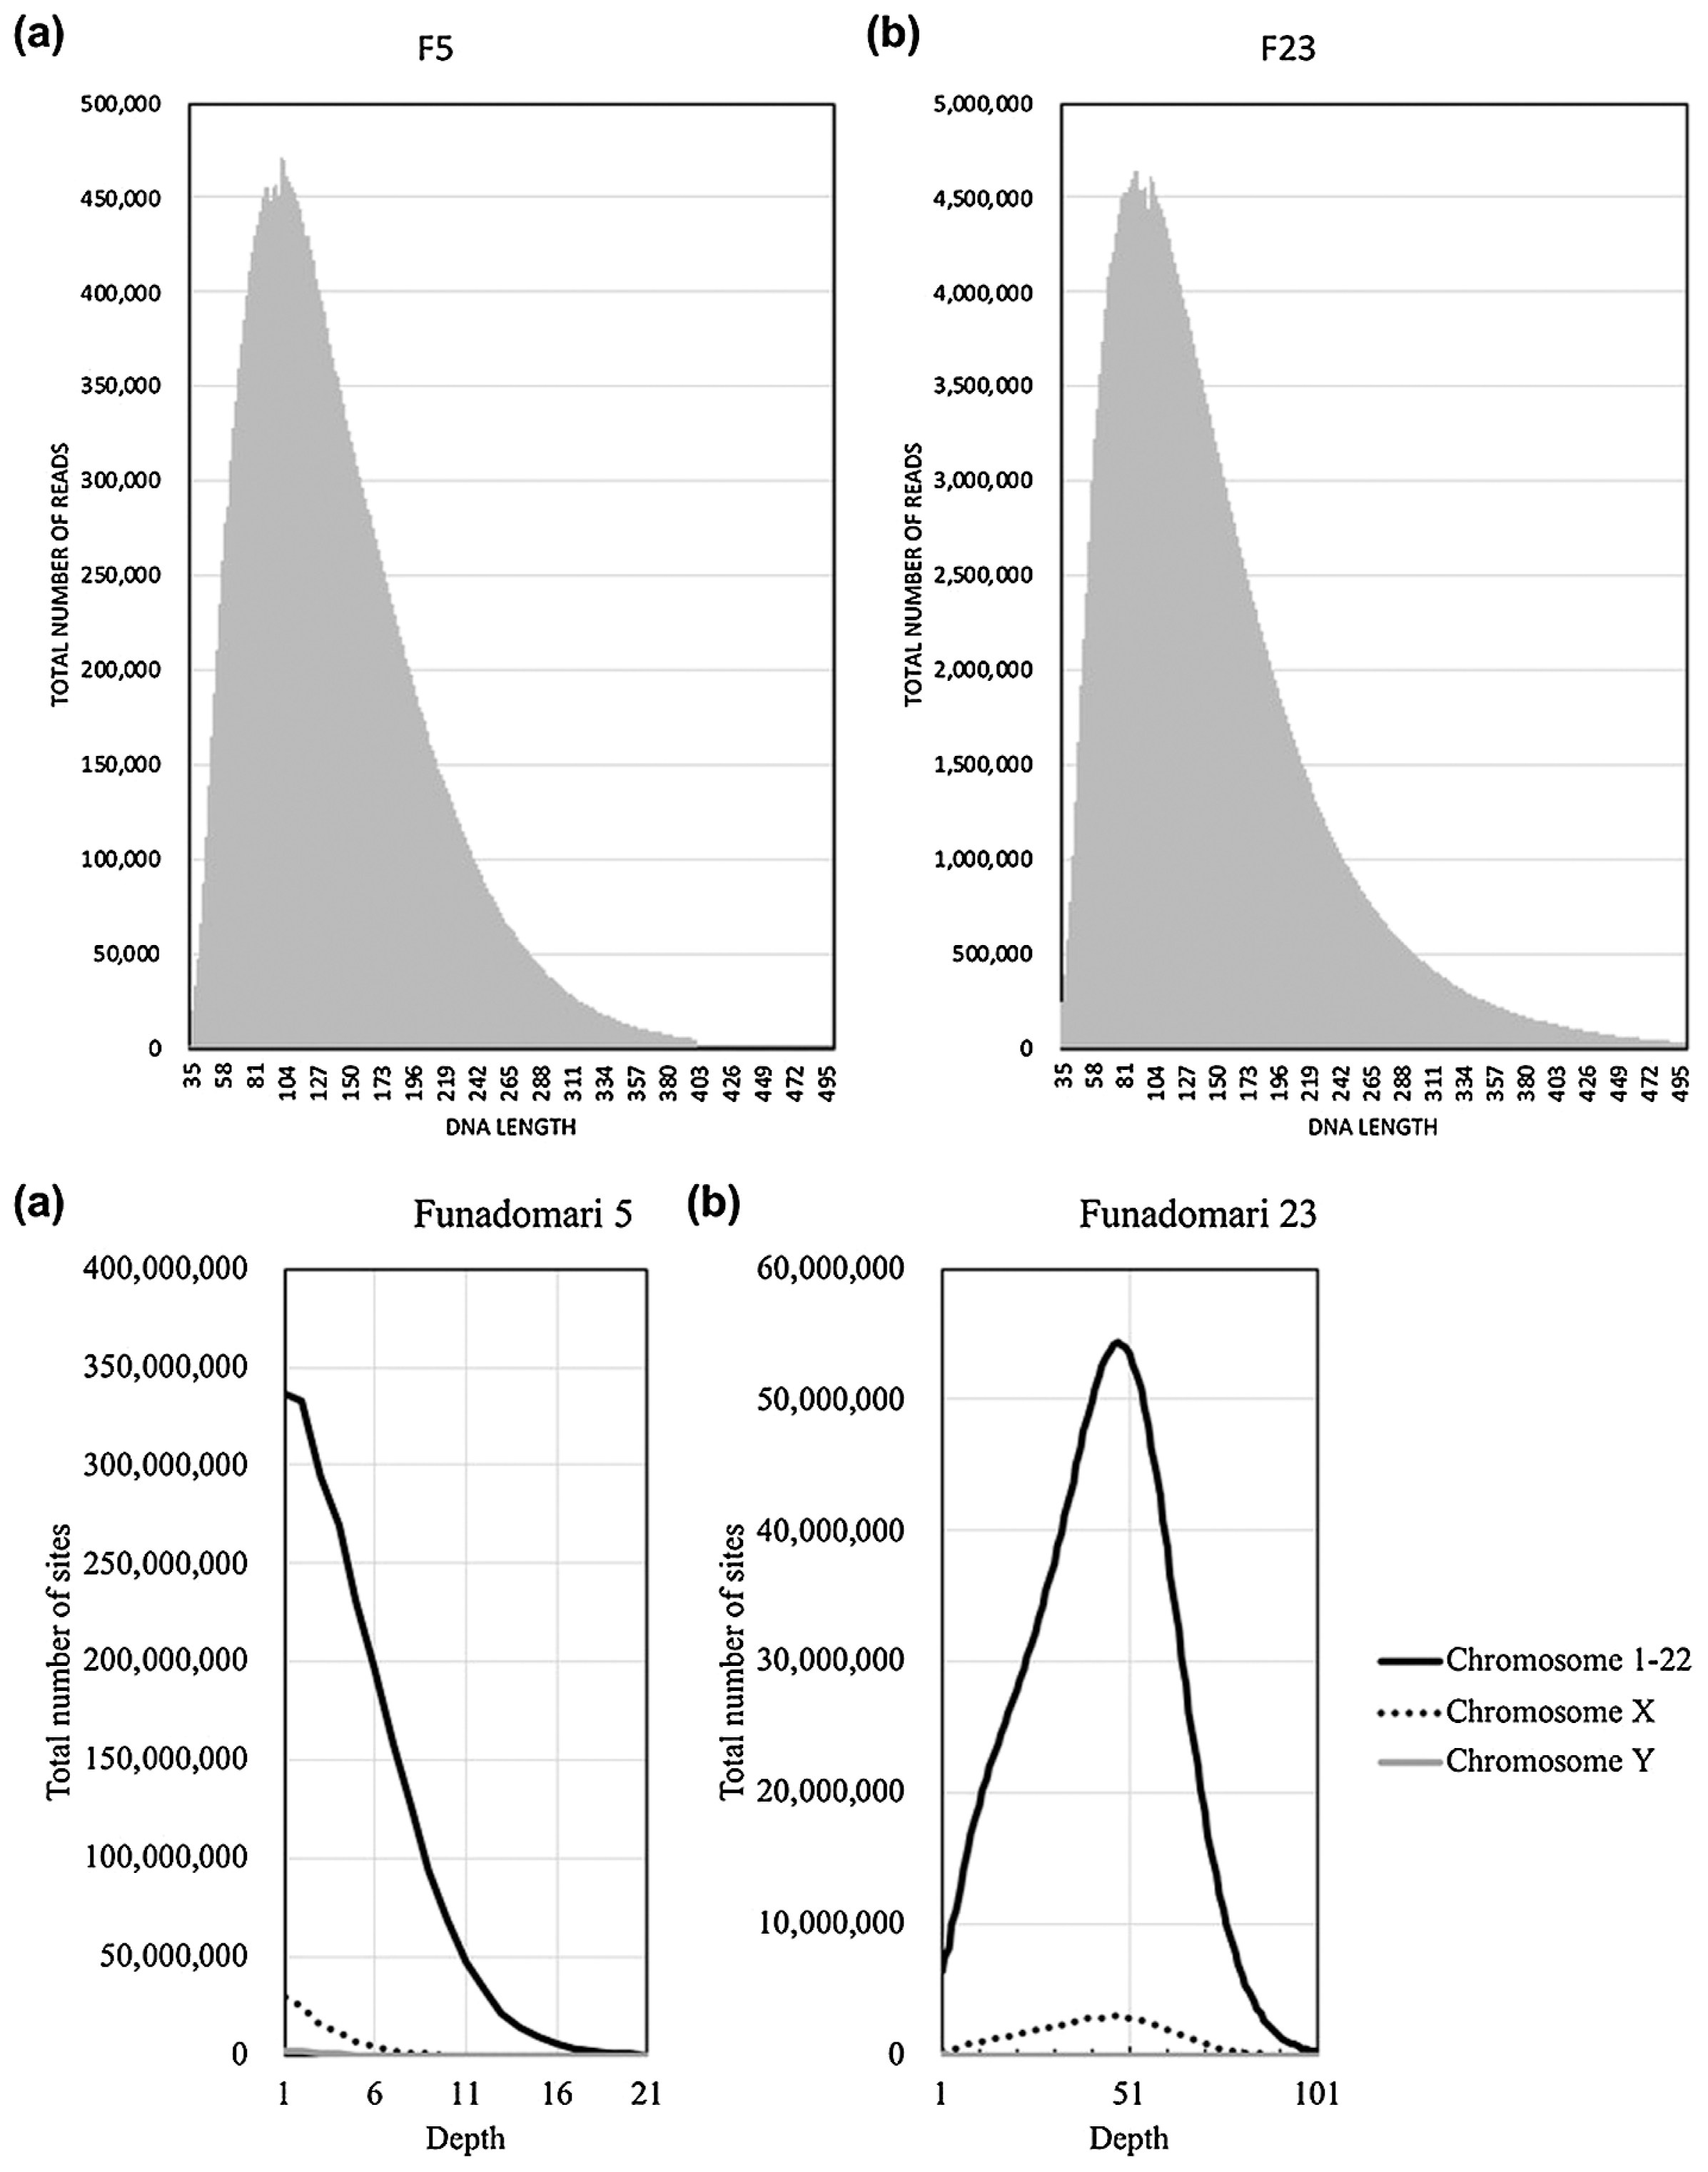
DNA sequencing was conducted for the DNA libraries on an Illumina 2500 platform using a paired-end run with 100 cycles at Hokkaido System Science Co., Ltd. (Sapporo, Japan). After trimming the adapter sequence with CutAdapt (Martin, 2011) (−q 25 −m 35 -a AGATCGGAAGAGC -A AGATCGGAAGAGC), the remaining paired reads were mapped to the human reference genome (hs37d5) using BWA (http://bio-bwa.sourceforge.net/index.shtml; mem -M) (Li and Durbin, 2009). The frequencies of mapped reads were examined using SAMtools (http://samtools.sourceforge.net/index.shtml), with the flagstat option (Li et al., 2009). Mapped reads with a mapping quality of 30 or more were retained, sorted, and merged. We then checked the insert size of paired reads, and exceptionally long reads were removed to exclude mismapped reads (≤400 for F5 and ≤500 for F23). PCR duplicates were removed using Picard MarkDuplicates (version 1.119; broadinstitute.github.io/picard/). After eliminating hard-clipped and soft-clipped reads and trimming three bases in the termini of the reads using BamUtil software (http://genome.sph.umich.edu/wiki/BamUtil), the resulting aligned reads were realigned using GATK IndelRealigner (--consensusDeterminationModel KNOWNS_ONLY -LOD 0.4) and recalibrated using GATK BaseRecalibrator. We then examined read length distributions for F5 and F23 based on the insert size.
Metagenomic analysis
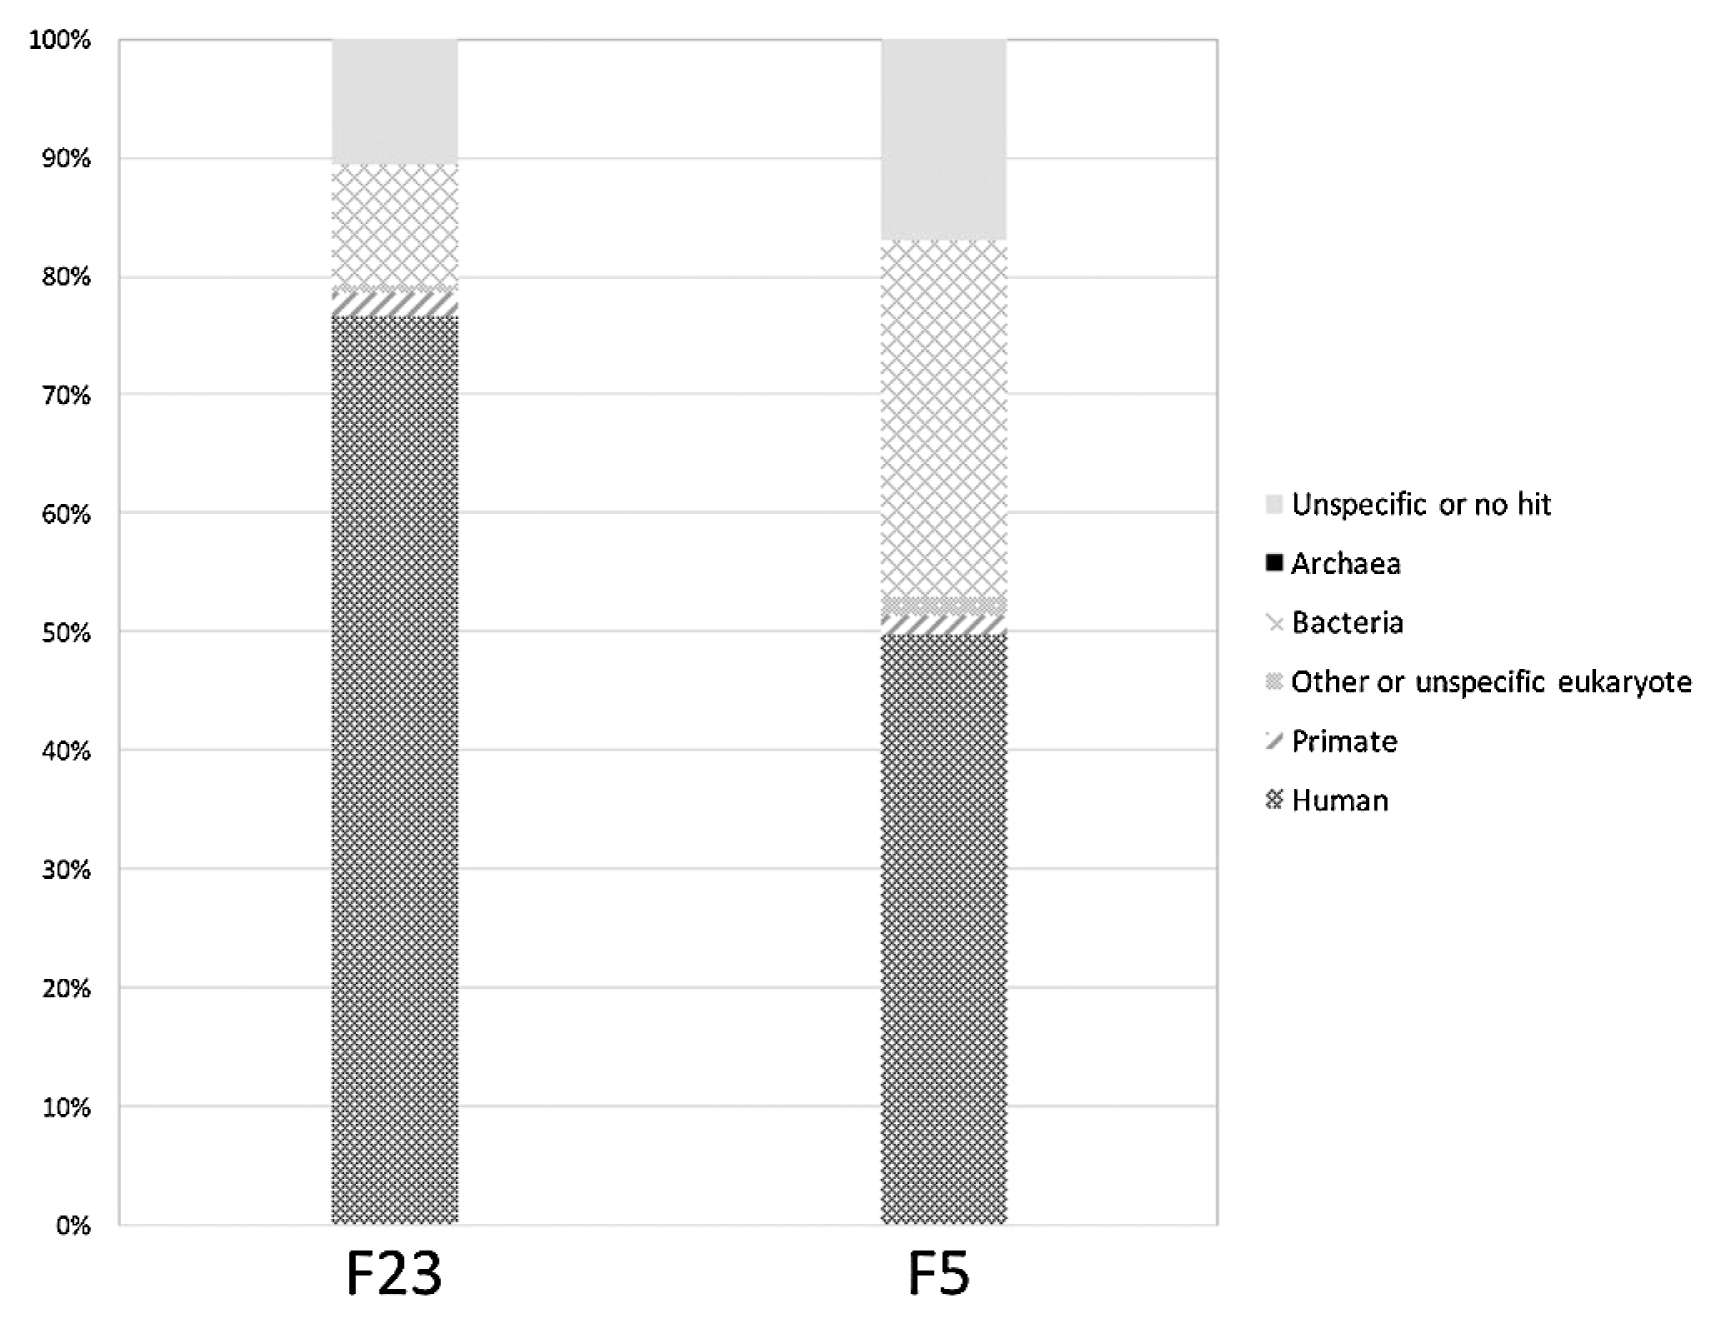
We performed metagenomic analysis to check for nonhuman DNA contamination. The reads were first preprocessed with the ‘tantan’ repeat masker (Frith, 2011) using options ‘x N –r 0.0005.’ The reads were then mapped to the reference human genome build GRCh38.p11, accession GCF_000001405.37, from RefSeq (O’Leary et al., 2016) with minimap2 (Li, 2018) using options ‘–x sr.’ The reads that failed to map were extracted as the ‘nonhuman’ read set. A subset of 100000 of such reads (about 10 Mbp) from each sample was then analyzed with BLAST (https://www.ncbi.nlm.nih.gov/BLAST/) using parameters ‘blastn –task blastn–dust no –evalue 3.80e–2 –dbsize 3200000000’ (Altschul et al., 1997). The BLAST search was performed against available GenBank (NCBI Resource Coordinators, 2018) and RefSeq (O’Leary et al., 2016) genome assemblies, obtained via the GenomeSync database (http://genomesync.org/). Overall, 143139 genomes were used, totaling about 1.73 Tbp of sequence. The search was performed and analyzed with the Genome Search Toolkit (http://kirill-kryukov.com/study/tools/gstk/). The reads were taxonomically classified by determining their specificity taxa; a read was labeled as specific to a taxon if it had more significant BLAST hits to genomes within this taxon compared with its hits in all other genomes. KronaTools (Ondov et al., 2011) was used for visualizing the results.
Mitochondrial genome analysis
We used GATK HaplotypeCaller to call variant sites for mitochondrial genomes (-stand_call_conf 30 -stand_emit_conf 10). We manually compared the list of variants with SNPs reported in phylotree-Build 17 (van Oven and Kayser, 2009) to determine mtDNA haplogroups. Based on the haplogroups, the resulting list of variants was double-checked using IGV software (Thorvaldsdóttir et al., 2013). Mitochondrial genome consensus sequences were prepared using GATK FastaAlternateReferenceMaker and used for later contamination estimates.
Sex determination and Y chromosome analysis
We first determined the sex of F5 and F23 by counting the number of sequence reads mapped to X and Y chromosomes. The size of the X chromosome is 10 times larger than that of the Y chromosome in the human reference genome, meaning that if the ancient individual was male, the X:Y ratio of mapped reads would be close to 10:1.
For Y chromosome analysis, we retrieved the human Y chromosome nucleotide sites registered at the International Society of Genetic Genealogy (ISOGG) website (https://isogg.org/tree/ISOGG_YDNA_SNP_Index.html) and then prepared an mpileup file of F5 overlapping with the listed nucleotide sites. We then determined the haplogroup classification of F5 and compared the F5 Y chromosome sequence and 60505 SNP sites listed in 1000 genome project Y chromosome data (ftp://ftp.1000genomes.ebi.ac.uk/vol1/ftp/release/20130502/ALL.chrY.phase3_integrated_v2a.20130502.genotypes.vcf.gz); 24391 SNP site data were shared between them. A phylogenetic tree was generated for these sequences using MEGA7 (Kumar et al., 2016) with the following parameters: Tamura-Nei model, uniform rates, using all sites.
DNA authenticity analysis and error rate estimation
To clarify the authenticity of the mapped sequence reads, we checked the frequency of postmortem misincorporation and depurination, which are characteristic of ancient DNA, with mapDamage2.0 (Jónsson et al., 2013). After confirming the authenticity, we estimated the contamination frequency for mtDNA and for nuclear DNA sequences. For mtDNA, we followed the methods used by Kanzawa-Kiriyama et al. (2017), in which the consistency of reads mapping to the SNPs of mtDNA haplogroups and individual specific mutations was estimated. We also used Schmutzi software (cont-Deam.pl --library single) (Renaud et al., 2015), a tool that uses a Bayesian maximum as an a posteriori algorithm to estimate mtDNA contamination. For nuclear DNA, we used ANGSD software (‘MoM’ estimate from ‘Method 1’ and the ‘new_llh’ likelihood computation) (Korneliussen et al., 2014), which estimates contamination based on the X chromosome polymorphism rate in males. We followed the criteria of Fu et al. (2016), stating that libraries are effectively uncontaminated if their X chromosome contamination estimates are less than 2.5%. We also estimated the error rate based on the excess of derived alleles in ancient samples using ANGSD software (-doAncError -anc hg19ancNoChr.fa -ref hs37d5.fa). For error rate estimates, data in which 3–10 bases were trimmed from sequence termini were used.
Samples
The skeletons that were analyzed in the current study were excavated in 1998 (Nishimoto, 2000) from the Funadomari shell mound, which is located in the northern part of Rebun Island (Figure 1). The two skeletons were housed at Sapporo Medical University and were dated to 3500–3800 years ago based on C14 dating of charcoal from the hearth (Nishimoto, 2000). From the stable isotope value for one of the samples (F23), we inferred the source of diet to be a mixture of marine and land animals. We calculated F marine from the proportion of marine animal (δ 13C = −12.5‰) and land animal (δ 13C = −21.0‰). The age of F23 was also dated to be 3550–3960 cal BP (Paleo Labo Co., Ltd.) (Supplementary Table 1). These values are consistent with “the late Jomon period” according to pottery-based dating (Nishimoto, 2000). We extracted DNA from the left second and right first mandible molar teeth of Funadomari No. 5 (F5) and No. 23 (F23), respectively. Their DNA was exceptionally well preserved (Adachi et al., 2009). In the previous study (Adachi et al., 2009), we used the dental pulp and the dentin around the dental cavity for DNA extraction. These DNA samples were obtained by drilling the tooth of each skeleton from the apical foramen. In the present study, we used the residual tooth powder of F5 and F23 that have been stored at −70°C at the Department of Legal Medicine, University of Yamanashi since 2009.

Figure 1
Map of East Asia. (a) Geographical location of Rebun Island, Hokkaido, Japan. (b) Geographical location of Funadomari site.
DNA extraction and library preparation
DNA from F5 and F23 (Figure 2) was extracted according to the methods described by Adachi et al. (2018) in the laboratory dedicated specifically for ancient DNA analyses at the University of Yamanashi. Briefly, the powdered sample was decalcified with 0.5 M EDTA (pH 8.0) at 56°C for 24 h, and the buffer was replaced with a fresh solution and decalcified again at 56°C for 36 h. Thereafter, the decalcified samples were lysed in 1000 μl of Genomic Lyse buffer (Genetic ID, Fairfield, IA, USA) and digested with 50 μl of 20 mg/ml proteinase K at 56°C overnight. Finally, the lysate was treated twice with 1500 μl phenol–chloroform–isoamyl alcohol (25:24:1) (Thermo Fisher Scientific, Waltham, MA, USA) and 1500 μl chloroform (Wako Pure Chemical Industries, Osaka, Japan). DNA was extracted from the lysate using a FAST ID DNA extraction kit (Genetic ID) in accordance with the manufacturer’s protocol.

Figure 2
Photo of female 23 (F23), whose genomic DNA sequence was determined. Scale bar = 10 cm.
Following the protocol of Shinoda et al. (2017), which was modified from the protocol of Kanzawa-Kiriyama et al. (2017), three and seven DNA libraries were prepared from DNA extracts of F5 and F23, respectively. For creating blunt-ends and adding a terminal 3′ adenine and adapter ligations, we used a GS Titanium Rapid Library Preparation kit (454 Life Science Corporation, Branford, CT, USA). The conditions for the generation of blunt-ends and addition of adenine were 20 min at 25°C, 20 min at 12°C, and 20 min at 72°C, with a hold at 4°C. For the adapter ligation, we used 1 μl of Illumina LT Set A adapter mix diluted to 10× using water or 2 μl of 10 μM short adapter designed by Shinoda et al. (2017) with 7 μl of 50% PEG-4000 (Hampton Research, Aliso Viejo, CA, USA). The short adapter was prepared by hybridizing two oligonucleotides (Short_Adapter_1: 5′-ACACTCTTTCCCTACACGACGCTCTTCCGATC-phosphorothioate-T-3′ and Short_Adapter_2: 5′-PHO-GATCGGAAGAGCACACGTCTGAACTCCAGTCAC-3′) as follows. In a polymerase chain reaction (PCR) tube, 20 μl of 500 μM CL53, 20 μl of 500 μM CL73, 9.5 μl TE (10 mM Tris–HCl, pH 8.0), and 0.5 μl of 5 M NaCl were combined. This mixture was incubated for 10 s at 95°C in a thermal cycler and cooled to 14°C at 0.1°C/s. A final concentration of 100 μM was obtained by dilution with 50 μl TE. The ligation was carried out for 3 h at 25°C. We purified the post-ligated solutions using the QIAquick PCR purification kit (Qiagen, Hilden, Germany) and eluted the ligated samples in 30 μl elution buffer (EB). When using the short-adapter, we diluted the post-ligated solution 3-fold with water and then used AMpureXP (Beckman Coulter, Brea, CA, USA) for purification. The entire volume of the purified library was used for PCR to complete the library preparation. We mixed 50 μl of the DNA library, 50 μl Multiplex PCR Master Mix (Qiagen), and 1000 nM of each multiplexing PCR primer and dispensed the mixture into two 200 μl single PCR tubes. Cycling conditions were as follows: 15 min at 95°C; 12 cycles of 30 s at 95°C, 30 s at 65°C, and 30 s at 72°C, with a final extension at 72°C for 10 min. The first PCR products were purified with an AMpureXP kit and eluted in 50 μl EB. A second-round of PCR was set up as follows: 10 μl product from the first PCR, 10 μl of 10× AccuPrime Pfx Reaction Mix, 1000 nM of each multiplexing PCR primer, 2.5 U of AccuPrime Pfx DNA polymerase (Thermo Fisher Scientific), and H2O were mixed to obtain a final reaction volume of 100 μl. We dispensed the mixture into two 200 μl PCR tubes. Cycling conditions were as follows: 95°C for 2 min; 8–12 cycles of 95°C for 15 s, 60°C for 30 s, and 68°C for 30 s; and a hold at 4°C. The second PCR products were purified with a QIAquick PCR purification kit and eluted in 50 μl EB. The purified libraries were quantified with an Agilent 2100 Bioanalyzer DNA High-Sensitivity chip (Agilent Technologies, Santa Clara, CA, USA) for sequencing.
Sequencing and sequence mapping
DNA sequencing was conducted for the DNA libraries on an Illumina 2500 platform using a paired-end run with 100 cycles at Hokkaido System Science Co., Ltd. (Sapporo, Japan). After trimming the adapter sequence with CutAdapt (Martin, 2011) (−q 25 −m 35 -a AGATCGGAAGAGC -A AGATCGGAAGAGC), the remaining paired reads were mapped to the human reference genome (hs37d5) using BWA (http://bio-bwa.sourceforge.net/index.shtml; mem -M) (Li and Durbin, 2009). The frequencies of mapped reads were examined using SAMtools (http://samtools.sourceforge.net/index.shtml), with the flagstat option (Li et al., 2009). Mapped reads with a mapping quality of 30 or more were retained, sorted, and merged. We then checked the insert size of paired reads, and exceptionally long reads were removed to exclude mismapped reads (≤400 for F5 and ≤500 for F23). PCR duplicates were removed using Picard MarkDuplicates (version 1.119; broadinstitute.github.io/picard/). After eliminating hard-clipped and soft-clipped reads and trimming three bases in the termini of the reads using BamUtil software (http://genome.sph.umich.edu/wiki/BamUtil), the resulting aligned reads were realigned using GATK IndelRealigner (--consensusDeterminationModel KNOWNS_ONLY -LOD 0.4) and recalibrated using GATK BaseRecalibrator. We then examined read length distributions for F5 and F23 based on the insert size.
Metagenomic analysis
We performed metagenomic analysis to check for nonhuman DNA contamination. The reads were first preprocessed with the ‘tantan’ repeat masker (Frith, 2011) using options ‘x N –r 0.0005.’ The reads were then mapped to the reference human genome build GRCh38.p11, accession GCF_000001405.37, from RefSeq (O’Leary et al., 2016) with minimap2 (Li, 2018) using options ‘–x sr.’ The reads that failed to map were extracted as the ‘nonhuman’ read set. A subset of 100000 of such reads (about 10 Mbp) from each sample was then analyzed with BLAST (https://www.ncbi.nlm.nih.gov/BLAST/) using parameters ‘blastn –task blastn–dust no –evalue 3.80e–2 –dbsize 3200000000’ (Altschul et al., 1997). The BLAST search was performed against available GenBank (NCBI Resource Coordinators, 2018) and RefSeq (O’Leary et al., 2016) genome assemblies, obtained via the GenomeSync database (http://genomesync.org/). Overall, 143139 genomes were used, totaling about 1.73 Tbp of sequence. The search was performed and analyzed with the Genome Search Toolkit (http://kirill-kryukov.com/study/tools/gstk/). The reads were taxonomically classified by determining their specificity taxa; a read was labeled as specific to a taxon if it had more significant BLAST hits to genomes within this taxon compared with its hits in all other genomes. KronaTools (Ondov et al., 2011) was used for visualizing the results.
Mitochondrial genome analysis
We used GATK HaplotypeCaller to call variant sites for mitochondrial genomes (-stand_call_conf 30 -stand_emit_conf 10). We manually compared the list of variants with SNPs reported in phylotree-Build 17 (van Oven and Kayser, 2009) to determine mtDNA haplogroups. Based on the haplogroups, the resulting list of variants was double-checked using IGV software (Thorvaldsdóttir et al., 2013). Mitochondrial genome consensus sequences were prepared using GATK FastaAlternateReferenceMaker and used for later contamination estimates.
Sex determination and Y chromosome analysis
We first determined the sex of F5 and F23 by counting the number of sequence reads mapped to X and Y chromosomes. The size of the X chromosome is 10 times larger than that of the Y chromosome in the human reference genome, meaning that if the ancient individual was male, the X:Y ratio of mapped reads would be close to 10:1.
For Y chromosome analysis, we retrieved the human Y chromosome nucleotide sites registered at the International Society of Genetic Genealogy (ISOGG) website (https://isogg.org/tree/ISOGG_YDNA_SNP_Index.html) and then prepared an mpileup file of F5 overlapping with the listed nucleotide sites. We then determined the haplogroup classification of F5 and compared the F5 Y chromosome sequence and 60505 SNP sites listed in 1000 genome project Y chromosome data (ftp://ftp.1000genomes.ebi.ac.uk/vol1/ftp/release/20130502/ALL.chrY.phase3_integrated_v2a.20130502.genotypes.vcf.gz); 24391 SNP site data were shared between them. A phylogenetic tree was generated for these sequences using MEGA7 (Kumar et al., 2016) with the following parameters: Tamura-Nei model, uniform rates, using all sites.
DNA authenticity analysis and error rate estimation
To clarify the authenticity of the mapped sequence reads, we checked the frequency of postmortem misincorporation and depurination, which are characteristic of ancient DNA, with mapDamage2.0 (Jónsson et al., 2013). After confirming the authenticity, we estimated the contamination frequency for mtDNA and for nuclear DNA sequences. For mtDNA, we followed the methods used by Kanzawa-Kiriyama et al. (2017), in which the consistency of reads mapping to the SNPs of mtDNA haplogroups and individual specific mutations was estimated. We also used Schmutzi software (cont-Deam.pl --library single) (Renaud et al., 2015), a tool that uses a Bayesian maximum as an a posteriori algorithm to estimate mtDNA contamination. For nuclear DNA, we used ANGSD software (‘MoM’ estimate from ‘Method 1’ and the ‘new_llh’ likelihood computation) (Korneliussen et al., 2014), which estimates contamination based on the X chromosome polymorphism rate in males. We followed the criteria of Fu et al. (2016), stating that libraries are effectively uncontaminated if their X chromosome contamination estimates are less than 2.5%. We also estimated the error rate based on the excess of derived alleles in ancient samples using ANGSD software (-doAncError -anc hg19ancNoChr.fa -ref hs37d5.fa). For error rate estimates, data in which 3–10 bases were trimmed from sequence termini were used.


