|
|
Post by Admin on Feb 24, 2017 20:35:19 GMT
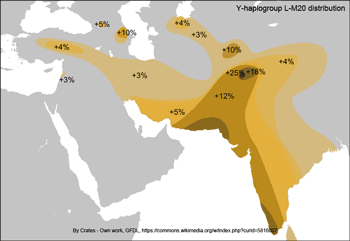 The two maps show a strong association between haplogroup L-M20 and the Indus Valley Civilization. McElreavey et al. (2005) found that L-M20 spread in the Indus Valley around 7,000 years ago, which may be associated with the expansion of farming groups during the Neolithic period, originally from the Middle East. L-M20 has a higher frequency among Dravidian castes, while it's rare among Indo-Aryan castes, and the Indo-Aryan migration into the northern Punjab started shortly after the decline of the Indus-Valley Civilization, which confirms a theory that it was a Dravidian civilization. 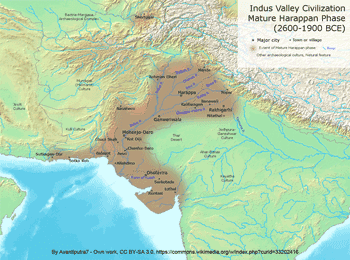 Both mtDNA and Y-chromosome variation show a similar pattern in the Indus Valley, with a mosaic composition of different components from West Eurasia, South Asia and East Asia. However, patterns of population distribution are much more discernible for mtDNA data than for the Y-chromosome. In general, mtDNA variation shows a simple west-to-east divide and a sharp boundary underlying the mtDNA variation in this region (Figures 1 and 2). Populations located west of the Indus basin exhibit a common mtDNA lineage composi- tion, consisting mainly of western Eurasian lineages, with a very limited contribution from South Asia and eastern Eurasia (Quintana-Murci et al. 2004, Figure 1). For example, there is a virtual absence of both common South Asian lineages (M*, U2a, U2b and U2c) and the more autochthonous U9, R*, R2, R5, R6, N1d and HV2 lineages in the Anatolian/Caucasus region and Iranian plateau, whereas these lineages make up > 50% of the haplogroup profile in the adjacent Indus Valley (Quintana-Murci et al. 2004). 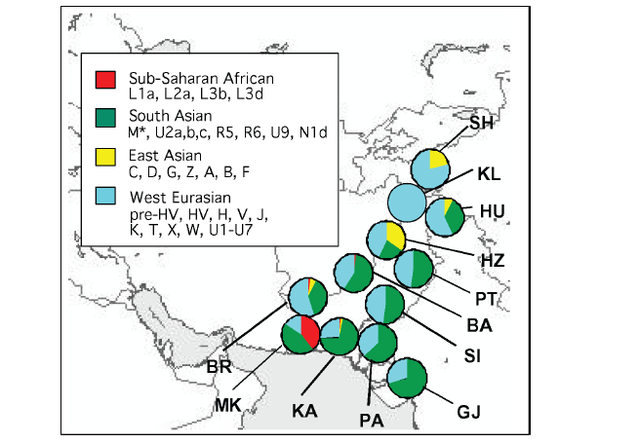 Figure 1. Map showing the different Pakistani and north-west Indian populations and their maternal genetic components. Pie charts show the distribution of the main mtDNA lineage groups in the populations studied; the sections reflect the frequency of different haplogroup clusters. Population codes are: SH, Shugnan; KL, Kalash; HU, Hunza; HZ, Hazara; PT, Pathans; BA, Baluchi; SI, Sindhi; GJ, Gujarati; PA, Parsi; KA, Karachi; MK, Makrani; BR, Brahui. Some of these mtDNA lineages are ancient and are of probable Pleistocene origin. U7 is the most widespread deep-rooting local lineage ( 38 000 YBP), and other lineages (HV2, R2, R5, U2a, U2b, and U2c) in the Indus Valley and India show signals of in situ differen- tiation, which appears to be limited to this region. All these lineages have deep time-depths (28 00 052 000 YBP), similar to haplogroup M* (32 000–53 000) in the region (Kivisild et al. 1999, Quintana-Murci et al. 1999, Roychoudhury et al. 2001). The distribution and ages of these lineages suggest that they are the legacy of the first inhabitants of the south-western Asian region who underwent important expansions during the Palaeolithic period. The absence of these lineages west of Pakistan may be due either to limited gene flow from the Indus basin or to important demographic expansions in the Fertile Crescent (including its eastern lobe, represented by present-day Iran), associated with a substantial increase in frequency and diversity of western Eurasian lineages (Quintana-Murci et al. 2001, Wells et al. 2001, Qamar et al. 2002). The maternal genetic component of these populations thus evinced a strong and significant genetic barrier that separates populations west of Pakistan from those to the east and north of the Indus Valley (Figure 2). Gene flow from the Fertile Crescent to India can, however, be detected and West Eurasian lineages are present at high frequencies (26–57%), with a gradient towards the Indian subcontinent (Quintana-Murci et al. 2004). The eastern Eurasian contribution west of the Indus Valley is virtually absent, despite the known historical population movements from the East (e.g. Mongols, Altaic-speaking populations, etc.) to the west. In striking contrast to the mtDNA data, there is no strong evidence in Pakistani popula- tions of Y-chromosome signatures of the early inhabitants of the region following the African exodus (Qamar et al. 2002, Zerjal et al. 2002), with their Y-chromosomes largely replaced by subsequent migrations or gene flow. The Y-chromosome gene pool of Pakistani popula- tions is mainly attributable to western Eurasian lineages, particularly from the Middle East (Qamar et al. 2002). Conversely, few traces of East Asian haplogroups are observed in the Indus Valley populations. One Y-chromosome haplogroup (L-M20) has a high mean fre- quency of 14% in Pakistan and so differs from all other haplogroups in its frequency distri- bution. L-M20 is also observed, although at lower frequencies, in neighbouring countries, such as India, Tajikistan, Uzbekistan and Russia. Both the frequency distribution and esti- mated expansion time ( 7000 YBP) of this lineage suggest that its spread in the Indus Valley may be associated with the expansion of local farming groups during the Neolithic period (Qamar et al. 2002). 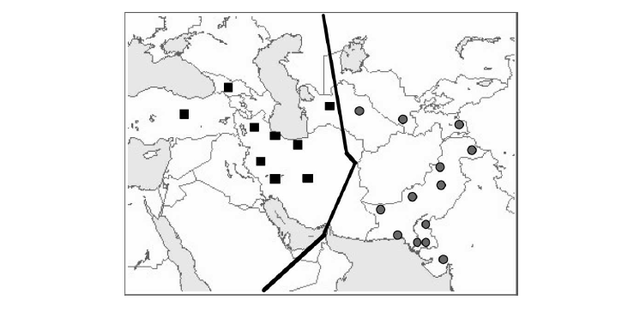 Figure 2. Map showing the groupings and barrier, inferred from SAMOVA analyses when searching for two groups. SAMOVA (spatial analysis of molecular variance) analysis defines groups of populations that are geographically homogeneous and maximally differentiated from each other, and the population symbols represent the groups of populations inferred from the SAMOVA analyses. A strong genetic barrier separating populations west of the Indus Valley from Pakistani populations emerged from the mtDNA data. In striking contrast to the mtDNA data, there is no strong evidence in Pakistani popula- tions of Y-chromosome signatures of the early inhabitants of the region following the African exodus (Qamar et al. 2002, Zerjal et al. 2002), with their Y-chromosomes largely replaced by subsequent migrations or gene flow. The Y-chromosome gene pool of Pakistani popula- tions is mainly attributable to western Eurasian lineages, particularly from the Middle East (Qamar et al. 2002). Conversely, few traces of East Asian haplogroups are observed in the Indus Valley populations. One Y-chromosome haplogroup (L-M20) has a high mean fre- quency of 14% in Pakistan and so differs from all other haplogroups in its frequency distri- bution. L-M20 is also observed, although at lower frequencies, in neighbouring countries, such as India, Tajikistan, Uzbekistan and Russia. Both the frequency distribution and esti- mated expansion time ( 7000 YBP) of this lineage suggest that its spread in the Indus Valley may be associated with the expansion of local farming groups during the Neolithic period (Qamar et al. 2002). Ann Hum Biol. 2005 Mar-Apr;32(2):154-62. |
|
|
|
Post by Admin on Sept 12, 2017 20:00:03 GMT
Raj Vedam of Indian History Awareness & Research (IHAR) highlights the mainstream narrative of Indian history and discusses the genetic history of India in this Part 1 of a 3-Part talk, delivered in Houston, Texas, on Jan 2nd, 2016.
Raj Vedam of Indian History Awareness & Research (IHAR) highlights the mainstream narrative of Indian history and discusses the history of astronomy India in this Part 2 of a 3-Part talk, delivered in Houston, Texas, on Jan 2nd, 2016.
|
|
|
|
Post by Admin on Sept 13, 2017 19:06:43 GMT
Raj Vedam of Indian History Awareness & Research (IHAR) highlights the mainstream narrative of Indian history and discusses knowledge-transfers from India in this Part 3 of a 3-Part talk, delivered in Houston, Texas, on Jan 2nd, 2016.  |
|
|
|
Post by Admin on Aug 27, 2018 18:57:58 GMT
India is the second most populous country in the world with a population of 1.21 billion [1]. About 4,635 different population groups are spread across the country [2]. Exorbitant as it may sound, existence of at least 50–60 thousand essentially endogamous groups has been reported in the country [3]–[4]. The present day Indian population is divided into tribal and non-tribal groups. Tribal populations constitute 8.2% of the total population [5] and are considered to be the indigenous populations of India [6]–[8]. The tribal groups of India belong to four broad linguistic families: Austro-Asiatic, Dravidian, Indo-European and Tibeto-Burman [9]. The Indo-European and Dravidian speaking populations are considered to be the major contributors to the development of Indian culture and society [10]. Both Austro-Asiatic and Dravidian speaking tribes belong to the primary pre-historic populations of India [7], [11]. Tibeto-Burman speakers also include many tribal populations but their geographical distribution is largely restricted to the North-Eastern region of India. India thus exhibits an enormous genetic, cultural and linguistic diversity which can partly be attributed to its position at the tri-junction: with Africa in the west, Eurasia in the north and the Orient in the east. The country's unique location gives rise to a great variety of environmental conditions and associated biodiversity [12] which in turn has attracted people from all over the globe.  Archaeological and paleontological evidence dating back to the middle and late Pleistocene era points towards early human occupation of the Indian subcontinent [13]–[16]. Similar evidence of antiquity of Indian populations has been established by genetic marker studies. The high levels of gene diversity and coefficients of gene differentiation obtained using autosomal markers for Indian populations are a testimony of both, the antiquity and the complex population structure, of this massive human conglomeration existing in the southern part of Asia [17]–[19]. Recent genetic studies based on mtDNA showing the high frequency of mitochondrial lineages with greater age, high diversity and wide distribution amply demonstrate the prehistoric existence of mankind on the Indian subcontinent [20]–[21]. Similar analyses of Y chromosome variation based on both bi-allelic and microsatellite markers have documented the existence of substantially deep rooted lineages among Indian populations buttressing the claim of early habitation of humans on the Indian subcontinent [22]–[25]. The unique and complex structure of the Indian population is attributed to the multiple waves of migration and the resultant gene-flow which occurred in the past [12], [26]. Some scholars have provided evidence to explain the origin and migration of the major linguistic families extant in India [25], [27]. It is worth mentioning that speakers of Austro-Asiatic language in India are exclusively tribal, which may be indicative of their being one of the oldest inhabitants of India [28], [29]. The arrival of the Indo-European speakers via the Northern corridor of India around 3,500–4,000 years ago is believed to be responsible for one of the major influxes of people in the Indian subcontinent [30], followed later by the infiltration of colonizers from different parts of the world. Thus, several studies have affirmed the influence of Eurasian and Asian populations on the Indian gene pool [23]–[24], [31]–[34].  Within this complex scenario, many interaction models such as gene-language, gene-geography and gene-ethnicity have been contested. Previous studies have shown inverse correlation between genetic affinities and geographical distance [11], [35]. Significant genetic differentiation between caste and tribal populations has been reported [31], [33], [36], as against a model which suggests that there is considerable sharing of Pleistocene heritage among them with a limited gene flow [34]. Similarly, congruence between language and genes has been proposed by various scholars [9], [37]–[38] along with a competing view supporting that genetic affinities may not necessarily be dependent on linguistic similarities [39]–[41]. Although each study has contributed significantly to understanding the role of language, culture and geography in relation to the genetic affiliation and demographic history of Indian populations; a major limitation in them has been the poor representation of Indo-European speaking tribal populations. This is a critically important limitation since the Indo-European speaking tribes provide ample opportunity for examining the influence of linguistic assimilation on the genomic diversity of India. Keeping the above in view, we present an analysis based on the study of 48 bi-allelic markers in nine Indo-European speaking tribal groups of Southern Gujarat which lies in the western part of India. The main objectives of the study were (a) to study the distribution of Y haplogroups; (b) to study the relative influence of language, geography or ethnicity on the genetic structure of populations using the pattern of Y haplogroup clustering and finally (c) to relate the observed pattern of Y haplogroup clustering with the Y chromosome lineages which arrived in India largely from the Northern corridor at different points of time. To achieve the study objectives the results were first compared with published studies on the Indian populations and then with available data on the Eurasian populations. The Indian populations were selected keeping in view the availability of data, their linguistic and socio-culture status and geographical position. Similarly, the Eurasian populations for which published sources were available were considered for analysis since the historical migrations from these regions are known.  Figure 1. Sampling areas; Map of India highlighting Gujarat (top); Regions of study pointed out in the map of Gujarat (bottom). The frequency distribution of Y chromosome haplogroups among the study populations along with the phylogenetic relationship between them is presented in Figure 2. The side branches on the tree represent Y SNP for which the ancestral state was observed, while the direct branch represents Y markers for which the mutant allelic state was observed; leading to haplogroup designation in the particular sample. Analysis of 48 bi-allelic markers of the Y chromosome showed 13 paternal lineages that were distributed throughout haplogroups H, R, J, C, F, L, K and Q. Haplogroup H represented the most frequently occurring haplogroup (40.14%) followed by groups R (28.17%), J (10.21%) and C (8.45%) respectively. Sparse distribution was observed for the lineages F*, L1, Q3 and K* across all the populations. |
|
|
|
Post by Admin on Aug 28, 2018 20:22:23 GMT
 Figure 2. Distribution of Y-binary halpogroups and haplogroup diversity (h) among the study populations of Gujarat. Haplogroup H. M69 mutation, which is a characteristic of haplogroup H was found on 114 of the total 284 Y chromosomes. Haplogroup H was further segregated into three lineages, H1 by the presence of M52-C allele, H2 by the presence of Apt-A allele and H* by absence of the two alleles. These haplogroups were further subdivided into a number of sub-clades. Lineage H1a* of H1 group was observed 71 times and represented the most frequently occurring lineage across all the populations. Its frequency varied from a minimum of 3.45% among Pavagadhi Chaudhari to a maximum of 62.5% in Vasava. Lineage H2 represented the second most frequently occurring lineage among the H haplogroup and third most common haplogroup among all the haplogroups. Its frequency varied from 3.45% among Pavagadhi Chaudhari to 40.74% among Mota Chaudhari. However, H2-Apt was found to be absent among Vasava and Gamit populations. While lineage H* was observed in only three individuals, one each from Konkana, Gamit and Mota Chaudhari. Haplogroup R. R1a1*a sub-clade of R haplogroup was found to be the next most frequently occurring lineage after H1a*. Its frequency was found ranging from 5.56% in Gamit to 62.07% in Pavagadhi Chaudhari. Its sister sub-clade R2-M124 was observed 27 times with a frequency varying from 5.56% among Gamit to 20.83% among the Konkana tribe. Barring Valvi Chaudhari, R2 was absent from all other Chaudhari groups. Haplogroup J. J2 with its two sub-clades J2b2* and J2a constituted a major portion of Haplogroup J in the current study. Except Konkana and Mota Chaudhari, either of the two J2 sub-clades was present in all other groups. J2b2* sub-clade was observed in 21 Y chromosomes. Its frequency was found to be 11% in Gamit, 19% in Valvi Chaudhari and 21% in Pavagadhi Chaudhari. The remaining four populations of Dhodia, Dubla, Vasava and Nana Chaudhari exhibited similar frequency values varying in a narrow range between 4% and 4.48%. Sub-clade J2a was observed only 8 times in the nine groups. It was present in four of the groups with a minimum frequency of 3.17% in Dhodia to a maximum frequency of 7.14% in Dubla. Haplogroup C. Out of the seven sub-clades of C haplogroup, only one sub-clade C5 with its two main derivatives C5a and C5* was observed 21 times in all the populations except Pavagadhi Chaudhari. C5a lineage was observed to be 62 times more frequent then its sister branch C5*. Its frequency varied from 3.17% in Dhodia to 12.5% in Valvi Chaudhari, while that of C5* was found to vary from 3.7% in Mota Chaudhari to 9.38% in Valvi Chaudhari. Haplogroup F*, K*, L1 and Q3. Parahaplogroup F* along with the other parahaplogroup K* and two haplogroups L and Q accounted for 13.03% of the total haplogroups. After initial screening of M89-T allele, 11 samples failed to resolve further and were therefore grouped under F*. Similarly, 8 individuals did not exhibit any mutation except G allele for M9 and were therefore grouped under K*. Other two sub-clades L1-M27 and Q3-M346 were present, but in low frequencies only. Y chromosome diversity Haplogroup diversity values for each of the nine populations along with haplogroup distribution are given in Figure 2. Haplogroup diversity (h) which is equivalent to gene diversity for haploid genomes ranged from 0.586 in Pavagadhi Chaudhari to 0.899 in Valvi Chaudhari. |
|


