|
|
Post by Admin on Aug 29, 2018 19:09:39 GMT
Population Structure and Gene Flow Figure 3 represents a plot of haplogroup diversity regressed against distance from gene frequency centroid (rii). The values of gene diversity (hi) and genetic distances from centroid (rii) used in the nine study population groups along with their standard errors are given in Table 2. Majority of the populations exhibited higher than predicted gene diversity combined with a low to moderate deviation from the theoretical line of regression and the distance from the gene frequency centroid. Three populations Gamit, Vasava and Pavagadhi Chaudhari displayed lower than predicted gene diversity. Pavagadhi Chaudhari showed the farthest distance from the gene frequency centroid. The results indicated that the tribal groups of Gujarat are neither explicitly isolated nor absolutely admixed. 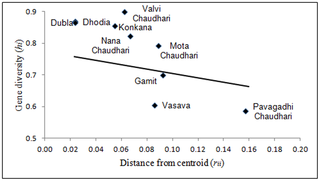 Figure 3. Regression of gene diversity (hi) on distance from centroid (rii). We compared the study populations with 24 additional world populations already published in separate studies (Figure 4). A stress value of 0.18 for the MDS plot indicated a good fit between the two dimensional graph and the original distance matrix. The comparison revealed four major clusters of South Asian, Central Asian, West Asian and European populations. All the populations under study with the exception of Pavagadhi Chaudhari were found to be clustered together. The occurrence of South Asian populations (the current study groups, Afghanistan, Pakistan and Iran) with Central Asian populations (Kazakhstan, Altai Region, Uzbekistan, Kyrgyzstan, Uyghurstan) on Axis I, conversely with West Asian populations (Iraq, Jordan, Turkey, Lebanon, Syria) with respect to Axis II probably indicate similarities of haplogroups between them. 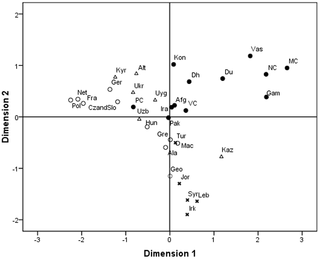 Figure 4. MDS Plot showing genetic relationships particularly between the South Asian populations with the world populations. The North-Western corridor of India has witnessed many waves of migrants from different parts of the world, with a majority being male migrants [31]. Gujarat is located on the western most point of the Indian sub-continent and has acted as a significant corridor to draw outsiders -conquerors, refugees and travellers who have contributed significantly to the present day gene pool of Indian populations [34]. Valsad and Surat districts are part of the tribal belt of Gujarat and are composed of tribal populations which are linguistically classified as Indo-European. To date several studies have provided significant insights into the paternal genetic history of India [23]–[24], [34], [36]; however none till now had taken into consideration the Indo-European speaking tribal populations inhabiting Gujarat in spite of their interesting geographical location and cultural attributes. It is also worth mentioning that the Indo-European speaking tribes of India not only exhibit the complexity of historical interaction between the indigenous Indian and migratory groups but also reflect lack of one-to-one correlation between language, mode of subsistence and social system [23]. Thus, the Indo-European speaking tribes represent an appropriate model to study the possible genetic foot prints of the multiple waves of migrations. In addition to tracing the origin and impact of ancient migrations, evaluation of the impact of geography and social structure in shaping the genetic structure of the present day Indo-European speaking tribal populations of Gujarat was considered equally important. Thus, in the subsequent text we examine the paternal genetic variation of the nine Indo-European speaking tribes from Gujarat using high resolution Y chromosomal unique event polymorphisms (UEPs). |
|
|
|
Post by Admin on Aug 30, 2018 18:59:20 GMT
Genetic structure of study populations Our analysis based on Y chromosomal UEPs apportioned the study samples into 13 haplogroups representing 10 major Y lineages (C5, H1a*, H2, R1a1*, R2, J2, L1, F*, K* and Q3) in India. Haplogroup diversity (0.772) was found to be comparable with Dravidian speaking populations (0.723), but higher than Indo-European speaking populations (0.684) in the country [54]. Given the number of views in support of Austro-Asiatic and Dravidian speaking tribes belonging to the primary pre-historic population of India [7], [11]; the high gene diversity values observed in the study populations, which are in turn comparable to Dravidian speaking populations, are suggestive of greater antiquity, large effective size or role of gene flow in these groups. The analysis of molecular variance revealed that the extent of genetic differentiation was high among study populations which could be attributed to either the lower effective population size of these groups or the Y chromosome making them vulnerable to the effect of genetic drift which further accelerates the process of differentiation between the populations. But, accentuated differentiation due to genetic drift is expected to be accompanied with lower diversity. However, in the present study, elevated levels of gene diversity, rule out a major role of genetic drift in shaping the observed pattern of genetic differentiation. Nevertheless, the explanation for the observation of high gene diversity coupled with high-level of genetic differentiation could lie in an overwhelming genetic admixture from different sources or in an early inflow of genes from a common source followed by rapid population expansion and subsequent fission into isolated, endogamous populations. Results from Harpending and Ward analysis do not appear to favour the former explanation. Thus, the most plausible explanation for the current diversity scenario in the Indian population seems to be the suggestion made by Majumder et al. [17], in which an early demographic expansion of modern humans within India during Palaeolithic period and later fission of the populations is conjectured.  In-situ versus Ex-situ Origin of Y lineages The indigenous versus exogenous origin of Indian paternal lineages has been widely contested. Among the study populations, six sub-haplogroups namely, C5, H1a*, H2, J2, R1a1* and R2 constituted the major paternal lineages that together accounted for 85.92% of the Y chromosomes. While the indigenous origin of sub-clades C5, H1a*, H2 and R2 are accepted, the status of sub-clades J2 and R1a1* are contested as they are believed to have been introduced in India with the demic diffusion of Proto-Dravidian Neolithic agriculturists from West Asia and the influx of Indo-European pastorals from Central Asia. It is worth mentioning here that the high frequency and associated diversity of a haplogroup is correlated with the possible place of origin of a particular haplogroup [55]. In the present investigation haplogroup H, especially H1a, represented the most frequently observed Y chromosomal lineage followed by H2 sub-haplogroup. Its higher frequency among the Indian tribes particularly among the Dravidian speaking tribes of South India and its limited presence elsewhere on the Indian subcontinent had led some scholars to denote it as a tribe-specific haplogroup [36]. However, several subsequent studies have confirmed the presence and equal prevalence of haplogroup H and its associated H1a and H2 branches across linguistically and ethnically diverse populations and in different regions of India, except the North-Eastern region [23]–[24], [54]; thus ruling it out as a tribal-specific marker and supporting the uniform distribution of haplogroup H among Indian populations. An Indian homeland for haplogroup H can also not be refuted keeping in view its higher microsatellite diversity among Indian populations [24]. Haplogroup H has also been reported from Central Asian, West Asian and Gypsy populations in Europe. However, its low frequency and prevalent diversity pattern in Central Asia and West Asia could be due to recent back migration [32], [52]. On the other hand, the established Indian ancestry of gypsy populations is surely the reason for elevated levels of H haplogroup among them [56]. All the observations, therefore clearly point towards in-situ origin of haplogroup H among Indian populations.  Haplogroup C is widely distributed in Eastern and Central Asia, Oceania and Australia [44]. As expected, all the Y chromosomes under C haplogroup belonged to the C5 sub-clade. It was observed in a frequency of 8.45% which is the highest ever reported frequency for C5 in India and whose spread is circumscribed along the coastal belt of India [24], [54]. High STR diversity in India and South-East Asia in the backdrop of haplogroup C has also been observed [34], [57]. Interestingly none of the C haplogroup derivatives frequent in South-East Asia have been reported from India. Therefore, the possibility of introduction of C5 haplogroup from South-East Asia as a result of back migration to India appears doubtful and its indigenous origin appears to be more probable [13]. Haplogroup J is predominantly found among the populations of West Asia, North Africa, Europe, Central Asia, Pakistan, and India [44] and widely linked with the spread of agriculture from the Fertile Crescent that extends from Israel to Western Iraq. In the Indian subcontinent two sub-clades of J - J2a and J2b have been reported. Consistent with the previous studies, a higher proportion of J2 in West India as compared to North and South regions of India has been recorded in the present study [24], [54]. Two models pertaining to the homeland for Indian J2 sub-clades have been contested, West Asia and Central Asia. Cordaux et al. [35] had proposed the Central Asian homeland for Indian J2 sub-clade mainly because of higher frequency of J2 in Central Asia. It is worth mentioning here that J1 sub-clade which appears in appreciable frequency in Central Asia is largely absent from the Indian as well as most of the West Asian populations [44]. Haplogroup R is represented by two sub-clades R1a1* and R2 among the study populations. After haplogroup H1a, haplogroup R1a1* represented the most frequently occurring haplogroup. Haplogroup R is widely distributed in Central Asia, Eastern Europe, West Asia and the Indian subcontinent [58]–[59]. The higher frequency of haplogroup R1a, up to 63% in Central Asia and its relatively lower occurrence in other regions has been linked with Central Asian origin of R1a clade [36]. However, later studies [24], [54] showing higher prevalence of R1a sub-clade along with high microsatellite diversity among the tribal populations of India lend support to probable South Asian origin of R1a sub-clade as suggested by Kivisild et al. [34]. This is further substantiated by almost the complete absence of other derivatives of haplogroup R1 among the Indian populations, which is expected in case of the inflow from Central Asia [23]–[24], [41]. In the present investigation sub-clade R2 occurred with a frequency of 9.51%, which is similar to its frequency reported from other Indian populations [24], [34], [36], [54]. The frequency of R2 decreases as one goes further west from India and its frequency is almost negligible in Europe. Moreover, its frequent occurrence among Dravidian speaking groups as compared to Indo-European or Austro-Asiatic speaking groups of India can be attributed to its indigenous Indian origin. The MDS plot (Figure 4) also reflects the closeness of South Asian populations with West Asian and Central Asian populations possibly due to overlapping of haplogroups. In comparison to the world populations the overall mean haplogroup diversity among the study populations was relatively higher than in the European or East Asian populations [32], [48] whereas it was found to be lower than that of Central Asian and West Asian populations [49], [51]. As mentioned earlier the high frequency and diversity of a haplogroup is indicator of the possible place of origin of a particular haplogroup [55]. Consequently, the observed haplogroups in the present investigation could be apportioned into three Y lineages based on their possible origin. These lineages include Central Asian, West Asian and indigenous Indian Y lineages. Khurana P, Aggarwal A, Mitra S, Italia YM, Saraswathy KN, Chandrasekar A, et al. (2014) Y Chromosome Haplogroup Distribution in Indo-European Speaking Tribes of Gujarat, Western India. PLoS ONE 9(3): e90414. |
|
|
|
Post by Admin on May 28, 2019 19:36:54 GMT
Following the out-of-Africa (OOA) migration, South Asia (or the Indian Subcontinent, here comprising India, Pakistan, Bangladesh, Sri Lanka, Nepal and Bhutan) was probably one of the earliest corridors of dispersal taken by anatomically modern humans (AMH) [1–3]. A remarkable genetic diversity, probably the second highest after sub-Saharan populations [1, 4] supports this view. Although the oldest modern human fossils in South Asia (in Sri Lanka) date to only ~36–28 thousand years ago (ka) [5, 6], genetic and archaeological evidence suggest an arrival of AMH over 50 ka (discussed extensively in Mellars et al. [2]) but after the eruption of Mount Toba in Sumatra ~74 ka, contrary to some suggestions [7]. Whilst some argue for a hint of an earlier dispersal [8], the trace is restricted to Australia/New Guinea, where it amounts to only ~2% of the data, and its significance remains unclear [9, 10].  India, the second most populous country worldwide, includes a patchwork of different religions and languages, including tribal groups (~8% of the population, speaking over 700 different dialects of the Austro-Asiatic, Dravidian and Tibeto-Burman families) and non-tribal populations, who mostly practice Hinduism, grounded in a strictly hierarchical caste system, and speak Indo-European or Dravidian languages. Indo-European is often associated with northern Indian populations, Pakistan and Bangladesh, and a putative arrival in South Asia from Southwest Asia ~3.5 ka (the so-called “Indo-Aryan invasions”) has been frequently connected with the origins of the caste system [11, 12]. Although some studies suggested a greater affinity of upper castes to European and Southwest Asian populations than lower castes [13, 14], genetic data have provided no clear evidence for the “Indo-Aryan invasions” so far [15], and their very existence is challenged by many archaeologists [16]. South India, on the other hand, is dominated by Dravidian languages, which have been connected to Neolithic dispersals from Southwest Asia [1, 12, 17], although the South Asian situation is complex and others have argued for indigenous development of agriculture within the Dravidian heartland [18, 19]. Generally, India displays a high level of endogamy, a result of its strict social boundaries, and high genetic drift due to long-term isolation [20] which, combined with a very complex history, makes the genetic study of Indian populations challenging. Many recent genetic studies explored different layers of South Asian genetic diversity and population structure [2, 13–15, 17, 21–26], but they have tended to focus on one or other marker system and, as a result, decisive results on the details of the settlement process are still lacking.  In the last few years, genome-wide (GW) studies have been employed [27–29]. However, it remains difficult to make inferences concerning the timing and direction of migrations from GW results, without including ancient DNA (aDNA) data (still lacking for South Asia), and for India the results have been contradictory, especially for differentiating amongst various migration waves at greater time depths. There is a way forward, despite the current lack of aDNA. The maternally inherited mitochondrial DNA (mtDNA) allows researchers to identify specific lineage clusters (clades or haplogroups) and to correlate them with geography. By applying a reliable mitogenome molecular clock [30], it is then possible to date migration events and uncover fine demographic patterns that would otherwise be missed. Previous studies [2, 31, 32] revealed that South Asian mtDNA diversity consists largely of basal autochthonous lineages of the OOA founder haplogroups M and N (the latter mostly from the derived haplogroup R) [20]. Moreover, similar analyses can be carried out for the paternally inherited Y-chromosome variation, and comparisons of the two systems can detect sex bias in dispersal patterns. To assess the phylogeographic patterns of South Asian mtDNA lineages, we compiled mitogenomes from South Asia and neighbouring regions available in the literature, complemented with samples from the 1000 Genomes Project (1KGP) [33] and the Human Genome Diversity Project (HGDP) [34], including understudied populations from Pakistan, Sri Lanka and Bangladesh, combined with several newly sequenced samples. We aimed to provide a refined mtDNA phylogeographic portrait of South Asia, including most crucially an assessment of the extent of genetic influx from other regions (primarily Southwest and Central Asia), in order to assess the impact of immigration during the Late Glacial, postglacial, Neolithic and Bronze Age periods in shaping genetic diversity and structure in South Asia. For a comprehensive overview across the genome, we have also carried out several fresh analyses of GW patterns across the regions of Southwest, Central and South Asia, and assessed sex-biased gene flow in the region by direct comparison across the same sample sets, using the 1KGP data now available for GW, mtDNA and Y-chromosome diversity. |
|
|
|
Post by Admin on May 29, 2019 17:55:24 GMT
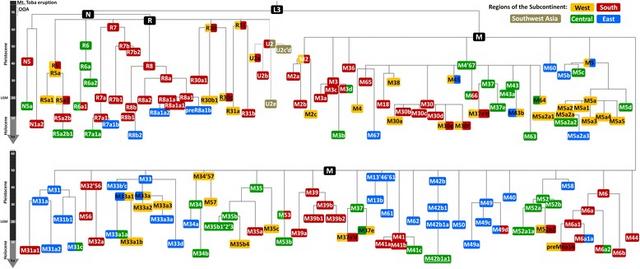 Fig. 1 Schematic phylogeny of South Asian autochthonous mtDNA haplogroups, based on ML age estimates. Node ages for haplogroup U2 were estimated in an independent analysis. Colours correspond to the putative origin of each branch Although haplogroup M in Asia has been shown to depart from a strict molecular clock [62], we found no evidence for a clock violation when performing a LRT (p > 0.05). Curiously, however, we found violations to the molecular clock for South Asian R lineages (p < 0.00001). Since ML analysis is partly based on the tree structure, it averages the branch lengths and provides similar estimates to a previous relaxed clock [63]. The values indicated throughout the text are therefore ML estimates (corrected for purifying selection). This is not observed in the global mtDNA tree [30, 64] and seems peculiar to the haplogroups in South Asia, due to demographic effects, as we argue below. There are two major founder clades detected in South Asia (haplogroup N is very rare and its age does not correspond to a founder age). As previously, the age of haplogroup M, at 50.1 [44.8; 55.5] ka, and R, at 64.5 ka [55.9; 73.2] are younger than the Mount Toba eruption (~74 ka), suggesting a later arrival [2]. Haplogroup R and several of its subclades (R7, R30, R31) appear older than M, but this may be illusory—see below. The older clades in R predominate in the west and south of the Subcontinent, supporting a southern coastal route of primary colonization [1–3]. The phylogeography of haplogroup M is complex. While some older lineages (e.g. M2, M6, M32’56, M36, M39) originated in the western or southern regions of the Subcontinent (similarly to R), others trace to central India (M4’67, M35, M52) or the east (M13b, M31, M42b, M61, M49, M50 and M60). We need to tease out these more detailed patterns to explain the discrepancy in the age estimates. If we perform regional estimates simply by considering all samples of each region, no discernible patterns are apparent, with M age estimates in the south and east showing similar ages (Table 2). However, when we take into account the inferred source for each clade and repartition the data on that basis, the re-estimated age for M in the west becomes 55.3 [45.1; 65.9] ka—higher than across the rest of the Subcontinent (Table 2). This suggests an early expansion in the west, similar to R, and a common origin and spread of both M and R along the southern coastal route, as also suggested recently from analyses of ancient DNA (aDNA) [65]. Although M has previously been dated to an earlier age in East Asia [30, 66], the lower age of M in the east of the Subcontinent versus the west argues against an eastern origin of M as recently proposed [35]. Table 2 Age estimates (in ka) of haplogroup M in different regions of South Asia: (1) using the raw modern geographic distribution and (2) considering the most probable origin of each major haplogroup and including only basal lineages of each region ML ρ whole mtDNA ρ synonymous clock West 47.7 [41.3–54.2] 37.4 [31.6–43.2] 39.0 [28.8–49.2] South 47.2 [41.5–53.1] 42.4 [36.7–48.3] 40.0 [31.4–48.6] East 47.7 [42.5–53.0] 42.4 [38.4–46.6] 43.9 [37.1–50.8] Central 43.6 [38.1–49.1] 40.8 [35.4–46.3] 41.4 [33.0–49.7] (2) West 55.3 [45.1–65.9] 44.5 [32.5–57.0] 50.6 [29.7–71.4] South 48.9 [42.1–55.8] 47.5 [39.2–56.0] 41.1 [29.6–52.6] East 45.2 [38.8–51.8] 40.8 [34.6–47.0] 40.1 [31.3–48.9] Central 39.5 [31.9–47.2] 33.0 [26.8–39.3] 34.80 [23.2–46.5] This result suggests that an ancient western ancestry may have been disguised by further re-expansions of haplogroup M in South Asia. Several branches of M (M38, M65, M45, M5b, M5c, M34, M57, M33a) display signals of dispersals from the east and the centre dating to ~45–35 ka, and M4’67 (which is only separated by a single mutation from the root of M), with a possible origin in central India, displays an extraordinary multi-branching structure dating to 38.0 [30.1; 46.0] ka, suggesting a major expansion at that time. If we consider that a root type of M could have survived for ~10,000 years after it arose (as is evident from modern clades within that age range), it is plausible that re-expansion created a secondary founder effect within M that decreased the overall age estimates. Such a scenario would impact even more on ρ than ML estimates, which is indeed what we see (Table 1). An expansion 45–35 ka would also fit well with the palaeoenvironmental and archaeological evidence [2, 67, 68], and is further supported by an increment in N e associated with M across South Asia from ~40 ka (Additional file 1: Figure S1). The next major discernible signal in indigenous lineages begins ~12 ka, at the Pleistocene/Holocene transition. Various star-like clades dating 12–9 ka suggest a rapid expansion across the Subcontinent, namely M6a1a (11.4 ka), M18a (9.2 ka), M30d (12.1 ka), R8b1 (11.6 ka) and U2b2 (9.2 ka), all from a southern source; and R30c + 373 (12.4 ka), from the west. An increment in N e is also observed at this time in the BSP for haplogroup M in the west and south (Additional file 1: Figure S1). We also see a further increment in the last few millennia. BSPs for M in the west and centre show an increment in the last 2.5 ka (Additional file 1: Figure S1), associated with the emergence of several subclades in the west (M2a3a + 4314, M2a1b, M2c + 1888 + 146, M30a2, M5a3b, M6a1 + 5585 + 146 + 1508) and centre (M2a1a1b, M3b, M3a1a, M63, M5a2a2 + 234, M5a3a and M61a + 5294). |
|
|
|
Post by Admin on May 30, 2019 18:29:11 GMT
West Eurasian mtDNA lineages in South Asia: Multiple dispersals from the northwest since the LGM Prehistoric West Eurasian lineages make up almost 20% of the South Asian genetic pool overall. LGM and Late Glacial arrivals The earliest genetic evidence of movements into the Subcontinent after the first settlement is seen in haplogroup N1a1b1, which dates to ~21 ka (Additional file 1: Figure S2), with a probable source in the Near East [69]. Other haplogroups with similar age estimates and a Near Eastern source (pre-HV2, HV + 146!, HV + 9716, HV + 73!, pre-U1c, U1a1, J1d and a basal clade within T2) may have moved eastwards in the same time frame (Table 1, Additional file 1: Figure S2), corresponding to 2.6% in the overall South Asian 1KGP data. Further Near Eastern clades (W4, HV + 16311!, HV12b, I1, U7a and J1b1b1) spread to South Asia in the Late Glacial period, 16–13 ka (Table 1, Additional file 1: Figure S2), with frequencies of 4.5% in the South Asian 1KGP data. Early postglacial arrivals At ~12 ka, when various indigenous lineages show signals of expansion, we also observe further lineages arriving from Southwest Asia with exclusively South Asian branches (T2e2, T2 + 195 + 4225, W3a1 + 143, W3a1b, U1a3 + 10253, N1a2, U7a + 12373 and U7a3a + 6150) (Table 1, Additional file 1: Figure S2). Furthermore, South Asian lineages are nested within numerous other branches with similar node age estimates (W6, T2b, T2d1a, U7b + 16309! and K1a1b2a), allowing us to circumscribe the arrival times (Table 1, Additional file 1: Figure S2). These lineages represent a frequency of 4.7% in the South Asian 1KGP dataset. Neolithic arrivals More lineages entered the Subcontinent ~9–5 ka, representing putative Neolithic markers with a distinct origin in Anatolia, the Caucasus and Iran, again harbouring distinctive nested South Asian subclades (K2a5 + 2831 + 189, HV14 + 150, H13a2a + 8952, K2a5 + 2831, X2 + 153! + 7109 and U1a3a) (Table 1, Additional file 1: Figure S2) (3.4%). There is also evidence of movements from the Arabian Peninsula/Near East; the branch R0a2 + 11152 (~7.1 ka) is the most striking example. One case, H2b, might trace its source to Eastern Europe and may have entered South Asia through Central Asia a little later, as we discuss below. Bronze Age arrivals In the last 4 ka, most genetic influx on the maternal line was restricted to Pakistan and traces mostly to Iran (H29 + 9156 + 4689, R2a + 7142 and U1a1a2a) (2.4% in South Asia, reaching 5.4% in the western populations). Gene flow at this time was clearly bi-directional, as seen in the expansion west of lineages M5a2a4, U2c1b + 146 and M3a1b + 13105). This is reflected in the genome-wide ADMIXTURE analysis (below), where the autochthonous South Asian component (green in Fig. 2a) appears at low levels in Iran. As an aside, the bulk of Romani lineages belongs to the branch M5a1b1a1 [70] at 3.0 ka, supporting previous linguistic and genetic evidence for a South Asian origin for the Romani diaspora [70, 71] in the west of the Subcontinent. 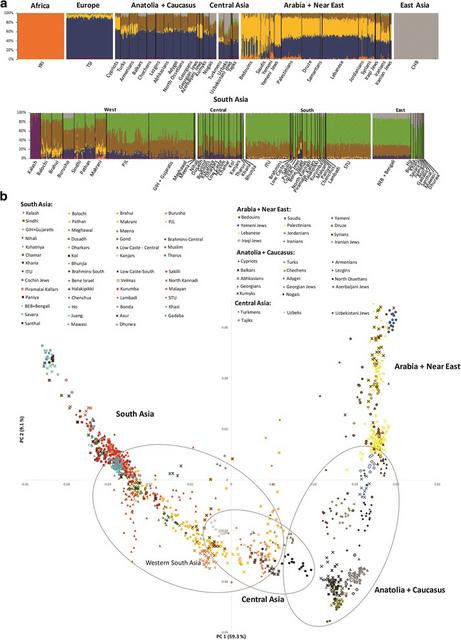 Fig. 2 a ADMIXTURE analysis for K = 7. b PCA of South Asian populations. Detailed information on the populations included in the Additional file 1: Table S3. Note that the three typical European components are not detected here in the Tuscans, probably due to the small overall European representation in the analysis GW overview of South Asia South Asian populations can be distinguished in both the ADMIXTURE and sNMF analyses from K = 3 (Additional file 1: Figure S3 and Figure S4), highlighting the distinctive genetic diversity of the region. At the highest likelihood value of K = 7 (Fig. 2a and Additional file 1: Figure S5a), the overall pattern is straightforward and clinal [72], with a substantial autochthonous component (shown in green) across the region, apart from the Kalash, which display a virtually exclusive component probably caused by localised genetic drift in a small, isolated population [72, 73]. A striking feature in both the ADMXTURE and sNMF analyses (for K = 7) is the much higher fraction of West Eurasian components (brown, yellow and dark blue) in the western (especially Pakistani) South Asian populations. The main non-autochthonous component in the Subcontinent, the Iran/Caucasus/Steppe component (brown), exceeds 35% in Pakistan and Gujarat [23–25], although it reaches most of the Subcontinent. This component approaches ~100% in Late Palaeolithic and Mesolithic remains from the Caucasus, and was therefore dubbed the “Caucasus hunter–gatherer” (CHG) component [74], but it is seen at similarly high frequencies in remains from Mesolithic and Neolithic Iran [75] and at ~50% in Early Bronze Age Yamnaya pastoralist remains from the Pontic-Caspian steppe [53, 76], as shown in Additional file 1: Figure S6 for K = 7 (lowest cross-validation error, Additional file 1: Figure S5b). The Pakistani Muslim Balochi, Brahui and Makrani carry ~15% of the Near Eastern/Arabian component (yellow), which is carried across Europe with the spread of the Early Neolithic [75, 77]. However, this component is virtually absent in other South Asians (including Muslims) except for Jewish groups (supporting previous mtDNA evidence for little genetic input from Arabia into Indian Muslim populations [78]).  The PCA (Fig. 2b) portrays a complex gradient of affinities, but with South Asians closer to Central Asian and Caucasus groups than to those from the Near East or Arabia. Pakistani populations occupy an intermediate position, particularly close to the currently Turkic-speaking peoples of Central Asia (the Turkmens, the Nogais and the Uzbeks) and the Indo-Iranian-speaking Tajiks in PC1 (which accounts for 59.3% of the variation). Genetically, Turkic-speaking groups resemble their geographic neighbours, indicating deep local ancestry and recent language shift [79]. The current paradigm for explaining modern Indian population structure suggests that they derive from admixture between two main ancestral populations, Ancient North Indians (ANI) and Ancient South Indians (ASI) [25], with the proximity of Pakistani groups and Gujaratis to Southwest Asians due to high levels of ANI ancestry [25], which my have arrived in two waves [24]. However, our mtDNA results (and the current GW analysis) suggest that the process is likely to have been much more complex. The profile for Pakistani populations is likely the result of at least four waves of dispersal into the region, involving all three of the inferred ancestral West Eurasian components, from at least as far back as the LGM through into the Bronze Age. The Yamnaya aDNA samples are scattered around the Central Asian and Pakistani groups (Additional file 1: Figure S8), confirming the ADMIXTURE results (Additional file 1: Figure S6), and suggesting links between the Bronze Age Steppe and today’s Central Asia and Indian Subcontinent. Pakistanis and Gujaratis appear much more scattered in PC1 than other South Asians, which only show substantial divergence in the lower-weight PC2 (9.1%) and PC3 (6.3%) (Fig. 2b, Additional file 1: Figure S7). |
|


