|
|
Post by Admin on Apr 23, 2023 16:41:35 GMT
The most differentiated McSCs can dedifferentiate On the basis of these analyses, we formulated the following hypothesis. McSCs may differentiate into an intermediate differentiation (TA-like) state at the whole population level in the growing HG following cues of regenerative stimuli, and McSC maintenance may rely on their dedifferentiation. To test this hypothesis, we sought to trace the fate of the most differentiated subset of HG McSCs. We focused on a late-pigmentation gene, Oca2 (refs. 33,34,35), that is not expressed by quiescent telogen McSCs but is upregulated in all mature bulb melanocytes based on our scRNA-seq data (Fig. 2e,f). Notably, a small subset of early-anagen McSCs also expressed Oca2 (Fig. 2e,f). To confirm that Oca2+ McSCs are more differentiated than Oca2– McSCs in early-anagen HFs, we reanalysed scRNA-seq data in which Oca2+ cells had diverged from other early-anagen McSCs by regressing out cell cycle genes (Fig. 2g). Analyses revealed that differentiation markers (that is, pigmentation genes) were expressed at higher levels in Oca2+ than in Oca2– McSCs (Fig. 2h). Unlike Oca2+ bulb melanocytes, the Oca2+ early-anagen McSCs retained expression of genes shared by telogen and other early-anagen McSCs (Extended Data Fig. 6). These results suggest that whereas most HG melanocytes at the early-anagen phase initiate the upregulation of differentiation and pigmentation genes, the most differentiated ones also express Oca2 (Fig. 2i). We then generated Oca2creER;RosaLSL-tdTomato reporter mice as a means to genetically trace the fate of Oca2+ HG McSCs (Extended Data Fig. 7a). No tdTomato+ cells were observed in the HFs of mice that did not receive a tamoxifen injection (Extended Data Fig. 7b). Using this new tool, we traced the fate of McSCs from anagen onset onwards. We treated Oca2creER;RosaLSL-tdTomato mice with tamoxifen once daily for 3 days during early anagen (Extended Data Fig. 7c). This treatment successfully labelled Oca2+ (tdTomato-labelled) McSCs, which displayed dendritic morphology, expressed Oca2 mRNA and were found in the HG (Fig. 3a and Extended Data Fig. 7d,e). Oca2+ cells included both proliferative and nonproliferative McSCs (Extended Data Fig. 7f), results that are consistent with our scRNA-seq data (Extended Data Fig. 5d,e). Fig. 3: Oca2+ cells located in the TA compartment can undergo dedifferentiation during anagen. 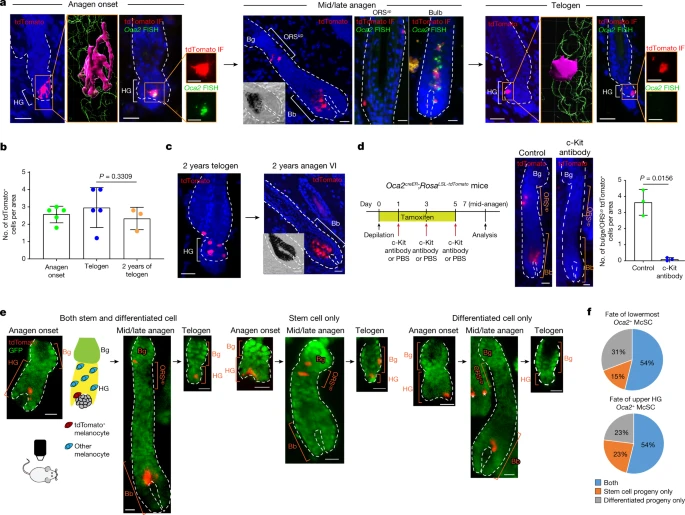 a–c, Oca2creER;RosaLSL-tdTomato mice were injected with tamoxifen three times during depilation-induced anagen onset for Oca2+ cell lineage tracing. a, Detection of tdTomato and Oca2 (fluorescence in situ hybridization (FISH)) as indicated. Denoted areas of tdTomato-only detection are reconstructed using Imaris (magenta, tdTomato+; green, DAPI). Magnified views of tdTomato immunofluorescence (IF) and OCA2 FISH are represented in single colour. b, Number of tdTomato+ cells over time. N = 5 mice (anagen onset and telogen) and N = 3 mice (2-year telogen). Five areas were analysed per mouse. P values were derived using one-way ANOVA with Bonferroni multiple comparison test, with 95% confidence intervals of −0.7397 to 1.993. c, Detection of tdTomato in telogen and induced anagen at 2 years following tamoxifen treatment. d, Left, timeline of injections and analysis 7 days after depilation of tdTomato expression in Oca2creER;RosaLSL-tdTomato mice treated with PBS (control) or a c-Kit-neutralizing antibody. Right, images and quantification of tdTomato+ McSCs. N = 3 mice. Ten areas were analysed per mouse. P value derived by two-tailed unpaired t-test. e, Live lineage tracing of a single tdTomato+ cell of Oca2creER:RosaLSL-tdTomato;K14rtTA:tetOH2B-GFP mice reveals three fates. GFP marks K14+ epithelial cells. Cartoon illustrates the relative locations of tdTomato+ melanocytes and other melanocytes in the HF. White asterisks indicate tdTomato+ cells in an unrelated HF. f, Percentages of single Oca2+ cells in the lowest HG region (N = 13 HFs from 1 mouse) or the upper HG (N = 13 HFs from 1 mouse) that give rise to specific progeny as defined. Insets in mid/late anagen images in a and c show bright-field images of the bulb. For b and d, data are presented as the mean ± s.d. Scale bars, 20 μm or 10 μm (single colour images of a). Dashed white lines outline the epithelial–dermal boundary (a,c,d,e). Once the HF fully formed the anagen bulb, cells initially labelled for Oca2 (tdTomato+) in the HG had contributed to both differentiated melanocytes in the hair bulb and to McSCs in the anagen bulge/ORSup (Fig. 3a and Extended Data Fig. 7g,h). By mid-to-late (mid/late) anagen, tdTomato+ cells within the bulge/ORSup niche reverted to an Oca2– state (Fig. 3a), and other differentiation markers (that is, pigmentation genes) such as Gpr143 were downregulated (Extended Data Fig. 7i). By the subsequent telogen phase, most tdTomato+ cells had relocated to the HG (Extended Data Fig. 7j) and retained their undifferentiated state (Fig. 3a). These tdTomato+ McSCs retained the ability to regenerate bulb melanocytes for at least 2 years (the final time point examined; Fig. 3b,c). In agreement with our scRNA-seq data (Extended Data Figs. 5f and 6), those HG Oca2+ McSCs destined for dedifferentiation retained their expression of stem-cell-enriched genes (for example, Col12a1, Txnip and Cdh1 (which encodes E-cadherin)), whereas those destined for final maturation in the bulb lost expression of these genes (Extended Data Fig. 7i). Lineage tracing of late-anagen Oca2+ differentiated bulb melanocytes confirmed the live-imaging results that bulb melanocytes do not persist (Extended Data Fig. 8). These results demonstrate that highly differentiated Oca2+ McSCs in the HG but not mature bulb melanocytes can dedifferentiate to give rise to undifferentiated McSCs in the niche. |
|
|
|
Post by Admin on Apr 24, 2023 16:50:45 GMT
Dynamic niche regulates McSC reversibility We next investigated the mechanisms that enable McSC dedifferentiation. Previous studies have shown that constitutive activation of WNT in McSCs leads to their untimely differentiation and eventual loss, whereas inhibition of WNT leads to deficient melanocyte regeneration7,39,40. WNT ligands are upregulated in the HG at anagen onset to promote McSC differentiation7,15,41,42. As the HG cells grow down to form the HF bulb, the WNT active area also moves down as the anagen phase progresses (Extended Data Fig. 11a). Nonetheless, our live imaging demonstrated that HG McSCs can translocate to the anagen bulge/ORSup (Figs. 1c and 3e and Extended Data Fig. 2b), where WNT signalling is known to be suppressed. We proposed that downregulation of WNT ligands following migration to the bulge/ORSup may permit the dedifferentiation of McSCs. 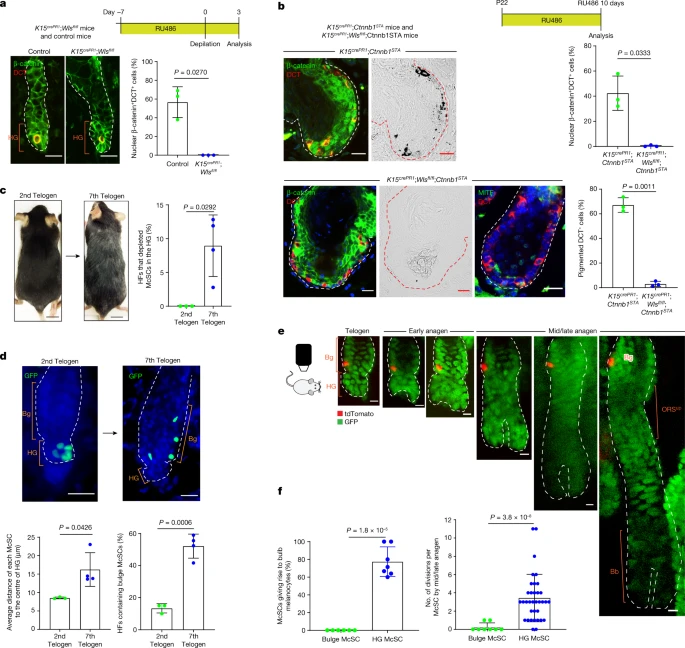 Fig. 4: HF ageing limits the access of McSCs to niche signals that reversibly regulate their differentiation. First, to understand how WNT status correlates with differentiation status, we examined scRNA-seq data. The analysis showed that WNT activation genes were upregulated during early anagen, especially in late-stage Oca2+ McSCs (Extended Data Fig. 11b,c). Immunofluorescence data confirmed that Oca2+ McSCs activate WNT signalling in anagen onset HG (Extended Data Fig. 11d–f). Notably, WNT signalling was subsequently downregulated by mid/late anagen in the bulge/ORSup regardless of UVB irradiation (Extended Data Fig. 11d–f). Second, we verified whether persistent WNT activation in anagen Oca2+ McSCs precludes reversion to an undifferentiated McSC state. Constitutive activation of WNT signalling by expressing stabilized β-catenin (encoded by Ctnnb1) in Oca2+ McSCs (from Oca2creER;Ctnnb1STA;RosaLSL-tdTomato mice43) showed that in this environment, these cells survived and inappropriately continued along the differentiation pathway to express pigment after translocation into the anagen bulge/ORSup (Extended Data Fig. 12a,b). By contrast, normal Oca2+ cells reverted to an undifferentiated state (Extended Data Fig. 12a,b). Thus, downregulation of WNT activity permits the dedifferentiation of Oca2+ McSCs. When followed up long term, tdTomato+ McSCs in the β-catenin stabilized mice showed a significant reduction (Extended Data Fig. 12c), a result consistent with previous work demonstrating that long-term WNT activation depletes McSCs7. Last, to confirm that WNT active status is regulated by epithelial niche cells, we used K15crePR1;Wlsfl/fl mice to inducibly delete Wntless (Wls) and prevent WNT ligand release specifically from K15+ epithelial cells that surround McSCs in the bulge and HG7,44,45,46. Following induction with RU486 and subsequent anagen onset, these mice exhibited defects in nuclear β-catenin expression in McSCs and in surrounding epithelial cells (Fig. 4a). This result suggested that epithelial-derived WNT ligands have an essential role in McSC WNT activation. To ensure that only McSCs were disrupted in WNT activity, we also examined McSCs in RU486-treated K15crePR1;Wlsfl/fl;Ctnnb1STA mice43, in which Wls is deleted but β-catenin signalling is retained in epithelial cells. Previously published results7 and Fig. 4b show that constitutive WNT activation in control RU486-treated K15crePR1;Ctnnb1STA HFSCs resulted in aberrant but pigmented HF development. However, in mice lacking Wls, epithelial niche cells showed WNT activation and nuclear β-catenin localization, despite their inability to secrete WNT ligands (Fig. 4b). By contrast, DCT+ melanocytes did not exhibit nuclear β-catenin, they did not express the melanocyte differentiation marker MITF or produce pigment (Fig. 4b). These results demonstrate the requirement of epithelial WNT ligands for McSC WNT activation. Together, these findings show that niche-derived WNT ligands regulate the reversible differentiation of McSCs. |
|
|
|
Post by Admin on Apr 26, 2023 19:02:20 GMT
Repetitive plucking increases dormant bulge McSCs
The above results suggest that the ability of McSCs to translocate between the stem cell (WNT– bulge/ORSup) and TA (WNT+ HG/bulb) compartments of the HF may enable them to reversibly attain distinct differentiation states. However, our live imaging showed that not all McSCs originating from the HG home back to the HG compartment at the next telogen phase but rather remain in the telogen bulge (Figs. 1c,g and 3e and Extended Data Fig. 7j). Given the high prevalence of hair greying in humans and mice, we investigated whether this shift in distribution of HG McSCs might correlate with ageing.
To this end, we experimentally accelerated the ageing of HFs by repeated depilation of DctLacZ mice and DctrtTA;tetOH2B-GFP mice at every telogen phase starting from postnatal day 21 (P21)17,18,47. Consistent with previous studies1, we detected HFs with significant loss of McSCs, which was evident in the HG by the seventh telogen phase (Fig. 4c). As expected, these mice displayed hair greying (Fig. 4c). Notably, many McSCs in aged HFs had changed location and were scattered to the bulge rather than being tightly aggregated within the HG compartment (Fig. 4d and Extended Data Fig. 13a,b). Image analyses revealed that the distance between individual McSCs was greater in aged HFs than in young HFs (Fig. 4d). The percentage of HFs containing bulge McSCs increased from 10% to more than 50% (Fig. 4d). A similar observation was noted when we examined Oca2creER;RosaLSL-tdTomato mice following repeated plucking (≥6 hair cycles) (Extended Data Fig. 13c–e).
To understand whether such abnormal McSC distribution can affect the regeneration of mature melanocytes, we specifically traced the rare bulge McSCs in young telogen HFs through live imaging and assessed their ability to generate differentiated melanocytes. Telogen bulge McSCs gave rise only to bulge/ORSup McSC progeny, without contributing to the differentiated melanocyte compartment (Fig. 4e,f). Moreover, bulge McSCs either remained quiescent or underwent limited division to give rise to McSC progeny (Fig. 4e,f). This was in contrast to HG McSCs, which actively proliferated to regenerate progeny in both stem cell and differentiated cell compartments (Figs. 1c,d and 4f). These results reveal that telogen bulge McSCs, which do not directly contribute to bulb melanocyte regeneration, increase during HF ageing induced by repetitive hair regeneration.
Discussion
Collectively, our data demonstrate that the McSC system is a thin-layered system in which HG McSCs act as both stem cells and TA cells at the onset of regeneration. The findings reveal a new model whereby dedifferentiation plays an integral part in homeostatic stem cell maintenance (Extended Data Fig. 11f).
This new model of McSC maintenance highlights a previously unknown level of plasticity. We also identified the vulnerability of this system compared with most other stem cell systems that operate through multilayered distinct stem cell and progenitor cell populations with separate functions and locations. McSCs need to be mobile to demonstrate their chameleon-like features, whereby they display a TA phenotype when located in the TA compartment of the HF (the growing HG area) and then a stem cell phenotype once translocated into the stem cell compartment of the HF (Extended Data Fig. 11f). Therefore, HFSC and McSC organization during tissue regeneration may appear to be parallel when stem cell and TA cells are defined by their differentiation phenotype. The crucial difference between these two stem cell systems is that McSCs, which exhibit the TA phenotype in regard to differentiation status and location, can move back and dedifferentiate into stem cells. However, we also demonstrated that McSC movement between the stem cell and TA compartments is not precisely recapitulated during repeated regenerations, resulting in the accumulation of McSCs that fail to undergo this movement during HF ageing.
Previous studies have demonstrated that positions of individual adult stem cells within the niche are unfixed or interchangeable in the HFSC and intestinal systems12,26,48. Because McSCs regenerate hair melanocytes only when they are within the HG compartment, their proper localization would be required to prevent hair greying. Current theory proposes that McSCs accumulate genotoxic damage during ageing and are gradually eliminated over time through terminal differentiation in response to anagen niche signals49. As such, pro-differentiation signals are likely to be concentrated in the HG compartment7, and bulge McSCs, when they exist, may have a higher survival rate owing to reduced exposure to such differentiation stimuli. Under extraordinary conditions, bulge McSCs might act as a valid source of melanocyte production for hair re-pigmentation, but relocation closer to the HG would be a prerequisite for this.
Last, tumours derived from melanocytes (melanomas) retain self-renewal ability regardless of their fully differentiated, pigmented phenotype50,51, which is unlike many other tumours, including epithelial cancers. Because of this difference, melanomas are difficult to eliminate and represent the most dangerous form of skin cancer. This study has provided evidence for the plasticity of normal McSCs under physiological conditions. An implication of this finding is that this marked capacity of normal melanocytes to retain self-renewal ability after undergoing differentiation could at least partially underlie the plastic nature of melanoma.
|
|
|
|
Post by Admin on May 5, 2023 19:36:58 GMT
Distribution of two OCA2 polymorphisms associated with pigmentation in East-Asian populations Abstract Two OCA2 polymorphisms (rs1800414 and rs74653330) have been associated with pigmentation in East Asians. We explored the distribution of these markers in a panel of samples from populations around the world. The derived allele of rs1800414 has high frequencies in a broad East-Asian region, whereas the derived allele of rs74653330 is primarily restricted to northern East Asia. Our data suggest that these polymorphisms may have been selected independently in different regions of East Asia. Although pigmentation varies globally, it has been more thoroughly studied and is therefore better understood in European populations. This has led to a research gap, especially in East-Asian populations. The OCA2 gene, which is thought to be responsible for maintaining pH levels within melanosomes,1 has been shown to be under positive selection in both European and East-Asian populations.2,3 However, the variants and haplotypes favored by selection are different in each population.2,4–6 For example, a variant located within the HERC2 gene is known to affect the expression of the nearby OCA2 gene, and it is strongly associated with blue eyes in European populations.7–9 The HERC2 rs12913832 allele associated with blue eyes has a high frequency in Europe but is not present in East-Asian populations.7–9 In addition, two non-synonymous polymorphisms, rs1800414 and rs74653330, have been associated with pigmentation in East Asians5,10,11 and are not found at high frequencies in any population outside of East Asia.12 It has been suggested that the phenotype of lighter skin is a result of convergent evolution in Europe and East Asia.2,6,13 Available population data indicate that the rs1800414 and rs74653330 polymorphisms show a distinct geographical distribution. The highest frequencies of the derived rs1800414 G allele are found in Japan, China and Korea, whereas the derived rs74653330 A allele has the highest frequencies in northern East Asia, including Mongolia.12,14 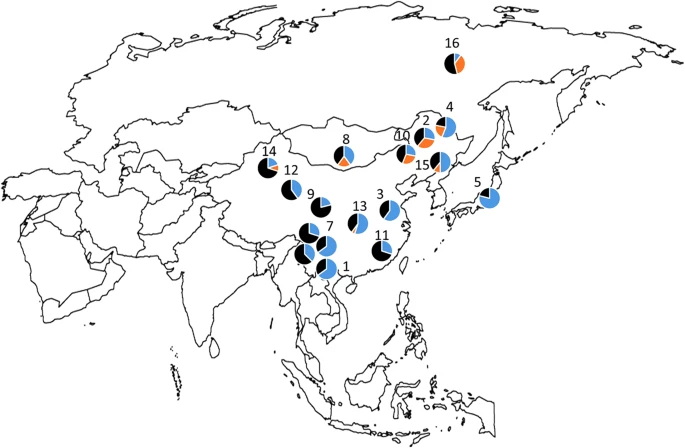 Figure 1 Distribution of allele frequencies for SNPs rs1800414 (blue) and rs74653330 (orange) in East-Asian populations: (1) Dia; (2) Daur; (3) Han; (4) Hezhen; (5) Japanese; (6) Lahu; (7) Miaozu; (8) Mongola; (9) Naxi; (10) Oroqen; (11) She; (12) Tu; (13) Tujia; (14) Uyghur; (15) Xibo; (16) Yakut; (17) Yizu; and (18) Cambodia. In this report, we provide further data on the global distribution of rs1800414 and rs74653330, with a primary focus on the allelic frequencies observed in East Asia. Briefly, the two polymorphisms were genotyped in the Human Genome Diversity Project–Centre d’Étude du Polymorphisme Humain (HGDP–CEPH) samples (http://www.cephb.fr/en/hgdp_panel.php) by LCG Genomics (Beverly, MA, USA) by using KASP genotyping technology. The HGDP–CEPH panel includes samples for more than 1,000 individuals from 52 populations around the world. Supplementary Table 1 shows the allelic frequencies of both markers in the HGDP–CEPH panel. In agreement with previous data, both polymorphisms are primarily restricted to East-Asian populations. The derived rs1800414 G allele has a broad distribution in East Asia, with the highest frequencies observed in the Japanese population (79%) and several populations from China (Dai, Miaozu, Han, Hezhen, Tujia and Xibo, with frequencies between 65 and 50%). In contrast, the distribution of the derived rs74653330 A allele is more restricted, with the highest frequencies found in Altaic speaking populations from northern East Asia and Mongolia, such as the Yakut from Siberia (36%), the Daur (33%), the Oroqen (28%), the Hezhen (22%) and the Mongola (20%). Figure 1 shows a map of East Asia with the frequencies of both polymorphisms. The derived rs1800414 G and rs74653330 A alleles are not present in any of the samples from Africa, the Middle East or Oceania. In the Americas, the rs1800414 G allele is also absent, and one Maya individual is heterozygous for rs74653330. Both derived alleles are present at very low frequencies in Central–South Asia (rs1800414 G: 4.4%; rs74653330 A: 2.1%) and Europe (rs1800414 G: 0.3%; rs74653330 A: 1%). Within Central–South Asia, the derived alleles are primarily present in the Hazara (Pakistan) and Uygur (China). Within Europe, the derived alleles are observed only in Russia. The presence of the two derived alleles in some of the populations from Central–South Asia and Europe seems to be the consequence of gene flow from East-Asian groups. www.nature.com/articles/hgv201558 |
|
|
|
Post by Admin on May 6, 2023 19:14:11 GMT
It is interesting to note that the frequency distribution of the rs74653330 A allele reflects the present genetic structure at a genome-wide level in East Asia. We used the program PLINK15 to perform principal component analysis (PCA) of the East-Asian CEPH–HGDP populations by using genome-wide data (Affymetrix Axiom Human Origins Array) available in the HGDP–CEPH website (http://www.cephb.fr/en/hgdp_panel.php). We pruned SNPs based on linkage disequilibrium (LD) and removed five known areas of long-range LD. Figure 2 shows a visualization of the first two axes of the PCA using the program PAST (http://folk.uio.no/ohammer/past/). There is a clear geographic pattern with the northern populations (Yakut, Oroqen, Mongola, Daur and Hezhen) present on the left side of the plot. As described above, it is precisely in these populations in which the highest frequencies of the derived rs74653330 A allele are observed. Figure 2 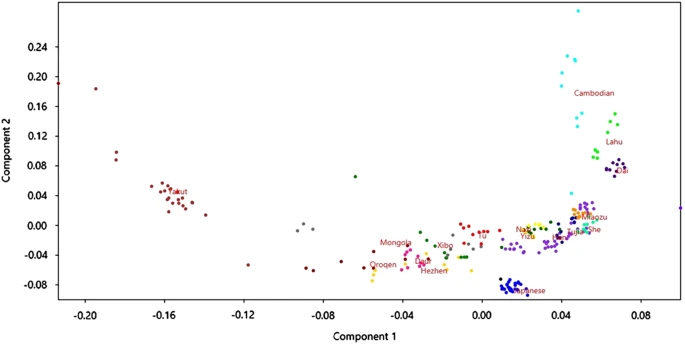 PCA (axes 1 and 2) showing population structure of East-Asian populations from the CEPH–HGDP panel. We explored the haplotype structure of the OCA2 region in East Asia in detail. To do this, we merged the genotype data of the two markers of interest with the Affymetrix Human Origin data set for chromosome 15 plus the Illumina (San Diego, CA, USA) 650K data set for chromosome 15. The OCA2 gene was extracted from this data set by selecting markers from chromosome 15, position 25–26.5 Mb. On the basis of the north–south geographical gradient observed in the PCA output as well as the geographic distribution of the two polymorphisms, the haplotype analysis of East Asia was carried out separately in northern East Asia and the rest of East Asia. Populations that were included in the northern grouping included the Yakut from Siberia and the Oroqen, Mongola, Daur and Hezhen from northern China. The haplotype analyses were performed with the program Haploview.16 Figure 3 shows the haplotype structure surrounding the rs1800414 and rs74653330 polymorphisms. The two non-synonymous polymorphisms are located in the same LD block, but they are always found in different haplotypes. The haplotype analysis suggests that the haplotypes carrying the derived alleles for each polymorphism arose independently from the same ancestral haplotype. Using the markers rs7170451–rs1800414–rs728405–rs728404–rs4778214–rs1448488–rs12903382–rs74653330–rs12910433–rs3794609–rs730502 to define the haplotype block (the relevant non-synonymous polymorphisms are labeled in bold), our results indicate that, from the ancestral haplotype ‘AAGAGCAGGTT’, a non-synonymous mutation at rs1800414 originated the haplotype ‘AGGAGCAGGTT’, and another non-synonymous mutation independently originated the haplotype ‘AAGAGCAAGTT’. Both derived haplotypes then increased in frequency in different regions of East Asia. The haplotype ‘AGGAGCAGGTT’ is now the most common haplotype in a broad region of East Asia, whereas the haplotype ‘AAGAGCAAGTT’ has become the most prevalent in northern East Asia. Several lines of evidence indicate that this increase in frequency may have been the result of positive selection favoring light skin in high-latitude regions. Both derived alleles are non-synonymous variants predicted to have a functional effect,11 and both have been associated with lighter skin pigmentation in East-Asian populations.5,10,11 In addition, several studies have identified signatures of positive selection in the OCA2 region in genome-wide scans in East-Asian populations.2,3 The geographic distribution of the variants strongly suggests that these two mutations arose after the separation of European and East-Asian populations. This is supported by a recent study that dated the derived G allele of the OCA2 rs1800414 polymorphism to ~10,000 years ago.17 To our knowledge, there has been no attempt to date the polymorphism rs74653330. We used the dense, genome-wide SNP data available for the HGDP–CEPH panel to estimate the ages of the derived alleles at rs1800414 and rs74653330 in East-Asian populations. We used a method18 that relies on the decay of haplotype sharing of the ancestral genomic segment on which the derived mutations occurred. Before the analysis, we removed individuals with pi-hat values exceeding 0.05 to minimize potential problems with cryptic relatedness. To account for the possibility that members of individual populations may have a most recent common ancestor (MRCA) that is more recent than the MRCA of the entire East-Asian sample, we calculated these age estimates assuming a correlated genealogy.18 Under these conditions, and assuming a generation time of 29 years,19 we estimated the age of the derived allele at rs74653330 to be 6,835 years (95% confidence interval (CI): 1,070–12,798). The estimated age of the derived allele at rs1800414 is quite similar at 6,397 years (95% CI: 1,183–11,446 years). This is slightly younger than a previous estimate of the age of the derived allele at rs1800414 using a different method (10,660 years; 95% CI of 8,070–15,780),17 although the CIs of our estimate overlap Chen’s point estimate. The discrepancy in age may be explained by differences in the two methods as well as in differences among the East-Asian populations and the data sets used in each study. |
|

