|
|
Post by Admin on Oct 31, 2023 20:25:01 GMT
Results and discussion
Our search for a population admixed for Native American/African ancestries with minimal European admixture led us to the ‘Carib’ population in the Commonwealth of Dominica. Observations from an initial trip to Dominica suggested wide variation in Kalinago skin color. Pursuit of the genetic studies described here required learning about oral and written histories, detailed discussion with community leadership, IRB approval from Ross University (until Hurricane Maria in 2017, the largest medical school in Dominica) and the Department of Health of the Commonwealth of Dominica, and relationship-building with three administrations of the Kalinago Council over 15 years.
Population sample
Our DNA and skin color sampling program encompassed 458 individuals, representing 15% of the population of the territory and all three known albino individuals. Ages ranged from 6 to 93 (Appendix 1—table 1 and Figure 1—figure supplement 3). We were able to obtain genealogical information for about half of the parents (243 mothers and 194 fathers). Community-defined ancestry (described as ‘Black,’ ‘Kalinago,’ or ‘Mixed’) for both parents was obtained for 426 individuals (92% of sample), including 108 parents from whom DNA samples were obtained (72 Kalinago, 36 Mixed, and 0 Black). They described themselves as Black, Kalinago, or Mixed from their perceived understanding of their parents or grandparents skin color.
Kalinago genetic ancestry
The earliest western mention of the Kalinago (originally as ‘Caribs’) was in Christopher Columbus’s journal dated November 26, 1492 (Honychurch, 2012). Little is known about the detailed cultural and genetic similarities and differences between them and other Caribbean pre-contact groups such as the Taino. African admixture in the present Kalinago population derived from the African slave trade; despite inquiry across community, governmental, and historical sources, we were unable to find documentation of specific regions of origin in Africa or well-defined contributions from other groups. The population’s linguistics are uninformative, as they speak, in addition to English, the same French-based Antillean Creole spoken on the neighboring islands of Guadeloupe and Martinique.
To study Kalinago population structure, we analyzed an aggregate of our Kalinago SNP genotype data and HGDP data (Li et al., 2008) using ADMIXTURE (Figure 1 and Figure 1—figure supplement 1) as described in Materials and methods. At K=3, the ADMIXTURE result confirmed the three major clusters, corresponding roughly to Africans (black cluster), European/Middle Easterners/Central and South Asians (yellow cluster), and East Asians/Native Americans (green cluster). At K=4 and higher, the red component that predominates Native Americans separates the Kalinago from the East Asians (green cluster). Consistent with prior work (Li et al., 2008), a purple cluster (Oceanians) appears at K=5 and a brown cluster (Central and South Asians) appears at K=6; both are minor sources of genetic ancestry in our Kalinago sample (average <1%) (Appendix 1—table 2).
|
|
|
|
Post by Admin on Nov 1, 2023 21:48:38 GMT
Figure 1 with 3 supplements 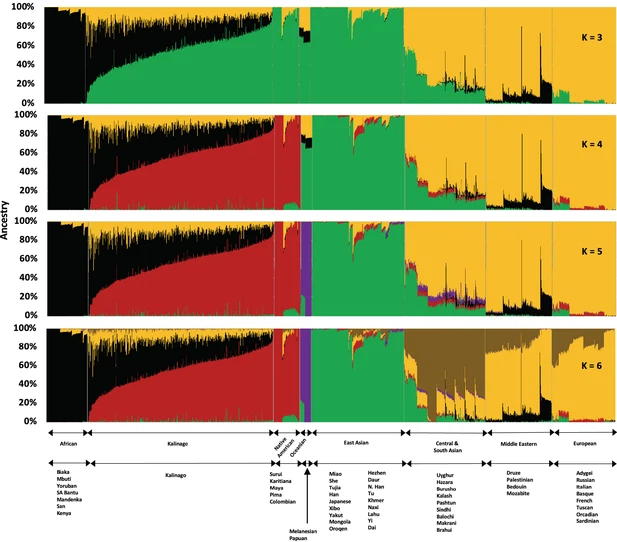 Admixture analysis of Kalinago compared with Human Genome Diversity Project populations. Results are depicted using stacked bar plots, with one column per individual. At K=3, the Kalinago, Native Americans, Oceanians, and East Asians fall into the same green cluster. At K=4, the Native … At K=4 to K=6, the Kalinago show on average 55% Native American, 32% African, and 11–12% European genetic ancestry. Estimates from a two-stage admixture analysis are similar, as are results from local genetic ancestry analysis (see Materials and methods) (Appendix 1—table 3), leading to estimates of 54–56% Native American, 31–33% African, and 11–13% European genetic ancestry. The individual with the least admixture has approximately 94% Native American and 6% African genetic ancestry. The results of the principal component (PC) analysis (PCA) (Figure 2—figure supplement 1) were consistent with ADMIXTURE analysis. The first two PCs suggest that most Kalinago individuals show admixture between Native American and African genetic ancestry, with a smaller but highly variable European contribution apparent in the displacement in PC2 (Figure 2—figure supplement 1). A smaller number of Kalinago individuals with substantial East Asian genetic ancestry exhibit displacement in PC3 (Figure 2—figure supplement 1). Our analysis of Kalinago genetic ancestry revealed considerably more Native American and less European genetic ancestry than the Caribbean samples of Benn Torres et al., 2013, and the admixed populations from the 1000 Genomes Project (1KGP) (Auton et al., 2015; Figure 2). Some Western Hemisphere Native Americans reported in Reich et al., 2012, have varying proportions of European but very little African admixture (Figure 2B). Overall, the Kalinago have more Native American and less European genetic ancestry than any other Caribbean population. |
|
|
|
Post by Admin on Nov 3, 2023 6:33:37 GMT
Figure 2 with 2 supplements 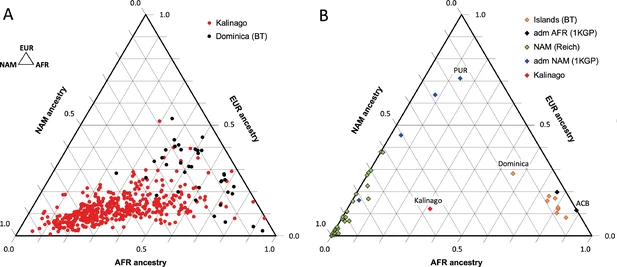 Comparison of Kalinago genetic ancestry with that of other populations in the Western Hemisphere. Ternary plots of genetic ancestry from our work and the literature show estimated proportions of African (AFR), European (EUR), and Native American (NAM) genetic ancestry. (A) Comparison of … see more The 55% Native American genetic ancestry calculated from autosomal genotype in the Kalinago is greater than the reported 13% in Puerto Rico (Gravel et al., 2013), 10–15% for Tainos across the Caribbean (Schroeder et al., 2018), and 8% for Cubans (Marcheco-Teruel et al., 2014). This is also considerably higher than the reported 6% Native American genetic ancestry found in Bwa Mawego, a horticultural population that resides south of the Kalinago Territory (Keith et al., 2021). However, this result is lower than the 67% Native American genetic ancestry reported by Crawford et al., 2021, for an independently collected Kalinago samples based on the mtDNA haplotype analysis. This difference suggests a paternal bias in combined European and/or African admixture. Since our Illumina SNP-chip genotyping does not yield reliable identification of mtDNA haplotypes, we are currently unable to compare maternal to autosomal genetic ancestry proportions for our sample. Samples genotyped using 105 genetic ancestry informative markers from Jamaica and the Lesser Antilles (Benn Torres et al., 2015) yielded an average of 7.7% Native American genetic ancestry (range 5.6%–16.2%), with the highest value from a population in Dominica sampled outside the Kalinago reservation. Relevant to the potential mapping of Native American light skin color alleles, the Kalinago population has among the lowest European genetic ancestry (12%) compared to other reported Caribbean Native Americans in St. Kitts (8.2%), Barbados (11.5%), and Puerto Rico (71%) (Benn Torres et al., 2013). Contributing to the high percentage of Native American genetic ancestry in the Kalinago is their segregation within the 3700 acre Kalinago Territory in Dominica granted by the British in 1903, and the Kalinago tradition that women marrying non-Kalinago are required to leave the Territory; non-Kalinago spouses of Kalinago men are allowed to move to the Territory (KCA, KCC, Personal Communication with Kalinago Council, 2014). These factors help to explain why samples collected outside the Kalinago Territory (Benn Torres et al., 2013) show lower fractional Native American genetic ancestry. During our fieldwork, it was noted that members of the Kalinago community characterized themselves and others in terms of perceived genealogical ancestry as ‘Black,’ ‘Kalinago,’ or ‘Mixed.’ Compared to individuals self-identified as ‘Mixed,’ those self-identified as ‘Kalinago’ have on average more Native American genetic ancestry (67% vs 51%), less European genetic ancestry (10% vs 14%), and less African genetic ancestry (23% vs 34%) (Figure 2—figure supplement 2). Thus, these folk categories based on phenotype are reflected in some underlying differences in genetic ancestry. |
|
|
|
Post by Admin on Nov 4, 2023 5:25:39 GMT
Kalinago skin color variation
Melanin index unit (MI) calculated from skin reflectance measured at the inner upper arm (see Materials and methods) was used as a quantitative measure of melanin pigmentation (Ang et al., 2012; Diffey et al., 1984). MI determined in this way is commonly used as a measure of constitutive skin pigmentation (Choe et al., 2006; Park and Lee, 2005). The MI in the Kalinago ranged from 20.7 to 79.7 (Figure 4—figure supplement 1), averaging 45.7. The three Kalinago albino individuals sampled had the lowest values (20.7, 22.4, and 23.8). Excluding these, the MI ranged between 28.7 and 79.7 and averaged 45.9. For comparison, the MI averaged 25 and 21 for people of East Asian and European genetic ancestry, respectively, as measured with the same equipment in our laboratory (Ang et al., 2012; Tsetskhladze et al., 2012). This range is similar to that of another indigenous population, the Senoi of Peninsular Malaysia (MI 24–78; mean = 45.7) (Ang et al., 2012). The Senoi are believed to include admixture from Malaysian Negritos whose pigmentation is darker (mean = 55) (Ang et al., 2012) than that of the average Kalinago. In comparison, the average MI was 53.4 for Africans in Cape Verde (Beleza et al., 2012) and 59 for African-Americans (Shriver et al., 2003). Individuals self-described as ‘Kalinago’ were slightly lighter and had a narrower MI distribution (42.5± 5.6, mean ± SD) compared to ‘Mixed’ (45.8± 9.6) (Figure 4—figure supplement 2).
An OCA2 albinism allele in the Kalinago
OCA is a genetically determined condition characterized by nystagmus, reduced visual acuity, foveal hypoplasia, and strabismus as well as hypopigmentation of the skin, hair, and eye (Dessinioti et al., 2009; van Geel et al., 2013). The three sampled albino individuals had pale skin (MI 20.7, 22.4, and 23.8 vs. 29–80 for non-albino individuals), showed nystagmus, and reported photophobia and high susceptibility to sunburn. In contrast to the brown irides and black hair of most Kalinago, including their parents, the albino individuals had blonde hair and gray irides with varying amounts of green and blue.
To identify the albinism variant in the Kalinago, we first determined that none of the albino individuals carried any of 28 mutations previously found in African or Native American albino individuals (Carrasco et al., 2009; King et al., 2003; Stevens et al., 1997; Yi et al., 2003), including a 2.7 kb exon 7 deletion in OCA2 found at high frequency in some African populations. Whole exome sequencing of one albino individual and one parent (obligate carrier) revealed polymorphisms homozygous in the albino individuals and heterozygous in the parent, an initial approach that assumes that the albino individual was not a compound heterozygote. We identified 12 variant alleles in 7 OCA genes (or genomic regions) that met these criteria (summarized in Appendix 1—table 4). None were nonsense or splice site variants. Five of the twelve variants were intronic, one was synonymous, one was located in 5’UTR, and three were in the 3’UTR (Appendix 1—table 4). Two missense variants were found in OCA2: SNP rs1800401 (c.913C>T or p.Arg305Trp in exon 9), R305W, and multi-nucleotide polymorphism rs797044784 in exon 8 (c.819_822delCTGGinsGGTC; p.Asn273_Trp274delinsLysVal), NW273KV.
Among 458 Kalinago OCA2 genotypes, 26 carried NW273KV and 60 carried R305W (Table 1). Only NW273KV homozygotes were albino individual. We know that the allele responsible for albinism was NW273KV because neither of the two individuals, homozygous for R305W but not NW273KV, was albino individual. In further support of this conclusion is that one individual who was homozygous for R305W and homozygous ancestral for NW273 had an MI of 72, among the darkest in the entire population. R305W is notably present with frequency >0.10 in some African, South Asian, and European populations (Auton et al., 2015), predicting a Hardy-Weinberg frequency of homozygotes above 1%. This is far greater than the observed frequency of individuals with albinism and therefore inconsistent with the idea that this is not a variant responsible for albinism. The fact that R305W scores incorrectly as pathogenic using SIFT, Polyphen 2.0, and PANTHER that R305W (Kamaraj and Purohit, 2014) suggests a need for refinement of these methods. The universal association of R305W with the NW273KV haplotype indicates that the founder haplotype of the NW273KV albinism mutation carried the silent R305W variant.
|
|
|
|
Post by Admin on Nov 5, 2023 21:03:24 GMT
To identify the origin of the albino allele, albino individuals and carriers were analyzed for regions exhibiting homozygosity, and identity-by-descent and local genetic ancestry was estimated (see Materials and methods). All three albino individuals share a homozygous segment of ~1.7 Mb that encompasses several genes in addition to OCA2 (Figure 3). The albino haplotype defined by homozygosity in individuals 2 and 3 extends ~11 Mb; comparison to local genetic ancestry shows that this haplotype is clearly of African origin. Figure 3 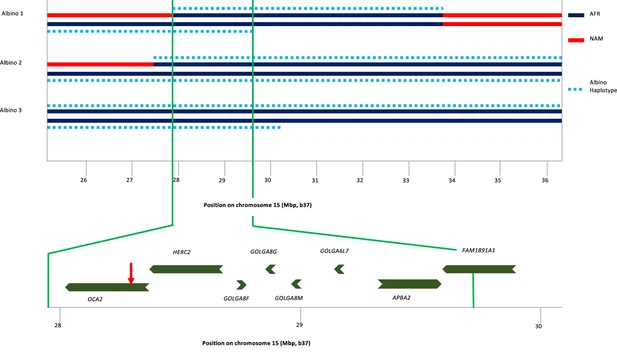 Haplotype analysis for three albino individuals. The inner two lines indicate NAM (red) or AFR (dark blue) genetic ancestry; no EUR genetic ancestry was found in this genomic region. For this local genetic ancestry analysis, the region shown here … see more The Kalinago albino individuals are the only reported individuals where the albinism was caused by homozygosity for the NW273KV allele of OCA2. Two reported albino individuals of African-American/Dutch descent were compound heterozygotes for the OCA2 mutation, with one allele being the NW273KV variant chromosome (Garrison et al., 2004; Lee et al., 1994). Conservation of the NW sequence among vertebrates and its inclusion in a potential N-linked glycosylation site (Rinchik et al., 1993) that is eliminated by the mutation supports the variant’s pathogenicity. The NW273KV frequency in our sample (0.03) translates into a Hardy-Weinberg albinism frequency (p2=0.0009) of ~1 per 1000, as observed (3 in a population of about 3000). Examination of publicly available data reveals three OCA2NW273KV heterozygotes in the 1000 Genome Project, a pair of siblings from Barbados (ACB) and one individual from Sierra Leone (MSL). The three 1KGP individuals share a haplotype of ~1.5 Mb, of which ~1.0 Mb matches the albino haplotype in the Kalinago. The phasing for the OCA2NW273KV variant in the public data is inconsistent, with the variant assigned to the wrong chromosome for the ACB siblings. |
|

