|
|
Post by Admin on Apr 25, 2017 19:58:39 GMT
 [R]esearchers from the Wellcome Trust Sanger Institute and elsewhere analyzed the Y chromosomes of more than 1,200 men from 26 populations using data collected by the 1000 Genome Project. After examining about 65,000 variants contained within this dataset, the researchers constructed a phylogenetic tree — a tree, they noted, that more closely resembled a bush in some spots. “This pattern tells us that there was an explosive increase in the number of men carrying a certain type of Y chromosome, within just a few generations,” co-lead author Yali Xue from the Sanger Institute said in a statement. “We only observed this phenomenon in males, and only in a few groups of men.” 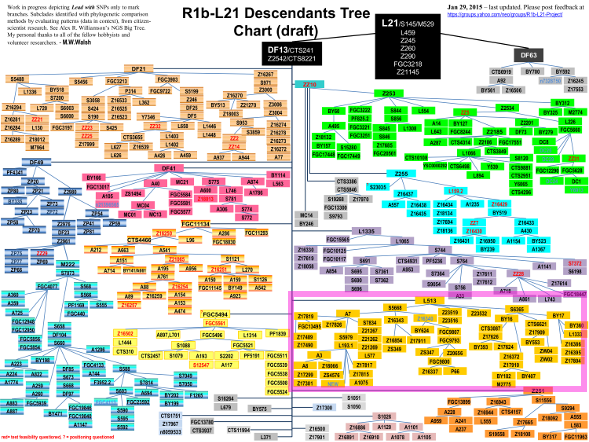 Xue and her colleagues drew upon a set of 1,244 Y chromosomes from men belonging to 26 world populations. … [T]he branching patterns they observed among several lineages indicated extreme expansion some 50,000 years to 55,000 years ago as well as within the last few thousand years. The expansion 50,000 years to 55,000 years ago was also linked to an increase in lineages outside of Africa and could, they suggested, reflect the expansion of Eurasian populations.  It also supports the previously proposed notion that haplogroup E, which is the most predominant one in Africa, actually arose outside the continent and arrived there through gene flow from Asia some 50,000 years to 80,000 years ago. The phylogenetic tree also hints that lineages that have spread throughout Eurasia may have first diversified within South and Southeast Asia. … [These branching patterns] suggested that… bursts of male population growth might correspond to historical events. For instance, they noted an expansion of the Q1a-M3 lineage in the Americas some 15,000 years ago, which roughly corresponds with initial peopling there. In addition, they found that both the Eb1-M180 lineages in sub-Saharan Africa underwent an expansion about 5,000 years ago at about the time of the Bantu expansion. Finally, within Western Europe, they said the expansion of the R1b-L11 lineages some 4,800 years to 5,900 years ago could be associated with the rise of the Bronze Age Yamnaya culture. %2BExcerpt.jpg) The researchers were less certain about the reasons behind some of the other late expansions they observed. “The best explanation is that they may have resulted from advances in technology that could be controlled by small groups of men,” the Sanger Institute’s Chris Tyler-Smith added. “Wheeled transport, metal working, and organized warfare are all candidate explanations that can now be investigated further.” |
|
|
|
Post by Admin on Aug 21, 2017 19:04:15 GMT
 Figure 1 Simplified phylogenetic tree of the R1b-M269 haplogroup. SNPs in italics were not analyzed in this manuscript. Over one thousand individuals carrying DF27 were typed for six additional SNPs (Table 1, Fig. 1) and 17 Y-STRs. DF27 itself was found at frequencies 0.3–0.5 in Iberia (with a mean of 0.42), with the notable exception of native Basques, where it reached 0.74 (for this and all subsequent frequency values, see Fig. 2 and Supplementary Table 1). In France, it dropped to a range of 0.06–0.20 and a mean of 0.11. Elsewhere, it was 0.15 in Britain (but <0.01 in Ireland) and 0.08 in Tuscany. Most (50–100%, with a proportion that dropped from East to West) DF27 Y chromosomes were also derived for Z195; thus, the highest frequencies of Z195 (0.29–0.41) were reached both in the Basque Country and in E Iberia (Catalonia, Valencia), and it becomes as rare in Portugal as it is in France. Conversely, the highest frequencies of R1b-DF27* (xZ195) are found in Native Basques and Western Iberian populations such as Asturias, Portugal and Galicia, which may harbor yet unknown branches of R1b-DF27. In turn, Z195 splits into two branches, namely L176.2 and Z220 (Fig. 1). Note that L176 is a recurrent mutation that defines two clades in the Y phylogeny: L176.1 within R1a, and L176.2 under R1b-DF27; throughout this manuscript, we will refer exclusively to the latter. L176.2 and Z220 peak, respectively, in E Iberia and the Basque Country. L176.2 is further subdivided into M167 (SRY2627, ref. 21), with the highest frequencies in Catalonia and the lands settled from Catalonia in the 13th century (Valencia, the Balearics). This marker had been typed in a number of Iberian and other European populations4, 18,19,20, 22,23,24,25, and the overall frequency pattern found (Supplementary Figure 1) confirms a distribution centred in the eastern half of Iberia, although with higher frequencies (up to 0.16) in the upper Ebro river valley and the Pyrenees. As mentioned above, Z220 is most frequent in the Basque Country (0.28), and a similar pattern is found for its successive nested clades, namely Z278 and M153. For the latter, available additional data22, 23, 25 showed it confined to the Iberian Peninsula, with frequencies 0.06–0.40 among Basque subpopulations, but rarely above 0.01 elsewhere (Supplementary Figure 1). 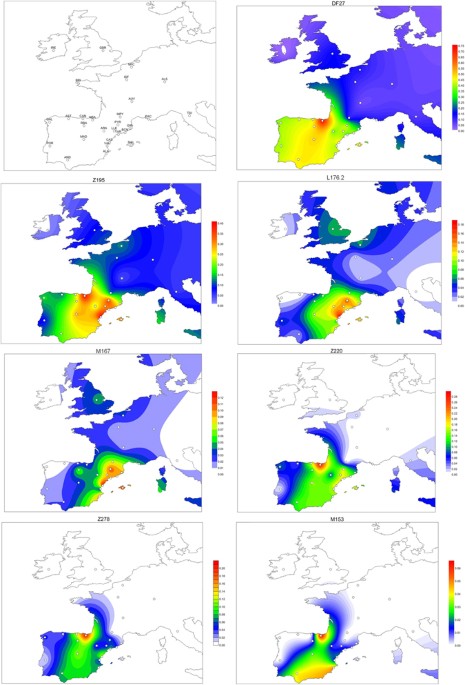 Figure 2 Contour maps of the derived allele frequencies of the SNPs analyzed in this manuscript. Population abbreviations as in Table 1. Maps were drawn with SURFER v. 12 (Golden Software, Golden CO, USA). The subhaplogroup frequencies were summarized in a PC plot (Fig. 3). The first PC separated the Iberian populations (save for the three westernmost samples, namely Portugal, Galicia, and Asturias) from the rest, explained 68.6% of the total variation, and was positively correlated with DF27 and all of its subhaplogroups. On the contrary, PC2 (20.9%) was positively correlated with L176.2 and M167 and most negatively correlated with Z278 and M153, and separated most Eastern Iberian populations from the rest. |
|
|
|
Post by Admin on Aug 22, 2017 19:47:02 GMT
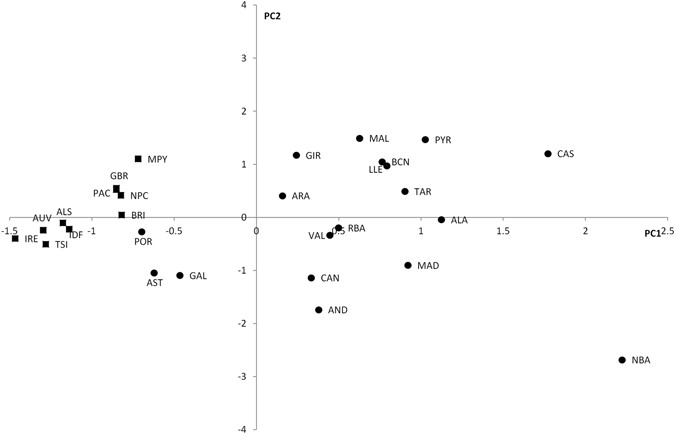 Figure 3 Principal component analysis of subhaplogroup frequencies. Population abbreviations as in Table 1. Circles: Iberian populations; squares: non-Iberian populations. In order to quantify the structure of subhaplogroup frequencies, we performed AMOVA with several population groupings. Thus, if we compared Iberian populations vs. the rest, the proportion of the variance explained by the differences among these two groups (i.e., F CT ) was 12.40% (p < 10−4), while the proportion of the variance found within groups (i.e., F SC ) was 3.20% (p < 10−4). If the native Basques were split from the Iberians, then F CT = 13.57% (p < 10−4) and F SC = 1.37% (p < 10−4). Finally, if Eastern Iberians are also split from the rest of Iberians, then F CT = 11.68% (p < 10−4) and F SC = 0.31% (p = 0.0106). In conclusion, the differences among the groups that are apparent in the PCA plot are highly statistically significant. Haplotypes comprising 17 Y-STRs were available for 758 individuals (Table 2). AMOVA among this set of populations gave R ST = 0.72% (p = 0.00386), while, for the same populations, subhaplogroup frequencies yielded F ST = 8.33% (p < 10−4). Thus, Y-STRs seem to capture much less phylogeographic structure than SNPs themselves, as described for R1b-M26911, 12. Still, some Y-STR structure may be present within R1b-DF2712, 17. Since a median-joining tree with 688 different haplotypes is unmanageable, we resorted to principal component analysis (PCA) among haplotypes (Fig. 4). The first PC explained 15.1% of the STR variation and correlated mostly with DYS437 (r = 0.865), DYS448 (r = 0.858), and YGATAH4 (r = 0.724), and separated haplotypes that carried the derived allele for Z220 (that is, belonging to R1b-Z220*, R1b-Z278* and R1b-M153) from the rest. PC1 coordinates were highly significantly different by subhaplogroup (p ~ 10−150, ANOVA). The median haplotype for Z220-derived chromosomes was 11-14-18 at YGATAH4-DYS437-DYS448 while it was 12-15-19 for the rest of DF27 chromosomes (other STRs showed the same median allele). PC2 explained 8.6% of the STR variation and correlated with DYS390 (r = 0.647) and DYS456 (r = −0.544), and separated R1b-Z220* from R1b-Z278* chromosomes; overall, R1b-DF27 subhaplogroups had significantly different PC2 coordinates (p = 9.12 × 10⁻⁴). The same PC results can also be analyzed by population (Fig. 4b): PC1 coordinates are statistically significantly different by population (ANOVA, p = 0.00512), with the French samples having higher, positive values in this PC, while PC2 is not significant across populations (p = 0.781). These results can be explained by the very low frequency of Z220-derived chromosomes outside of Iberia. 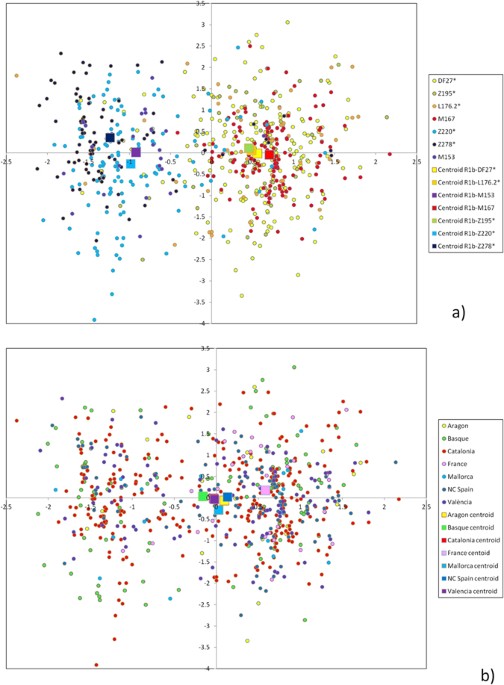 Figure 4 Principal component analysis of STR haplotypes. (a) Colored by subhaplogroup, (b) colored by population. Larger squares represent subhaplogroup or population centroids. Internal diversity and ages of DF27 and its derived subhaplogroups The average STR variance of DF27 and each subhaplogroup is presented in Suppl. Table 2. As expected, internal diversity was higher in the deeper, older branches of the phylogeny. If the same diversity was divided by population, the most salient finding is that native Basques (Table 2) have a lower diversity than other populations, which contrasts with the fact that DF27 is notably more frequent in Basques than elsewhere in Iberia (Suppl. Table 1). Diversity can also be measured as pairwise differences distributions (Fig. 5). The distribution of mean pairwise differences within Z195 sits practically on top of that of DF27; L176.2 and Z220 have similar distributions, as M167 and Z278 have as well; finally, M153 shows the lowest pairwise distribution values. This pattern is likely to reflect the respective ages of the haplogroups, which we have estimated by a modified, |
|
|
|
Post by Admin on Aug 23, 2017 18:59:54 GMT
 Figure 5 Cumulative distributions of the number of pairwise absolute differences in repeat size among individuals, by subhaplogroup. We estimated an age of 4190 ± 140 ya for the whole of DF27. This figure is remarkably similar both to the estimate (4128 ± 71 ya) that can be produced from whole Y-chromosome sequence variability in the 88 DF27-derived individuals present overall in the 1000 genomes project dataset, and to the age estimated from 201 individuals in our dataset for which 21 non-duplicated Y-STRs from the Powerplex Y23 System were available26 (3880 ± 165). Z195 seems to have appeared almost simultaneously within DF27, since its estimated age is actually older (4570 ± 140 ya). Of the two branches stemming from Z195, L176.2 seems to be slightly younger than Z220 (2960 ± 230 ya vs. 3320 ± 200 ya), although the confidence intervals slightly overlap. M167 is clearly younger, at 2600 ± 250 ya, a similar age to that of Z278 (2740 ± 270 ya). Finally, M153 is estimated to have appeared just 1930 ± 470 ya.  Haplogroup ages can also be estimated within each population, although they should be interpreted with caution (see Discussion). For the whole of DF27, (Table 3), the highest estimate was in Aragon (4530 ± 700 ya), and the lowest in France (3430 ± 520 ya); it was 3930 ± 310 ya in Basques. Z195 was apparently oldest in Catalonia (4580 ± 240 ya), and with France (3450 ± 269 ya) and the Basques (3260 ± 198 ya) having lower estimates. On the contrary, in the Z220 branch, the oldest estimates appear in North-Central Spain (3720 ± 313 ya for Z220, 3420 ± 349 ya for Z278). The Basques always produce lower estimates, even for M153, which is almost absent elsewhere. The relevance and possible applications of R1b-DF27 Although R1b-DF27 as a whole has remained relatively obscure in the academic literature, two of the SNPs it contains, namely M167 (SRY2627) and M153 have accrued quite a number of studies. Thus, excluding this paper, M153 has been typed in 42 populations, for a total of 3,117 samples22, 23, 25, 29, 30; M167 has been typed in at least 113 populations and 10,379 individuals4, 18,19,20, 22,23,24,25, 29,30,31. It is not obvious then why both markers are absent from Y-phylotree ( www.phylotree.org/Y/tree/index.htm, ref. 32), which is the current academic Y-chromosome haplogroup reference tree and which contains within DF27 a number of much more obscure SNPs. |
|
|
|
Post by Admin on Aug 24, 2017 19:06:59 GMT
 Potentially, a SNP with relatively high frequencies in Iberian and Iberian-derived populations and rarer elsewhere could be applied in a forensic genetics setting to infer the biogeographic origin of an unknown contributor to a crime scene33. However, neither the specificity nor the sensitivity of such an application would guarantee significant investigative leads in most cases. When compared to the 1000 genomes CEU sample of European-Americans15, R1b-DF27 is just 4.19 times more frequent in Iberians than in CEU, a ratio that raises to 6.82 for R1b-Z220 (which, though, has a frequency of only 13.9% in Iberians). Probably, other types of evidence of the involvement of a person of interest of Iberian descent would be needed to justify tying R1b-DF27. R1b-DF27 may also be used to trace migratory events involving Spanish or Portuguese men, particularly outside of Western Europe; a clear example can be seen the Latin American populations (see the Introduction section), where R1b-DF27 seems to correlate with the amount of male-mediated Spanish admixture: it is clearly less frequent in the populations with a stronger Native American component, such as Mexico and Peru. Even within Europe, Y haplogroup frequencies have been used to detect short-range migration events, such as that from Northern France to Flanders34. Thus, the traces of the medieval expansion of the Aragon kingdom towards the Mediterranean in the 14th–15th centuries, or the Castilian occupation of Flanders in the 17th century may be traced through the male lineages, R1b-DF27 in particular. 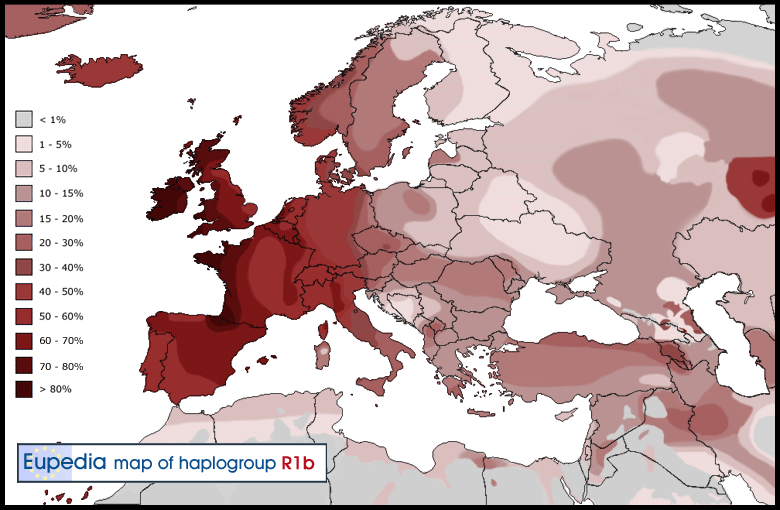 Finally, the Y chromosome in often studied in connection with surnames, since the latter are also often transmitted through the male line35. For that, Y-STR haplotypes are analyzed, and, given the Y-STR mutation rates, similarity in Y-STR haplotypes between men sharing the same surname is taken as indicative of a shared genealogical origin36, 37. However, diversity in Y-STR haplotypes within the R1b-M269 branch is rather small11, 12, and the sole use of Y-STRs may result in homoplasy, rather than shred origin, causing Y-STR haplotype convergence. Thus, particularly within Iberia, R1b-DF27 should be used when trying to ascertain the founding events of surnames. No SNP deeper than R1b-M269 was typed in a survey of Spanish surnames38, while some SNPs in the R1b-DF27 branch (Z195, Z220, Z278, M153 and M167) were used in a similar study27. Although we have contributed to the understanding of the phylogeography of R1b-DF27, which makes up a dominant fraction of Iberian (and Latin American) Y chromosomes, better tools and designs would be needed to solve some of the issues we discussed above. In particular, we genotyped pre-ascertained SNPs, and a global characterization of the whole sequence diversity of this haplogroup would allow more precise statistical analyses to be run. Also, a more comprehensive sampling scheme, including more information from Atlantic Iberia, would be desirable to obtain a more accurate picture of this haplogroup. Scientific Reports 7, Article number: 7341 (2017) |
|


%2BExcerpt.jpg)


